Wayne State University
DigitalCommons@WayneState
Working Group on Interlocal Services Cooperation Political Science
8-29-2007
Explaining Horizontal and Vertical Cooperation on
Public Services in Michigan: The Role of Local
Fiscal Capacity
Jered B. Carr
Wayne State University, [email protected] Elisabeth R. Gerber
University of Michigan, [email protected] Eric W. Lupher
Citizens Research Council of Michigan, [email protected]
This Article is brought to you for free and open access by the Political Science at DigitalCommons@WayneState. It has been accepted for inclusion in Working Group on Interlocal Services Cooperation by an authorized administrator of DigitalCommons@WayneState.
Recommended Citation
Carr, Jered B.; Gerber, Elisabeth R.; and Lupher, Eric W., "Explaining Horizontal and Vertical Cooperation on Public Services in Michigan: The Role of Local Fiscal Capacity" (2007).Working Group on Interlocal Services Cooperation.Paper 34.
Explaining Horizontal and Vertical Cooperation on Public Services
in Michigan: The Role of Local Fiscal Capacity
Jered B. Carr Wayne State University
[email protected] Elisabeth R. Gerber University of Michigan
[email protected] Eric W. Lupher
Citizens Research Council of Michigan
August 2007
Abstract
Michigan local governments engage in a wide range of cooperative activities. Little is known, however, about what factors motivate local governments to engage in
intergovernmental cooperation and how local government officials choose among various forms of collaboration. We develop and test a theory of intergovernmental cooperation that explains differences in the factors that lead local governments to engage in horizontal cooperation with other local units versus vertical cooperation with county or state
governments. Our primary focus is on fiscal capacity: we hypothesize that limited fiscal capacity leads many local governments, especially townships, to work collaboratively with state or county actors to provide government services. Local governments with greater fiscal capacity, especially cities, are stronger potential partners and so are more likely to collaborate with other local governments using horizontal arrangements. We expect other factors, such as population characteristics, local and regional economic factors, federal or state mandates, and the existence of collaborative partners, to matter as well. We test these hypotheses with survey data collected in 2005 by the Citizens
Research Council of Michigan on the mode of service provision employed by 460 Michigan local governments across 115 service categories. We find strong support for our propositions about the linkage between local fiscal capacity and intergovernmental cooperation on public services.
Chapter in Metropolitan Affairs in Michigan, Michigan State University Press, Forthcoming, 2008.
Explaining Horizontal and Vertical Cooperation on Public Services in Michigan: The Role of Local Fiscal Capacity
Michigan’s local governments face an increasingly difficult environment for providing high quality municipal services to their residents: they are feeling the effects of a single state recession, legislative policies that limit their ability capitalize on their own-source revenues, and cost pressures from various sources. Michigan’s weak economy, which has reduced state tax revenues, has led to cuts in funding for state revenue sharing programs that provide funding for local government operations. At the same time, constitutional and statutory policies have created property tax limitations that hamper the ability of local governments to benefit from year-to-year growth in the value of property. At the same time, the cost of providing local government services is increasing. Health care expenses, legacy costs, and the price of some common inputs like motor fuel, continue to escalate. In the face of these pressures, local government officials have three options: (1) increase taxes to raise more revenues; (2) reduce spending to alter the menu of services provided to their residents; and/or (3) find alternative methods of providing services at current levels while reducing costs.
Interlocal collaboration for the provision of governmental services is one such alternative method. Michigan local governments already engage in a wide range of cooperative activities. Despite the state’s strong home rule traditions and lack of strong mandates or incentives for engaging in collaborative service arrangements, significant numbers of local governments currently cooperate with other governments to provide such services as firefighting, libraries, water and sewer, emergency dispatch, public transit, watershed management, and many others (CRC, 2005).
Yet in spite of the frequency of this collaboration, our understanding of the factors affecting intergovernmental cooperation remains fairly rudimentary. Previous studies have attempted, with only limited success, to develop models illustrating the political, economic, and demographic factors affecting levels of interlocal cooperation (LeRoux, 2006; Krueger, 2005; Post, 2002; Rawlings, 2003; Wood, 2004; Zeemering, 2007). Consistent patterns have yet to emerge from this research literature. Likewise, even as local government officials have long recognized the role of intergovernmental
cooperation, it is often clear to them what services are the strongest candidates for
collaboration and which other governmental units are the best candidates for partnerships. We suspect that a key reason for the lack of consensus in past studies, and for a lack of clarity among local officials, is that local governments pursue different types of cooperation for different reasons. In particular, we propose that a fundamentally different calculation underlies the choice between horizontal and vertical cooperation on public services for many municipal governments. By horizontal cooperation, we mean joint activities involving two or more governmental units at the same level of government. Common examples include joint police and fire dispatch and library districts between cities, villages, and townships. We view these forms of horizontal cooperation as
voluntary exchange relationships between two or more local governments in which each sees benefits to the cooperation, net of its costs. In contrast, by vertical cooperation, we refer to cooperation between units at different levels of government. Vertical cooperation includes townships, villages, or cities contracting for services with county or state
government and joint provision of services between municipal governments and the county or state. Common examples include county-local emergency planning, animal
control, and environmental initiatives. We view these forms of vertical cooperation as dependency relationships in which the costs and benefits of cooperation are highly asymmetric to actors at different levels of government.
This chapter seeks to improve the understanding of intergovernmental
collaboration by explaining existing patterns of horizontal and vertical cooperation in Michigan. The remainder of this chapter is organized as follows. In the next section, we present our hypotheses about the determinants of several different modes of service provision, including horizontal and vertical cooperation, as well as self-provision. We focus most directly on the effects of local fiscal capacity in these decisions, as measured by a jurisdiction’s total property value and taxing authority. Next, we describe our unique dataset and report descriptive statistics about patterns of service delivery arrangements in Michigan. We follow with multivariate analyses for each mode of service provision. We find that variations in fiscal capacity, both in terms of fiscal powers permitted to the unit and the amount of property wealth in the jurisdiction, affect the likelihood of
intergovernmental cooperation. We conclude by summarizing our findings and discussing the policy implications of this work.
Local Fiscal Capacity and Intergovernmental Contracting
We conceptualize a local government’s decision to cooperate on service provision as resulting from a consideration of the relative costs and benefits of four different options: (1) self-providing the service; (2) cooperating with one or more peer governments (i.e., horizontal cooperation); (3) cooperating with the state or county (i.e., vertical
We begin with the assumption that municipal governments are inclined to self-provide services. Maintaining autonomy over service decisions is highly valued in many communities in Michigan and local government policymakers can be expected to prefer to construct facilities, purchase equipment, and employ the municipal staff required to provide services on their own. Direct provision of services contributes to the
community’s identity, character, and quality of life, and enables elected officials to provide personalized service to residents (Visser, 2004). The attraction of these benefits to residents and local government officials in Michigan is strong (Zeemering, 2007). However, direct provision of certain services can be prohibitively costly to many local governments.
When direct service provision becomes cost prohibitive, local government policymakers consider the relative costs and benefits of other forms of service delivery such as using interlocal agreements to cooperate with potential partners. Such
collaboration permits the separation of provision decisions from production decisions. This enables local governments to realize savings when the costs of producing and delivering services are distributed among a larger number of governments, while retaining some level of autonomy over provision decisions regarding service levels and quality.
Decisions about collaboration are driven by a combination of factors internal and external to the local government. In terms of internal factors, we are primarily concerned with the effect of local government fiscal capacity. Low fiscal capacity may result from several factors: low property values in rural or aging urban settings; a relative lack of aggregate property wealth in poor or sparsely populated communities; and constraints on
the ability of local units to raise revenues from their tax base arising from limits imposed by the state constitution, state laws, or their own charters.
We propose that fiscal capacity considerations lead local governments to think about the opportunities and challenges associated with each mode of service provision in different ways. Local governments with extremely low fiscal capacity have difficulty in meeting residents’ demands for public services within their budgets and may turn to other governments for services they cannot afford to provide alone. Their ability to find
suitable partners, however, is likely to be quite limited. Two poor or fiscally constrained local governments may be no better suited to provide services jointly than they are to provide those services individually. From the perspective of other local governments, the prospect of cooperating with a poor or fiscally constrained neighbor is likely to be seen negatively, since that partner has limited resources to contribute to the cooperative effort (Lackey, Freshwater, and Rupasingha 2002). Thus, we hypothesize that local
governments with lower fiscal capacity are less likely to engage in horizontal cooperation.
County or state governments, by contrast, already provide some of the same services as their constituent local governments and may be willing and able to offer support to those units. From the state or county’s perspective, a local government unable to provide basic services may lead to disinvestment, which ultimately affects not only the city or township tax base, but the state and county tax base as well. County or state governments may thus be motivated to partner with local governments, regardless of the local government’s resource base. Indeed, county and state governments may view their poorest or most fiscally constrained local units to be most worthy of support from their
limited resources. We therefore hypothesize that local governments with lower fiscal capacity are more likely to engage in vertical cooperation.
For other communities, fiscal necessity will be less desperate, yet they may still choose voluntary cooperation when the perceived benefits of cooperation outweigh the political costs of ceding authority over service provision. Such cooperation may be especially attractive to communities in the mid range of fiscal capacity: they are not so fiscally constrained as to view the cost of service provision as prohibitive, but they are sufficiently constrained to need to take advantage of opportunities for efficiency in service provision. For example, it may make sense for moderately constrained cities to jointly undertake substantial capital investments, either because they lack the ability to borrow enough funds individually or because they cannot fully exploit the economies of scale present in a particular investment by working alone. In these cases, local
governments may choose to partner with their neighbors, particularly if those neighbors face similar circumstances. We note that in these cases of horizontal cooperation, it is not the lack of fiscal capacity that brings local governments into collaborative relationships. Rather, it is the possibility of leveraging opportunities that are not available or not as attractive to local governments operating alone. We therefore hypothesize that local governments in the mid range of fiscal capacity are more likely to engage in horizontal cooperation.
The dynamics for communities in the mid range of fiscal capacity are quite different with respect to their need for county and state services. We expect that, when compared to their poorest counterparts, local governments with moderate fiscal capacity will feel less need for assistance from the state or county governments. We therefore
hypothesize that local governments in the mid range of fiscal capacity are less likely to engage in vertical cooperation.
Communities with the greatest fiscal capacity, by contrast, may prefer to retain authority over the provision of government services and provide them directly. These wealthy communities are not driven to cooperation by fiscal necessity. When they do choose joint service provision, the decision to cooperate will be more voluntary and based on cost containment rather than an inability to provide services individually. We therefore hypothesize that local governments with the greatest fiscal capacity are less likely to engage in either form of cooperation.
Other Internal and External Factors
In addition to fiscal capacity, other internal factors are expected to affect local governments’ choices of service provision. One set of factors is the jurisdiction’s
population size and the geographic dispersion of this population within the unit. Populous communities may face greater demands for services, as their populations comprise
numerous interests with diverse service needs (Oakerson 2004). Demands for expanded services may be even greater when the population is densely packed or the area covered by the government is relatively small, since the close and intense interactions of a dense population require greater government intervention to mitigate externalities (Frederickson 1999; Post 2002). Additional factors, such as the racial/ethnic composition and age distribution of the local population may also affect the unit’s service delivery choices. Older populations have been found to prefer direct service provision (Morgan and
to potential collaborators because they have more trouble achieving consensus on decisions about service levels and quality (Oakerson 2004). Therefore, we hypothesize that local governments with large populations and greater proportions of nonwhite and older residents are more likely to self-provide services.
Finally, we expect the number and spatial density of local governments in the region to affect opportunities for cooperation. “The geographic density of metropolitan area governments influences the ability of residents to live, work, and recreate in multiple communities, the likelihood that local officials will have personal as well as professional relationships, and the likelihood that policy spillovers will affect multiple communities” (Post, 2002: 124). Thus, we hypothesize that greater numbers of potential local
government partners increase the likelihood of horizontal cooperation. Geographically larger local governments are expected to be less likely to engage in horizontal
cooperation.
Second, the cost characteristics of each particular service are expected to affect the opportunity for and value of cooperation. There is little to be gained from
collaborating on labor-intensive services such as police patrol. Increasing the geographic area, the number of parcels, or the population to be served requires a commensurate increase in the staffing needed to provide the service, thereby increasing costs. For other services, however, there are economies to be gained through collaboration. Local governments can benefit from economies of scale inherent in capital-intensive services such as those requiring new facilities or equipment. Once the capital items are in place, the marginal cost to the governmental unit of providing services to an additional resident is small, and cooperation may allow participating governments to provide the service at a
more efficient scale, allowing them to capture unit-cost savings (LeRoux and Carr 2007; Post 2002). We therefore hypothesize that local governments will be less likely to engage in horizontal cooperation on labor-intensive services and will be more likely to engage in horizontal cooperation on capital-intensive services and activities.
Local governments also can benefit from economies in services that require personnel with high levels of technical skills such as environmental management or specialized legal services. These services, which can often be provided without regard to geographic connectedness, depend on the service provider employing personnel that have obtained specialized academic training or have been recognized in their fields through a professional certification program. Once those specialists are employed, the marginal cost to the governmental unit of providing services to additional residents is small. County or state governments may be well suited to employ these personnel and provide these services, since they can offer them to local units spread over a wide area. We therefore hypothesize that local governments will be more likely to engage in vertical cooperation on services that require technical expertise or training. We further hypothesize that local governments are most likely to self-provide basic government services, especially those that are labor-intensive and require relatively low levels of technical expertise.
Horizontal and Vertical Cooperation among Michigan Municipal Governments
We examine these propositions with data from a survey of municipal governments conducted by the Citizens Research Council of Michigan in 2005. A survey was mailed to the senior administrator in each city, village, and township government in 25 Michigan counties. Responses were received from 70 percent (460 units) of the governments
surveyed and were evenly distributed across the three types of jurisdictions.2 Survey respondents were asked to report the delivery mechanism for 115 services provided by the jurisdiction, grouped into 26 functional categories. For each service, the respondents were asked to indicate if their jurisdiction directly provides the service; provides to, has provided by, or jointly provides with another unit of government; provides through a special district; contracts with a private provider; or does not provide at all (CRC, 2005).3
We began our analysis by coding each of these services and functions according to the degree of labor- or capital-intensiveness, the need for technical expertise or training, and whether or not the service area is considered a basic service. Each function was coded in terms of the expected financial and technical burden placed on local
governments initiating provision of the service. The capital-intensiveness of each service area was judged based on the cost of constructing, building, or acquiring the land,
buildings, vehicles, or equipment needed to provide each service. The need for technical expertise or training was based on the need for the government to employ personnel with college degrees or professional certification to provide that service or function. Finally, basic services were defined as those services that citizens initiating establishment of a new government would expect that government to provide at a minimum. The coding of the services and functions is reported in Appendix A.
Each of the 460 responding cities, villages and townships reported which services are provided to their residents and, if provided, the mode of service provision used. Appendix B lists each service/function and reports the number of municipalities reporting each provision mode. For our analyses, we collapsed each local government’s responses for each service area into four variables indicating whether or not the service was: (1)
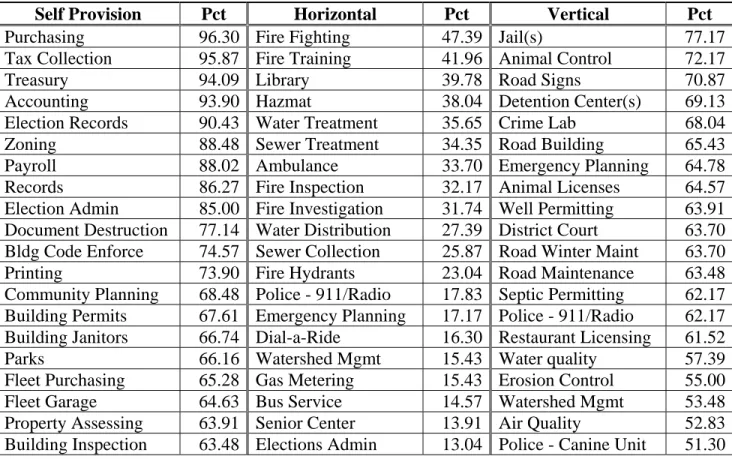
provided alone; (2) via horizontal relationships; (3) via vertical relationships; and (4) not provided.4 These indicator variables serve as the dependent variables in our analyses. Table 1 reports the 20 most frequent services/functions reported for each service provision mode.
Table 1 Here
Self-provision is reported most often for basic labor-intensive functions such as purchasing, tax collection, accounting, elections, payroll, and records, as well as zoning, planning, and building code enforcement/ inspection/ permits, as hypothesized.
Horizontal cooperation is reported most frequently for fire, library, utilities (water and sewer), emergency, and public transportation services. Consistent with our hypothesis, these are capital-intensive services or functions for which significant scale economies are likely to be present. Vertical cooperation is reported most frequently on criminal
justice/courts, roads, animal control, emergency, environmental, and building regulation services. Some of these services, especially criminal justice/courts and road, reflect legislative or constitutional provisions that require high degrees of county involvement.5 Other services, such as crime lab, emergency planning and environmental services, require relatively high levels of technical expertise or training.
Two additional patterns emerge from table 1. First, very little overlap exists between these three lists of services. Only four services appear on two top-twenty lists, and none appear on all three. This suggests that different economic logics derive from each type of service, and these logics in part dictate decisions to engage in direct provision, horizontal cooperation, and vertical cooperation. Second, comparing the two forms of cooperation, there are only a few services where horizontal collaboration occurs
frequently, whereas vertical cooperation is reported both at much higher rates and in many more service areas. Indeed, horizontal cooperation is reported by more than 20 percent of responding units in just 12 of the 116 service areas. In contrast, vertical cooperation is reported by more than 20 percent of responding units in 42 service areas.
Analyses and Results
To test our hypotheses, we merged a suite of additional variables into this service
provision dataset. The additional variables include several indicators of community-level fiscal, demographic, and political factors, as well as regional characteristics such as the number of potential collaborators in the immediate area. We conduct separate analyses for the three modes of service provision examined.
Examining our fiscal capacity hypotheses requires that we control for important differences in the institutional structure of municipal governments in Michigan. In
general, cities have a greater ability to fund the services demanded by their residents than villages or townships because these governments are allowed, by state law and/or city charter, to levy higher property taxes than townships and villages, and to collect additional revenues not available to these other governments. To account for these differences, each model includes a dichotomous variable indicating if the municipal government is a city. Also, Michigan law permits township governments to adopt charter township status, which substantially enhances the fiscal resources available to them. Given the authority to raise additional funds, charter townships may act more like cities than general law townships in their decisions about service delivery arrangements. We
account for this possibility by including a dichotomous variable in the full models indicating if the unit is a charter township.
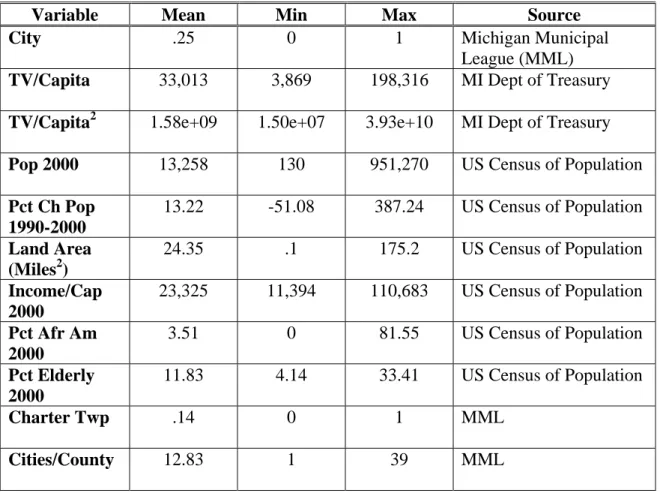
For each service provision mode, we report findings from two sets of logistic regression models. The first set of models focus on the subset of three independent variables that operationalize our fiscal capacity hypotheses: a dichotomous variable indicating if the unit is a city (scored one for cities and zero for villages or townships), and the size of the unit’s tax base (measured as taxable value per capita and taxable value per capita, squared) available to support public services6. The second set of regression models adds several independent variables to fully operationalize our theoretical model and to test hypotheses about factors beyond fiscal capacity. Table 2 presents descriptive statistics and data sources for each of the independent variables. Having identified where fiscal capacity is strong in the first set of regressions, we limit these additional regression to those initial regressions where the fiscal capacity effects are strongest. These
additional regressions therefore permit us to evaluate the impact of the additional factors while at the same time assessing the robustness of our fiscal capacity hypothesis.
Table 2 Here
Direct Provision
We begin by examining the factors explaining self-provision of government services. We propose that: (1) local governments with high levels of fiscal capacity are likely to self-provide government services; and (2) more populous local governments and (3) those with larger nonwhite and older populations are more likely to directly provide services. We first report limited logistic regressions for the twenty services for which local
governments most frequently reported self-provision. We then estimate the more fully specified models on a subset of ten services.
Table 3 reports the logistic regression estimates for the models of direct provision of services. The dependent variable in each model is whether or not a given community reports directly providing the service in question. We use logistic regression because the dependent variable is dichotomous. Each row corresponds to the results of a separate logistic regression. The first results column reports the estimated coefficient for the variable measuring the type of municipal government. Positive coefficients indicate that cities are more likely than the other types of local governments (villages and townships) to self-provide the particular service. The findings show that cities are, indeed, more likely than townships and villages to directly provide all but three of the twenty services, reflecting the fact that city governments face demands for more services and are
empowered with greater authority to raise funds to support direct service provision than are the other types of municipal governments. Given access to greater resources, cities tend to do more than other types of local governments.
The coefficients reported in the second column of table 3 reveal the relationship between the unit’s TV/Capita and the likelihood of direct provision of the service. Positive coefficients indicate that the likelihood of direct provision is higher in
communities with greater per capita property wealth. The findings show that when local fiscal capacity is measured in terms of TV/Capita, no consistent relationship with direct provision is seen for these twenty services. This suggests that for this set of basic
government services, differences in property wealth across jurisdictions are not important considerations in their decision to self-provide.
The third variable in the models shown in table 3 is the unit’s population in 2000. As we hypothesized, more populous municipal governments are more likely to directly provide all but two of the listed services, and the effect is significant for 55 percent (11 of 20) of the services. It is also interesting to note that the estimated effects tend to become more consistently significant as the proportion of local governments self-providing the service falls (i.e., as one moves down the list). We suspect that this is simply an artifact of the data. Given the high proportions of governments reporting self-provision of the first several services on the list, there is little variance to be explained by the variables in the model.
Table 3 Here
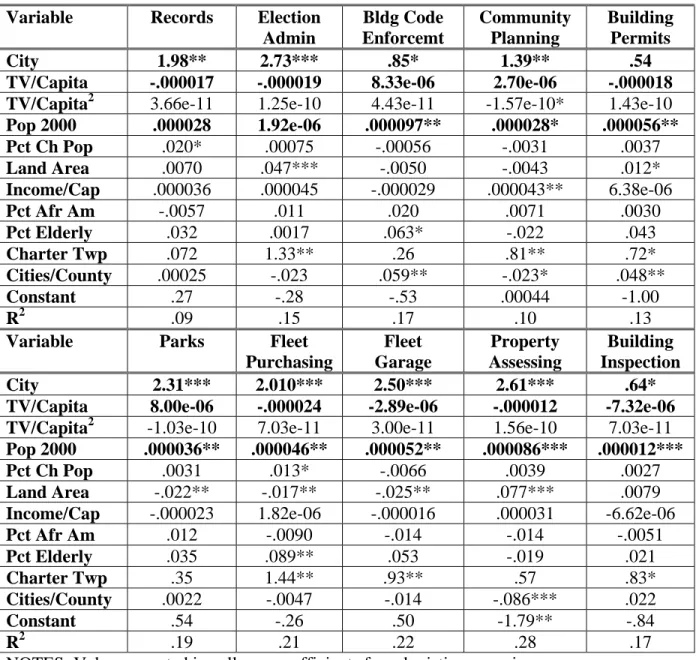
To assess the robustness of these preliminary results, and to test our additional hypotheses, we estimate more fully specified models for ten of these services. To account for the high proportion of governments reporting self-provision for several of the services in table 3, we estimate the fully specified models for the ten services from table 1 with the lowest rates of self-provision (items 11-20 on the list). The services examined are record keeping, election administration, building code enforcement, community planning, building permits, parks, fleet purchasing, fleet garage, property assessing, and building inspection.
Table 4 reports the findings from these ten logistic regressions. Bold-faced entries highlight the preliminary hypotheses explored in table 2. As hypothesized, cities and charter townships are more likely than general law townships and villages to self-provide all of the ten services, as evidenced by the positive and often statistically significant estimates on the city and charter township variables. The findings also reveal that size
affects the direct provision choice in two different ways. First, more populous units are more likely to self-provide each service, and this effect is statistically significant for eight of the ten services. Second, the geographical scale of the unit is statistically related to reliance on direct provision in 60 percent (6 of 10) of the services. For three services (election administration, building permits, and property assessing) greater land area increases the likelihood of direct provision. For three others (parks, fleet purchasing, and fleet garage) more land area decreases the likelihood that municipal government directly provides the service. None of the other variables show consistent patterns across the ten services.
Table 4 Here
Horizontal Cooperation
Next, we examine our hypotheses about the effect of local fiscal capacity, internal
characteristics, and external factors on horizontal cooperation. We propose that: (1) cities will be more likely to engage in higher levels of horizontal cooperation; (2) communities in the mid range of fiscal capacity (TV/Capita) will be more likely to engage in
horizontal cooperation, but (3) those at the highest levels of fiscal capacity (TV/Capita2) will be less constrained and therefore less likely to cooperate in providing municipal services; and (4) larger numbers of potential local government partners will increase the likelihood of horizontal cooperation.
Table 5 reports our analysis of the relationship between fiscal capacity and horizontal cooperation for the 20 service areas where the highest levels of horizontal cooperation were reported in table 1. The dependent variable in each model is whether a
given community reports any incidence of horizontal cooperation for the service in question.7 The first column of results reports the estimated coefficient for the variable measuring the type of municipal government. The findings are largely consistent with our expectations about municipal structure. The city dummy variable is positive for 70
percent (14 of 20) of the services examined, and is positive and statistically significant in 60 percent (12 of 20) of them.8 However, these findings reveal that municipal structure affects the likelihood of cooperation on fire services differently than for other services. Only six services display a negative sign for the structure variable, and all are services related to fire protection and EMS. Four of the models have structure coefficients that are negative and statistically significant, indicating that townships and villages are more likely to engage in horizontal cooperation on fire fighting, fire inspection, fire hydrant maintenance, and EMS than are cities. We note that this finding is independent of the level of property wealth in the jurisdiction (since we control for TV/Capita). Townships and villages are more likely to cooperate horizontally on these fire services than are cities, regardless of the per capita tax base in the community.
Table 5 Here
The coefficients reported in the second column of table 5 reveal the relationship between the unit’s TV/Capita and the likelihood of horizontal cooperation. For many of the services examined, the coefficients indicate that horizontal cooperation is more likely in communities with greater fiscal capacity. The coefficient for this variable is positive in 70 percent (14 of 20) of the services examined, and is positive and significant in 50 percent (10 of 20) of them.9 Most of the services that are positive and significant are capital-intensive to varying degrees, and include water and sewer utilities, transit, and
library services. Once again, the relationship between fiscal capacity and horizontal cooperation is different for fire services. Five of the six fire services examined have negative coefficients for TV/Capita, although none is statistically significant.
The third results column reports the estimated coefficient for the third measure of local fiscal capacity, TV/Capita2. The findings largely confirm our expectations about the behavior of high capacity jurisdictions. The coefficient shows a negative relationship in 75 percent (15 of 20) of the services, and is negative and significant in 45 percent (9 of 20) of them.10 Municipal governments with the greatest fiscal capacity, as measured by the value of their property tax base, are less likely to engage in horizontal cooperation. Again, the major exception to this conclusion is for the group of fire services. One explanation for this finding is that the nature of fire protection services as a basic service may mean that communities feel compelled to provide fire protection and will enter into cooperative ventures with neighbors regardless of their fiscal capacity.
To assess the robustness of these preliminary results, and to test our additional hypotheses, we estimate more fully specified models for the ten capital-intensive services with the highest levels of horizontal cooperation, excluding services related to fire
fighting and fire protection. The services examined are library, water treatment, sewer treatment, water distribution, sewer collection, emergency dispatch, dial-a-ride service, gas metering, bus service, and senior center. Table 6 reports the results of these ten logistic regression analyses.
Table 6 Here
The effects of government type and property wealth on horizontal cooperation are robust to the inclusion of our other independent variables. In no case does the relationship
of the three fiscal capacity measures with horizontal cooperation change when the additional variables are included. In several service areas, one or more of the measures become statistically insignificant, but many significant effects remain in the full models. As expected, the charter township variable is positive in eight of the equations and strongly significant in seven. This indicates that charter townships are more likely than general law townships and villages to engage in horizontal cooperation on these services. Given that the full model also includes a measure of the unit’s population, this finding is independent of the population of the township. This finding strongly supports our propositions about fiscal capacity and horizontal cooperation. The enhanced resources available to charter townships appear to make these governments more attractive partners in horizontal collaborations.
The findings provide little evidence that greater numbers of potential collaborators stimulate horizontal cooperation. In fact, the limited evidence for a relationship points in the other direction: horizontal cooperation is less likely in highly fragmented areas. The number of cities in a unit’s county is negatively related to the likelihood of horizontal cooperation, with negative signs in all but two service areas, but significant effects in only three. This may indicate that scale economies are more easily reached within a single local government jurisdiction in densely populated regions. It also may reflect the intensity of competition for tax base created when many small cities are incorporated in close proximity to one another. Krueger (2005) argues that the best candidates for joint service provision are often the same governments that a local unit most directly competes with for residents and economic development. None of the
coefficients for population size, population change, land area, or population
characteristics show consistently signed or significant effects across the ten service areas.
Vertical Cooperation
Finally, we test our hypotheses about the factors explaining vertical cooperation between municipal governments and county and/or state governments. We propose that: (1) townships and villages are more likely to partner with county or state government to provide services; (2) local governments with lower fiscal capacity are more likely to engage in vertical cooperation; and (3) communities at the highest levels of taxable value are less likely to need to cooperate on service provision with the county or state
governments. The dependent variable in all of the analyses is whether a given community reports any incidence of vertical cooperation on the service in question.
Table 7 reports our analysis of the relationship between fiscal capacity and vertical cooperation for the 20 service areas in table 1 with the highest levels of vertical cooperation, with several important exceptions. It is reasonable to believe that the high rates of vertical cooperation on road construction and maintenance and the operation of district courts are due to legislative and constitutional requirements for county
involvement and not necessarily the choices of local decision-makers to work
cooperatively with counties. We therefore exclude the six services from these two areas from the analyses that follow.11 The next six most frequently reported areas of vertical cooperation shown in table 1 - detective/crime investigation units, curbside mowing, police officer training, environmental education, hazardous material handling, and police street patrols - replace the excluded services. As with the analysis of the first two service
provision modes, we begin our analysis of vertical cooperation with a series of limited models that focus on our fiscal capacity hypotheses. We later add the same set of additional variables used in the previous analyses of direct provision and horizontal cooperation to test our other hypotheses on this subset of services.
Table 7 Here
Table 7 shows that cities are less likely than townships or villages to engage in vertical cooperation for 85 percent (17 of 20) of the services, and are significantly less likely for 70 percent (14 of 20) of them. This finding is consistent with our predictions for the effect of municipal structure on the likelihood of vertical cooperation. However, property wealth is a much less important determinant of vertical cooperation, as indicated by the statistically insignificant effect of TV/Capita in 75 percent (15 of 20) of the
services examined. Indeed, in the few instances where the coefficient on TV/Capita is significant, it is positive in four cases and negative in only one. Similarly, TV/Capita2 is significant only once, indicating little evidence of a drop-off in vertical cooperation for communities with the greatest fiscal capacity. Together, these findings suggest that local fiscal capacity, when measured in terms of property wealth, is not an important factor in local units’ decisions to cooperate with the county or the state to provide services. Instead, it is the legal and constitutional capacity of the local government to generate the resources to pay for public services that is central to this decision. The limited fiscal capacity of township and village governments created by their limited tax authority is strongly related to the decision to cooperate with the county or state governments on this set of services.12
Table 8 reports the findings from our more fully specified models. We proposed that vertical cooperation is strongly motivated by the ability of counties and the state government to serve as providers of services that require technical training or expertise. To test this hypothesis, we limit the analysis to the ten services from table 7 that demand high levels of technical training or expertise, and therefore present the greatest
opportunities for exploiting “economies of skill.” Beginning with the two measures of municipal fiscal authority, the findings show that cities are more likely than general law townships and villages to undertake vertical cooperation on half of the services and are less likely on the other half. More consistently, charter townships are more likely to cooperate vertically on each and every service area, and are significantly more likely to report vertical cooperation on six of the policies. Charter townships tend to be more fiscally constrained than cities because they have fewer mills available to levy, but often have service demands on par with cities. They may need to seek out opportunities to cooperate on these technical services to greater degrees than cities.
Table 8 Here
The other major fiscal capacity variable – TV/Capita – is consistently positive, but rarely statistically significant. This finding confirms and extends the major conclusion of the reduced model. Fiscal capacity in terms of per capita taxable value is not
instrumental to the decisions to cooperate on service provision with the county or state governments for this set of services, even when jurisdictional differences in population, land area, and demographic characteristics are considered. These latter factors are also largely unimportant to this decision in most communities, as indicated by the general lack of statistically significant coefficients for these factors in the ten models. We had
proposed that local governments with lower fiscal capacity, whether measured in terms of tax base or municipal powers, are more likely to engage in vertical cooperation.
However, these findings provide little support for our contention about the effect of TV/Capita on vertical cooperation for this set of services. It is not the ability of the community to afford service provision that determines whether local governments cooperate vertically to provide these services, but rather whether they possess the fiscal authority to raise the funds necessary to support the service.
Finally, the findings in table 8 show that the number of cities per county is negative in all ten models and statistically significant in six, indicating that units in counties with many municipal governments are less likely to engage in vertical cooperation. This finding follows the negative relationship found for this factor in the models of horizontal cooperation and provides an even stronger case for the cooperation-depressing effects of municipal fragmentation. Fewer municipal governments in an area often translate into greater interlocal cooperation, whether the potential partners are other cities, villages, townships, the county, or state government. An unexpected finding is that the negative effect of other municipal governments on cooperation is stronger for vertical than for horizontal relationships.
Discussion and Implications of Analysis
Analysis of the Citizen’s Research Council of Michigan’s survey of local government services shows clear patterns in the methods used to deliver local government services. The direct provision of services is the method used most frequently, especially for labor-intensive services and functions basic to local government such as purchasing, tax
collection, accounting, elections, payroll, and records, as well as zoning, planning, and building code enforcement/inspection/permits, as hypothesized. A governmental unit’s fiscal capacity does little to predict whether services will be directly provided. As the population within a local jurisdiction increases, the number of services provided expands, and the new services tend to remain self-provided. Cities and charter townships, which tend to act more like cities than general law townships in the methods used to provide services, tend to provide more services, and thus self-provide services to greater degrees than general law townships or villages.
At some point in the expansion of services, local governments are confronted with demands for capital-intensive services and services that require professionals with
technical expertise or training that impose significant costs on the provider. Our analysis shows that the nature of the services plays an important role in local governments’ decisions to look among their neighbors for partners (horizontal cooperation) or seek to benefit from the capacity of the state or county governments (vertical cooperation).
Horizontal cooperation occurs most frequently for the provision of services that require significant capital investment. Fire prevention, libraries, water and sewer, public transit, and senior centers all require investment for the construction of buildings and infrastructure or the purchase of vehicles and equipment. These costs can often act as significant deterrents for local governments to engage in the activity alone, but economies can be gained by cooperating with other units confronting the same costs.
Vertical cooperation occurs more often for the provision of services that require significant labor investment in professionals with technical expertise or training.
environmental initiatives. The costs of employing those individuals that warrant higher pay scales due to their levels of expertise or training can act as deterrents for local governments to provide those services individually, but economies can be gained by cooperating or piggybacking on the employment of those individuals at higher levels of government. A decision to join with other relatively small and lightly populated local governments does not create the economies needed to fund some services and functions; it is by engaging in vertical cooperation that these services and functions can often be provided.
Policy Implications
These differences suggest a strategy for local officials hoping to benefit from intergovernmental cooperation and for state policymakers hoping to promote collaboration among local governments. The patterns of cooperation we observe – including the types of local governments who engage in collaborative service provision, the partners they choose, the forms of cooperation they undertake, and the kinds of joint services they deliver – are largely consistent with the logic of cooperation laid out in our theory and hypotheses. While our analysis does not contain explicit cost data that would allow us to determine whether these arrangements are enhancing economic efficiency, the fact that a great many Michigan local governments are behaving as the theory suggests indicates, to us at least, that these forms of cooperation make sense to decision-makers on the ground. By learning from and building upon the experiences of local governments across the state, and by working to promote similar forms of cooperation in other
localities, we believe that state and local policymakers stand the greatest chances of success in promoting viable cooperation.
Local Actions
A necessary first step for local government officials hoping to promote intergovernmental cooperation is to examine the nature of the services considered for collaboration. Services should be classified according to whether they are primarily capital-intensive, labor-intensive, and technically-intensive. Within broad service provision categories, individual functions should also be examined to consider whether opportunities for cooperation exist for a subset of services within a broad category. For example, police protection tends to be fairly labor-intensive and hence not especially conducive to collaboration, but more specific functions such as detective work and crime scene investigation tend to be technically-intensive and detention facilities are capital-intensive. While joint provision of police protection might not create significant opportunities for cooperation, creation of joint crime scene units or detention facilities may offer greater saving opportunities. County governments should also assess the services they provide to identify opportunities for new or expanded vertical collaborations.
A second step is to identify potential partners for collaboration. By understanding that capital-intensive services are especially sensitive to geographic characteristics, local government officials can begin by building horizontal relationships with neighboring communities. Similarly, by understanding that technically intensive services are not geographically based but can be provided on an as-needed basis across counties and local units, efforts to collaborate can begin by investigating state and county governments’
ability to provide those services on behalf of local governments through vertical cooperation.
Identification of a suitable partner for horizontal and vertical cooperation requires consideration of different factors. We find that cities and charter townships are more likely than general law townships or villages to engage in horizontal cooperation. As hypothesized, the likelihood of horizontal cooperation increases in communities with greater fiscal capacity; but local governments with the greatest fiscal capacity are less likely to engage in horizontal cooperation. These findings suggest that communities with mid-range fiscal capacity should seek out neighbors in similar fiscal circumstances for cooperative ventures. Notwithstanding the cooperative ventures that currently exist among local governments – especially in fire protection and library services – those governmental units with severely limited fiscal capacity are unlikely to find promising opportunities for horizontal cooperation, since neither they nor their resource-poor neighbors are able to provide capital-intensive services, either individually or jointly.
Our analysis of trends in vertical cooperation shows that a local government’s fiscal conditions are not the driving factor behind their decisions to engage in vertical cooperation with their county or the state. Property-rich communities are just as likely as poor or mid-range communities to use vertical cooperation.
These findings suggest that opportunities exist for expansion of vertical cooperation between counties and their constituent cities, villages, and townships, regardless of the fiscal capacity of those local governments. Officials representing local governments of all size and fiscal capacity should consider their county governments as potential service providers, either by piggybacking on existing county services or through
interlocal contracts to have the county provide functions and services that are currently self-provided.
A third step is for local governments to acknowledge that horizontal collaboration represents mutual exchange relationships between local units who seek to jointly provide services that neither unit would or could individually provide as efficiently. Each
participant expects the other(s) to contribute their “fair share” to the financing of the governmental service, and in return, both are made better off through cost savings and perhaps improved service provision. To achieve these benefits, a successful cooperative relationship requires participants to put aside their instincts towards competition for tax base in the mutual interest of improved, more economical service provision.
Competition for tax base is less salient as local governments seek partners for vertical collaboration. Because city and township residents are simultaneously state and county residents, vertical collaboration may be in the interest of all participating units. Indeed, by acting to improve the service provision capabilities of a county’s weakest units, county officials can make the county as a whole a more attractive place to live or locate a business.
State Policies
State programs can be designed to promote greater horizontal and vertical collaboration. The state should not attempt to mold a uniform policy to promote cooperation – such programs should recognize the underlying differences in logic and motivations behind vertical and horizontal cooperation.
State policies designed to promote and facilitate horizontal cooperation should emphasize the capital-intensive nature of the services best suited for horizontal
cooperation and the need for local government officials to find near-by municipalities interested in cooperating. Our analysis finds that local governments most often engage in horizontal cooperation to provide capital-intensive services. Once the capital-intensive good is purchased, acquired or constructed, the marginal cost of providing services to additional residents, such as those in a neighboring community, are relatively small.
Given the benefits of horizontal cooperation in the provision of capital-intensive services, the state can best promote cooperation by reducing the cost of capital items for those local governments cooperating in the provision of services. One method for accomplishing this would be for the state to create a loan fund or sinking fund from which cooperating local governments could borrow or bond to acquire, purchase, or construct the capital-intensive items at lower cost than if they were to do so on their own.
The second part of the state’s efforts to facilitate horizontal cooperation should concentrate on the helping local governments identify and create agreements with willing partners. The state could provide consultation to those local officials seeking to initiate cooperative ventures; collect and disseminate information about research and best practices on intergovernmental cooperation; offer arbitration and/or training to local government officials; advocate for additional resources to local governments within and outside state government; administer grant and incentive programs; and maintain a moderated website where local governments can identify potential service sharing partners and learn from others’ experiences. The state government can work to remove barriers to cooperation by helping with the cost of negotiating, planning, and
reporting for local governments so that such negotiations and planning begin with all parties in agreement about the finances of such a cooperative venture.
State policies to promote vertical cooperation should recognize that cities, villages, and townships of all sizes and fiscal capacity can benefit by working with the state or their county governments to provide services. The potential role of the state in providing incentives for vertical cooperation is far different than the potential role for horizontal cooperation. The state need not help with the process of identifying potential partners, since information about the services that state and county governments can provide is more readily accessible to local governments. Also, because the state and counties are already actively engaged in the provision of services to local units,
contracting may be more routinized and negotiation over vertical cooperation tends to be limited to the level of services and the cost. Unlike horizontal cooperation, there is little need for the state to provide resources to help with planning, negotiating or
implementation of cooperative agreements. And there is little need for the state to help with the cost of acquiring, purchasing, or constructing items as is the case for horizontal cooperation.
Instead, the state could provide financial incentives for local governments to work with the state or their county governments for the provision of services. Incentives could be directed to the cities, villages, and townships to motivate contracting with their county governments for the provision of specific services, or to the counties to defray the cost of providing specific services, and thus reducing their costs below what most municipalities would pay to self-provide the same services. Vertical relationships could also be created
through legislative reassignment of technically intensive services from the local to county levels.
Conclusions
Intergovernmental cooperation is increasingly seen as a tool for local governments to deal with the operational and fiscal pressures created by Michigan’s continued economic troubles and by state actions to fund its services using dollars that would otherwise be passed on to local governments through state revenue sharing. The analyses in this chapter provide policymakers with insights regarding what sorts of intergovernmental cooperation can and should be facilitated through legislation and policy, and offer
guidance to practitioners for assessing the potential for cooperation in their communities. We believe our examination of horizontal and vertical cooperation and direct provision will provide analysts with tools for better understanding and evaluating the incidence of intergovernmental cooperation in Michigan and elsewhere.
Notes
1
A fifth option is contracting for the service with a nongovernmental provider. The decision to use a private or nonprofit provider is beyond the scope of the current analysis. 2The surveys were mailed in winter 2005 to every city, village, and township government in 25 Michigan counties. These 646 units of government represent 36 percent of the 1,776 general-purpose local governments in Michigan and contain 78 percent of the state’s population. Responses were received from 460 of the 646 governments surveyed, for a response rate of 71 percent. Response rates for each type of government were: 71 percent for cities (113 of 160); 70 percent for villages (58 of 83); and 72 percent for townships (289 of 403). For additional information, see
www.crcmich.org/PUBLICAT/2000s/2005/catalog.html.
3
For each service, respondents were provided twelve options and asked to choose the one that best described their unit’s service delivery arrangements. Respondent were asked to choose multiple responses only when necessary. Responses were then combined into four clusters for analysis, as described in the text. The survey response options were: (1) Does not provide or contract for this service-this service is not the responsibility of, and
therefore is not provided by, your city/village/township. (2) Directly provides this service-your unit is providing this service using municipal employees. (3) Also provides this service by contract to residents of another community-your city/village/township is providing this service, through some sort of contract or agreement, to another
community. This would usually be in addition to providing the service within your own city/village/township. (4) Jointly provides this service with another municipality-your city/village/township has entered into an agreement with a neighboring
city/village/township to cooperatively provide this service. (5) Jointly provides this service with a school district-your city/village/township has entered into an agreement with a school district to jointly provide this service. (6) Jointly provides this service with the county-your city/village/township has entered into an agreement with the county to jointly provide this service. (7) Has this service provided by the state-your
city/village/township contracts with the state to provide this service. (8) Has this service provided by the county-your county provides this service on a county-wide basis. (9) Has the service provided by another municipality-your city/village/township has some sort of agreement or contract with another city/village/township to have that unit deliver this service. (10) Has this service provided by a special authority or special district-your city/village/township has joined a special authority with other units of local government to provide this service. (11) Has this service provided by a private provider-your
city/village/township has hired, or contracted with, or has a franchise agreement with, a nongovernmental private firm -- for-profit or non-profit -- to provide this service. (12) Do not know how this service is provided-you are unaware if this service is being provided by another governmental entity, but your city/village/township is not currently providing this service.
4
This coding again ignores service delivery via nongovernmental providers as an option. We consider joint provision with, and service provision by, special authorities or districts as instances of horizontal cooperation.
5
When the Great Depression in the 1930s left many townships unable to fund road maintenance, the role of county road commissions was expanded to include care of township roads. Only one township has since returned to the role of caring for its own roads (see CRC 1997). Also, adoption of the 1963 Michigan Constitution mandated certain changes in the structure of the state judiciary. Specifically, Article VI, Section 26, required that the offices of circuit court commissioner and justice of the peace be
abolished and a court or courts of limited jurisdiction be created by the legislature. Public Act 154 of 1968 carried out that mandate and vested control of court districts with the legislature. These services were excluded from the analysis.
6
In our initial analyses of direct provision (table 2), we include population size rather than TV/Capita2.
7
If a community reports one or more forms of horizontal cooperation on a given service, it is coded “one” on the dependent variable. Given the structure of the data, when a community reports more than one instance of horizontal cooperation on a given service, we cannot differentiate between collaborations on a single service delivery with multiple partners, versus multiple distinct instances of service delivery with different partners. The measures used for vertical cooperation and direct provision is constructed in a similar manner.
8
Table 5 reports models estimated for the 20 service areas where the greatest incidence of horizontal cooperation was reported. We also estimated the same models for the
remaining 95 service areas where the incidence of horizontal cooperation was lower. In these additional models, the coefficient on City is positive and significant in only 28% (27 out of 95) of the service areas.
9
In the additional models estimated for services with horizontal cooperation (see Endnote 8), the TV/Capita coefficient is significant in only 12% (11 of 95) of the remaining services.
10
In the additional models (see Endnote 8), the TV/Capita2 coefficient and is negative and significant in just 2% (2 of 95) of the other services for which horizontal cooperation was reported.
11
References
Citizens Research Council of Michigan. [CRC] (1997). Michigan Highway Finance and Governance. CRC Report No. 321. May. Livonia, Michigan.
Citizens Research Council of Michigan. [CRC] 2005. Catalog of local government services. CRC Memorandum 1079. September. Livonia, Michigan.
Frederickson, H.G. (1999). The repositioning of American public administration. PS: Political Science & Politics, 32, 701-711.
Krueger, E. (2005). A Transaction Costs Explanation of Inter-Local Government Collaboration. Ph.D. Dissertation. University of North Texas.
Lackey, S., Freshwater, D., & Rupasingha, A. (2002). Factors influencing local government cooperation in rural areas: Evidence from the Tennessee Valley. Economic Development Quarterly, 16(2), 138-154.
LeRoux, K. (2006). The Role of Structure, Function, and Networks in Explaining Interlocal Services Delivery: A Study of Institutional Cooperation in Michigan. PhD. Dissertation. Wayne State University.
LeRoux, K., & Carr, J. (2007). Explaining Local Government Cooperation on Public Works: Evidence from Michigan. Public Works Management and Policy 12(1): 344-58.
Morgan, D., & Hirlinger, M. (1991). Intergovernmental service contracts: A multivariate explanation. Urban Affairs Quarterly, 27(1), 128-144.
Oakerson, R. (2004). The study of metropolitan governance. In R. Feiock (Ed.), Metropolitan governance: Conflict, competition, and cooperation, (pp. 17-45). Georgetown University Press: Washington, D.C.
Post, S. 2002. Cities and their Suburbs: “Go Along to Get Along.” Ph.D. Dissertation. Rice University.
Rawlings, L. (2003). The determinants of cooperation among local governments in metropolitan areas. PhD. Dissertation. George Washington University. Visser, J. (2004). Townships and Nested Governance: Spoilers or Collaborators in
Metropolitan Services Delivery. Public Performance & Management Review 27(3), 80-101.
Wood, C. (2004.) Metropolitan Governance in Urban America: A Study of the Kansas City Region. Ph.D. Dissertation. The University of Kansas.
Zeemering, E. (2007). Who Collaborates? Local Decisions about Intergovernmental Relations. Ph.D. Dissertation. Indiana University.
Table 1: Top Twenty Service Areas by Mode of Service Delivery
Self Provision Pct Horizontal Pct Vertical Pct
Purchasing 96.30 Fire Fighting 47.39 Jail(s) 77.17
Tax Collection 95.87 Fire Training 41.96 Animal Control 72.17
Treasury 94.09 Library 39.78 Road Signs 70.87
Accounting 93.90 Hazmat 38.04 Detention Center(s) 69.13
Election Records 90.43 Water Treatment 35.65 Crime Lab 68.04
Zoning 88.48 Sewer Treatment 34.35 Road Building 65.43
Payroll 88.02 Ambulance 33.70 Emergency Planning 64.78
Records 86.27 Fire Inspection 32.17 Animal Licenses 64.57
Election Admin 85.00 Fire Investigation 31.74 Well Permitting 63.91
Document Destruction 77.14 Water Distribution 27.39 District Court 63.70
Bldg Code Enforce 74.57 Sewer Collection 25.87 Road Winter Maint 63.70
Printing 73.90 Fire Hydrants 23.04 Road Maintenance 63.48
Community Planning 68.48 Police - 911/Radio 17.83 Septic Permitting 62.17
Building Permits 67.61 Emergency Planning 17.17 Police - 911/Radio 62.17
Building Janitors 66.74 Dial-a-Ride 16.30 Restaurant Licensing 61.52
Parks 66.16 Watershed Mgmt 15.43 Water quality 57.39
Fleet Purchasing 65.28 Gas Metering 15.43 Erosion Control 55.00
Fleet Garage 64.63 Bus Service 14.57 Watershed Mgmt 53.48
Property Assessing 63.91 Senior Center 13.91 Air Quality 52.83
Building Inspection 63.48 Elections Admin 13.04 Police - Canine Unit 51.30
NOTE: Pct indicates the percentage of 460 municipal governments (cities, villages, and township) reporting each mode of service delivery in 2005.
Table 2: Descriptive Statistics, Independent Variables
Variable Mean Min Max Source
City .25 0 1 Michigan Municipal League (MML)
TV/Capita 33,013 3,869 198,316 MI Dept of Treasury
TV/Capita2 1.58e+09 1.50e+07 3.93e+10 MI Dept of Treasury
Pop 2000 13,258 130 951,270 US Census of Population
Pct Ch Pop 1990-2000 13.22 -51.08 387.24 US Census of Population Land Area (Miles2) 24.35 .1 175.2 US Census of Population Income/Cap 2000 23,325 11,394 110,683 US Census of Population Pct Afr Am 2000 3.51 0 81.55 US Census of Population Pct Elderly 2000 11.83 4.14 33.41 US Census of Population Charter Twp .14 0 1 MML Cities/County 12.83 1 39 MML
Table 3: Local Fiscal Capacity and the Likelihood of Direct Provision of Services in 460 Michigan Local Governments
Service City TV/Capita Population 2000 Purchasing .86 7.20e-06 3.45e-06
Tax Collection -.33 .000041* .000019
Treasury 1.057* .000042** -5.39e-06
Accounting .46 -5.79e-07 .000026
Election Records .93* .000035** .000036
Zoning 1.28** .000031** .000097**
Payroll 1.25** -7.24e-06 5.13e-06
Records 1.72** 2.00e-06 .000039*
Election Admin 1.26** .000013 .000032*
Document Destruction .34 -6.66e-06 7.37e-06
Bldg Code Enforcement 1.41** 9.25e-06 .00011***
Printing .21 6.41e-06 9.14e-06
Community Planning 1.076** -8.32e-06* .000044**
Building Permits .53* 8.89e-06* .000085***
Building Janitors -.19 -3.63e-06 -3.28e-06
Parks 2.65*** -.000013** .000045**
Fleet Purchasing 2.15*** -5.37e-06 .000067***
Fleet Garage 2.83*** -1.56e-06 .000050**
Property Assessing -.21 8.26e-06 .000062***
Building Inspection .49* 5.51e-06 .00014*** NOTES: Values reported in cells are coefficients from logistic regression.
Table 4: Likelihood of Direct Provision of Services in 460 Michigan Local Governments – Full Model
Variable Records Election Admin Bldg Code Enforcemt Community Planning Building Permits City 1.98** 2.73*** .85* 1.39** .54 TV/Capita -.000017 -.000019 8.33e-06 2.70e-06 -.000018 TV/Capita2 3.66e-11 1.25e-10 4.43e-11 -1.57e-10* 1.43e-10
Pop 2000 .000028 1.92e-06 .000097** .000028* .000056** Pct Ch Pop .020* .00075 -.00056 -.0031 .0037 Land Area .0070 .047*** -.0050 -.0043 .012* Income/Cap .000036 .000045 -.000029 .000043** 6.38e-06 Pct Afr Am -.0057 .011 .020 .0071 .0030 Pct Elderly .032 .0017 .063* -.022 .043 Charter Twp .072 1.33** .26 .81** .72* Cities/County .00025 -.023 .059** -.023* .048** Constant .27 -.28 -.53 .00044 -1.00 R2 .09 .15 .17 .10 .13
Variable Parks Fleet Purchasing Fleet Garage Property Assessing Building Inspection City 2.31*** 2.010*** 2.50*** 2.61*** .64* TV/Capita 8.00e-06 -.000024 -2.89e-06 -.000012 -7.32e-06 TV/Capita2 -1.03e-10 7.03e-11 3.00e-11 1.56e-10 7.03e-11
Pop 2000 .000036** .000046** .000052** .000086*** .000012*** Pct Ch Pop .0031 .013* -.0066 .0039 .0027
Land Area -.022** -.017** -.025** .077*** .0079
Income/Cap -.000023 1.82e-06 -.000016 .000031 -6.62e-06
Pct Afr Am .012 -.0090 -.014 -.014 -.0051 Pct Elderly .035 .089** .053 -.019 .021 Charter Twp .35 1.44** .93** .57 .83* Cities/County .0022 -.0047 -.014 -.086*** .022 Constant .54 -.26 .50 -1.79** -.84 R2 .19 .21 .22 .28 .17
NOTES: Values reported in cells are coefficients from logistic regression. ***p < .01; **p < .05; *p < .10