University of Arkansas, Fayetteville
ScholarWorks@UARK
Theses and Dissertations12-2016
Quantitative Trait Loci (QTL) for Salt Tolerance in
Soybean and Physiological Response to Salt Stress
During Early Growth Stage
Cindy Massiel Lopez Ramirez
University of Arkansas, Fayetteville
Follow this and additional works at:http://scholarworks.uark.edu/etd
Part of theAgronomy and Crop Sciences Commons,Horticulture Commons, and thePlant Biology Commons
This Thesis is brought to you for free and open access by ScholarWorks@UARK. It has been accepted for inclusion in Theses and Dissertations by an authorized administrator of ScholarWorks@UARK. For more information, please contactscholar@uark.edu, ccmiddle@uark.edu.
Recommended Citation
Lopez Ramirez, Cindy Massiel, "Quantitative Trait Loci (QTL) for Salt Tolerance in Soybean and Physiological Response to Salt Stress During Early Growth Stage" (2016).Theses and Dissertations. 1768.
Quantitative Trait Loci (QTL) for Salt Tolerance in Soybean and Physiological Response to Salt Stress During Early Growth Stage
A thesis submitted in partial fulfillment of the requirements for the degree of
Master of Science in Crop, Soil, and Environmental Sciences
by
Cindy Massiel Lopez Ramirez Universidad Nacional de Colombia
Bachelor of Science in Agronomic Engineering, 2011
December 2016 University of Arkansas
This thesis is approved for recommendation to the Graduate Council.
Dr. Pengyin Chen Thesis Director
Dr. Ken L. Korth Dr. Esten Mason Committee Member Committee Member
Dr. David Miller Committee Member
OVERALL ABSTRACT
Soybean is a major cash crop used as a source of high–quality protein and oil. Salt stress is one of the main abiotic stresses causing significant yield losses in soybean, which is considered a moderately salt–sensitive crop. Breeding selection is a promising strategy to improve salt tolerance as soybean germplasm display wide variation in response to salinity stress. However, the physiological and genetic mechanisms for salt tolerance are not quite clear. The discovery of novel QTL/genes associated with salt tolerance facilitates the development of tolerant cultivars through marker-assisted selection (MAS). The objectives of this study were: 1) identify/confirm QTL associated with salt tolerance, and 2) evaluate progressive shoot ion accumulation in sensitive/tolerant genotypes and leaf physiological changes induced by salt stress during early
growth stage. For the first objective, QTL mapping was performed using an F2:3 population from
Jake (tolerant) x Ozark (sensitive). A major QTL was found on chromosome 3 linked to four SNP loci in the same genomic region previously reported, explaining 37% to 49% of the phenotypic variation in LSS, PDP, leaf chlorophyll and leaf chloride content. Additionally, a new minor QTL linked with two SNP markers was identified on chromosome 19 explaining 5% of leaf chlorophyll variation. These QTL and linked SNP markers will be useful in MAS for salt tolerance. For the second objective, two sensitive (Desha, Ozark) and two tolerant (Jake, Lee) cultivars were treated with NaCl and KCl at 80 mM and 120 mM from stage V1 to V5. The most adverse effects on tolerant and susceptible varieties, was caused by KCl compared to NaCl stress. Under KCl treatment, the tolerance capacity of the excluders was severely inhibited causing early death, while under NaCl stress, tolerant varieties were able to accumulate up to 2.3
occurred when shoot ion concentration reached 80,000 mg/kg and 18,000 mg/kg of Cl- and Na+,
respectively, under 120 mM NaCl. Under 120 mM KCl, plants died when leaf Cl- content
AKNOWLEDGEMENTS
I would like to express my deepest gratitude to my family and friends in Colombia and here, in Fayetteville, for the continuous support and encouragement provided during all my master’s study.
I would like to thank my academic advisor Dr. Pengyin Chen for giving me the opportunity to join his soybean breeding program, for his guidance, encouragement, and for teaching me many valuable aspects about the art and science of plant breeding.
I want to give special thanks to all my committee members Dr. Mason, Dr. Korth and Dr. Miller for their time, guidance, and effort dedicated to contribute on this thesis project. In addition, I want to thank Dr. Mason and Dr. Korth for the knowledge and professional input provided during their interesting and very useful classes of Plant Breeding and Biotechnology in Agriculture.
I am deeply grateful to Dr. Gbur and Dr. Shi for their instructions and advice during all my academic program; to Dev Crippen, Jonh Guerber and Jessica Kivett for their help with the greenhouse research.
I am sincerely grateful to all the past and current members of the soybean breeding team
(Razorbeans), for their understanding, advice, support and great team effort dedicated during all the time we have shared. Special thanks to my dear friends Mirta Dalzotto, Laura Lara, Liliana Florez, Maria de Oliveira, and Ali Alsalman.
Finally, I would like to thank all the staff of the Crop, Soil, and Environmental Sciences Department for their kindness and generous help throughout the time I have been part of this academic community.
DEDICATION
To God and my beloved family, who have always motivated me, supported me, and inspired me
TABLE OF CONTENTS
Chapter I. Introduction and literature review
Soybean production and uses ...1
Salinity and its effects on soybean ...2
Mechanisms for salt tolerance in plants ...4
Maintenance of ion homeostasis ...5
Osmotic adjustment by osmoprotectants ...5
Restoration of oxidative balance ...5
Structural adaptations ...6
Effect of salt stress in soybean growth and development ...6
Salt tolerance screening in soybean ...10
Genetics of salt tolerance in soybean ...11
Marker assisted selection (MAS) and quantitative trait loci (QTL) mapping for salt tolerance in soybean ...12
References ...18
Chapter II. Identification of Quantitative Trait Loci in Soybean for Salt Tolerance Abstract ...23
Introduction ...25
Materials and Methods ...27
Parental material and population development ...27
Phenotyping: Salt tolerance screening. ...28
Genotyping: DNA extraction and marker screening ...29
Results.. ...31 Phenotypic data ...31 Genotypic data. ...33 Discussion ...34 Conclusions. ...37 References. ...39
Chapter III. Study of soybean physiological response under salt stress during early growth stages Abstract ...56
Introduction ...57
Materials and Methods ...58
Plant material and growth conditions ...58
Measurements. ...59
Leaf scorch score (LSS) ...59
Chloride (Cl–), Potassium (K+), and Sodium (Na+) content. ...59
Leaf chlorophyll ...60
Leaf area and leaf dry weight. ...60
Experimental design and statistical data analysis. ...61
Results.. ...61
Leaf chloride content ...62
Leaf sodium content. ...63
Leaf potassium content ...64
Leaf scorch score ...65
Leaf area...67
Leaf dry weight ...68
Discussion. ...69
Conclusions. ...73
References. ...75
LIST OF TABLES
Chapter I
Table 1. Texture and chemical properties of the sandy loam soil used for the salt tolerance
screening in the greenhouse ...17 Table 2. Summary of molecular markers reportedly associated with soybean salt tolerance ...17
Chapter II
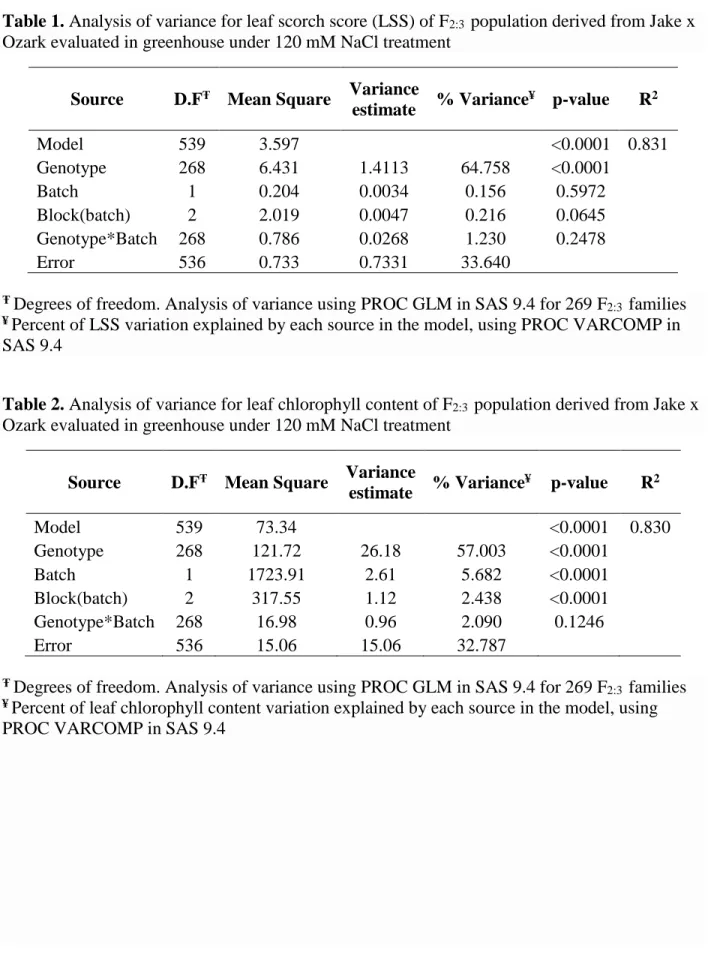
Table 1. Analysis of variance for leaf scorch score (LSS) of F2:3 population derived from Jake x
Ozark evaluated in greenhouse under 120 mM NaCl treatment ...41 Table 2. Analysis of variance for leaf chlorophyll content of F2:3 population derived from Jake x
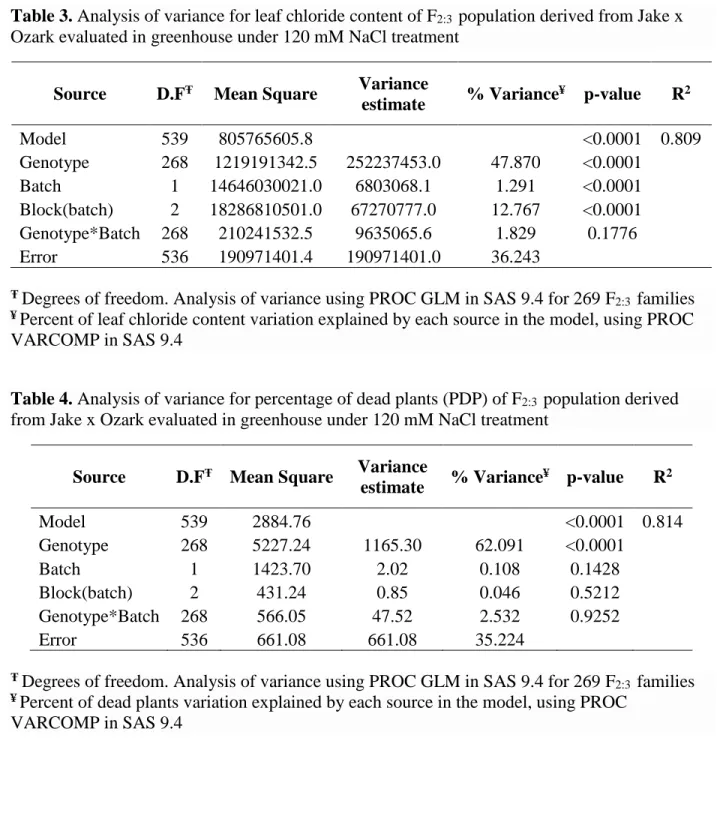
Ozark evaluated in greenhouse under 120 mM NaCl treatment ...41 Table 3. Analysis of variance for leaf chloride content of F2:3 population derived from Jake x
Ozark evaluated in greenhouse under 120 mM NaCl treatment ...42 Table 4. Analysis of variance for percentage of dead plants (PDP) of F2:3 population derived
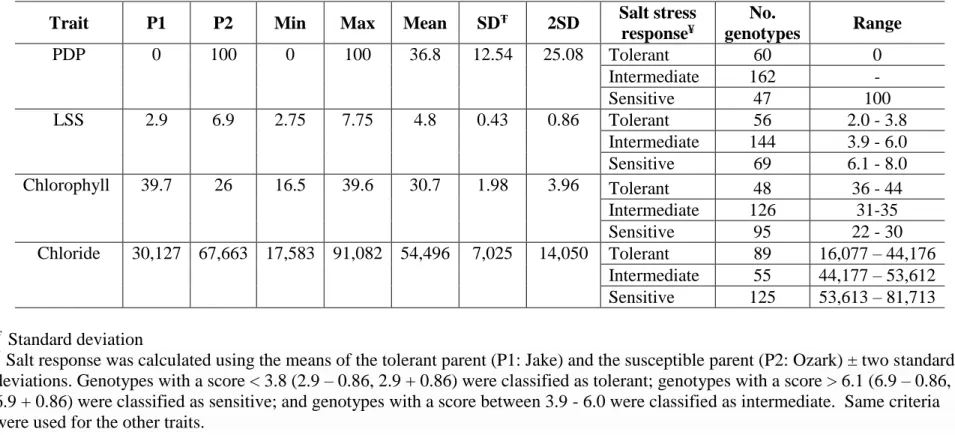
from Jake x Ozark evaluated in greenhouse under 120 mM NaCl treatment ...42 Table 5. Descriptive statistics for the traits evaluated in 269 genotypes from the F2:3 population
(Ozark x Jake) under greenhouse conditions. ...43 Table 6. Single Nucleotide Polymorphic (SNP) markers used in the screening of the F2:3
mapping population (Jake x Ozark) ...44 Table 7. Single Marker Analysis summary for LSS, percentage of dead plants (PDP), leaf
chlorophyll content, and leaf chloride concentration in 269 F2:3 derived families from the cross
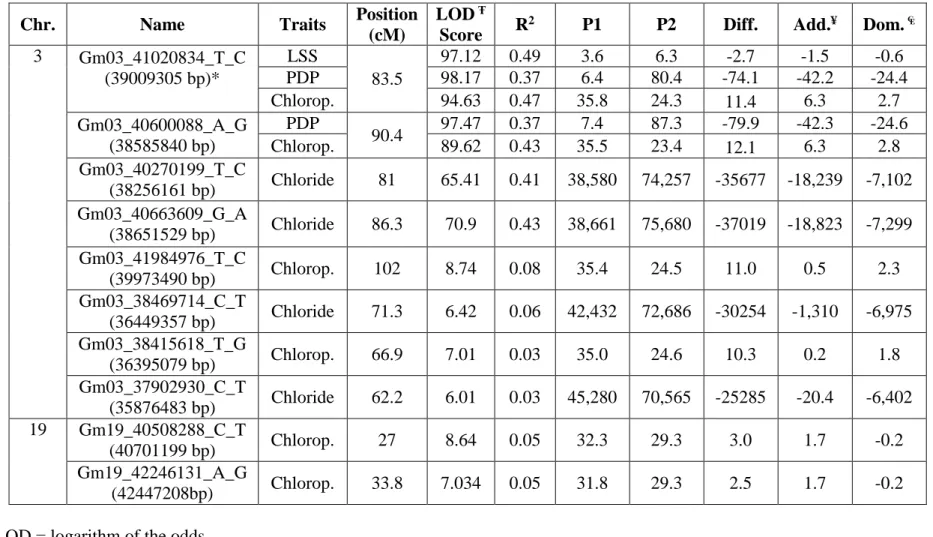
Jake x Ozark evaluated in the greenhouse for salt screening. ...45 Table 8. Composite Interval Mapping for LSS, percentage of dead plants (PDP), leaf
chlorophyll content (Chlorop.), and leaf chloride concentration in 269 F2:3 derived families from
the cross Jake x Ozark evaluated in the greenhouse for salt screening.. ...47
Chapter III
Table 1. Soybean genotypes used for performance evaluation study under NaCl and KCl stress ...77 Table 2. Analysis of variance for leaf chloride content in four soybean varieties under salt
Table 3. Analysis of variance for leaf sodium content in four soybean varieties under salt
treatment (NaCl and KCl at 0, 80, and 120 mM) during 30 days (11 evaluation dates) ...77 Table 4. Analysis of variance for leaf potassium content in four soybean varieties under salt treatment (NaCl and KCl at 0, 80, and 120 mM) during 30 days (11 evaluation dates) ...78 Table 5. Analysis of variance for leaf scorch score (LSS) in four soybean varieties under salt treatment (NaCl and KCl at 0, 80, and 120 mM) during 30 days (11 evaluation dates). ...78 Table 6. Analysis of variance for leaf chlorophyll content in four soybean varieties under salt treatment (NaCl and KCl at 0, 80, and 120 mM) during 30 days (11 evaluation dates). ...78 Table 7. Analysis of variance for leaf area in four soybean varieties under salt treatment (NaCl and KCl at 0, 80, and 120 mM) during 30 days (11 evaluation dates).. ...79 Table 8. Analysis of variance for leaf dry weight in four soybean varieties under salt treatment (NaCl and KCl at 0, 80, and 120 mM) during 30 days (11 evaluation dates). ...79 Table 9. Leaf chloride content (mg/kg) of four soybean varieties under four different salt
treatments during 30 days of evaluation ...80 Table 10. Leaf sodium content (mg/kg) of four soybean varieties under four different salt
treatments during 30 days of evaluation ...82 Table 11. Leaf potassium content (mg/kg) of four soybean varieties under four different salt treatments during 30 days of evaluation. ...84 Table 12. Leaf scorch score of our soybean varieties under four different salt treatments during 30 days of evaluation. ...86 Table 13. Leaf chlorophyll content of four soybean varieties under four different salt treatments during 30 days of evaluation.. ...87 Table 14. Leaf area (cm2) of four soybean varieties under four different salt treatments during 30
days of evaluation. ...89 Table 15. Leaf dry weight (g) of four soybean varieties under four different salt treatments obtained during 30 days of evaluation. ...91
LIST OF FIGURES
Chapter II
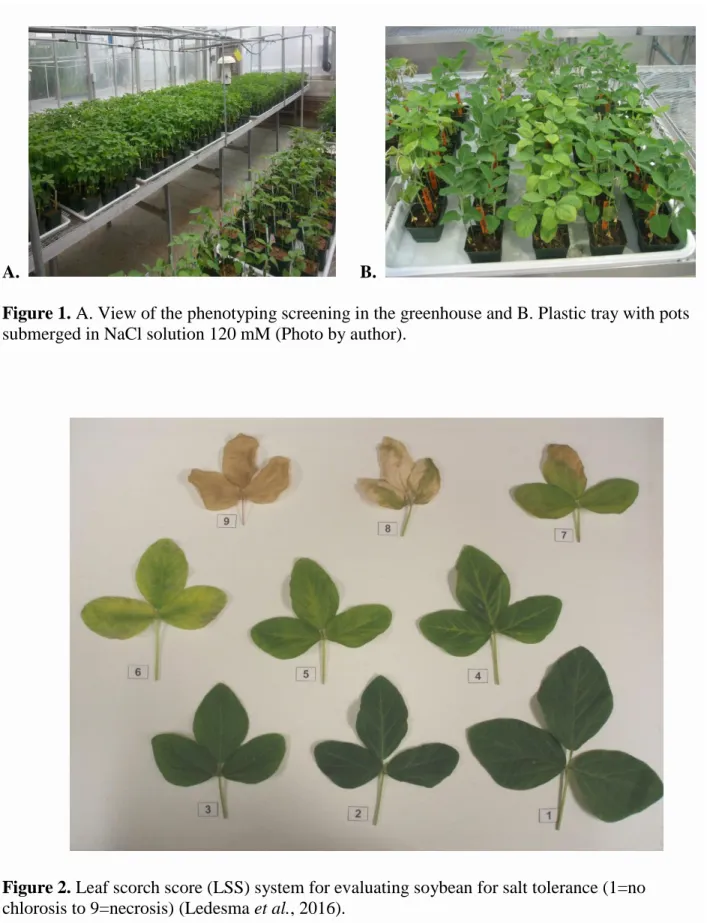
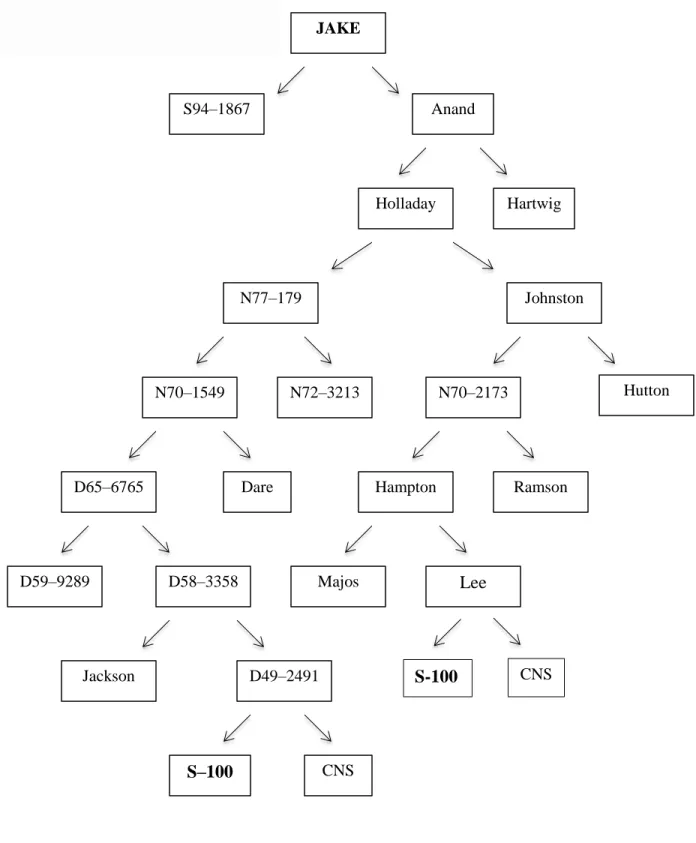
Figure 1. A. View of the phenotyping screening in the greenhouse and B. Plastic tray with pots submerged in NaCl solution 120 mM ...48 Figure 2. Leaf scorch score (LSS) system for evaluating soybean for salt tolerance (1=no
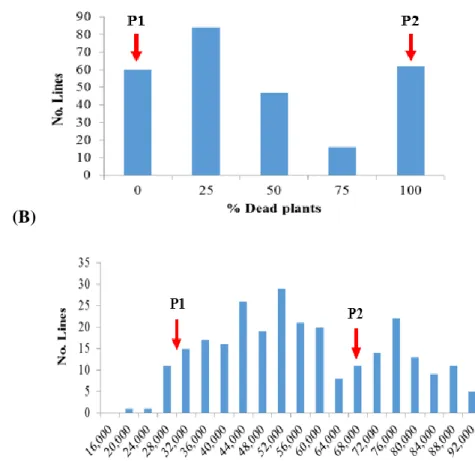
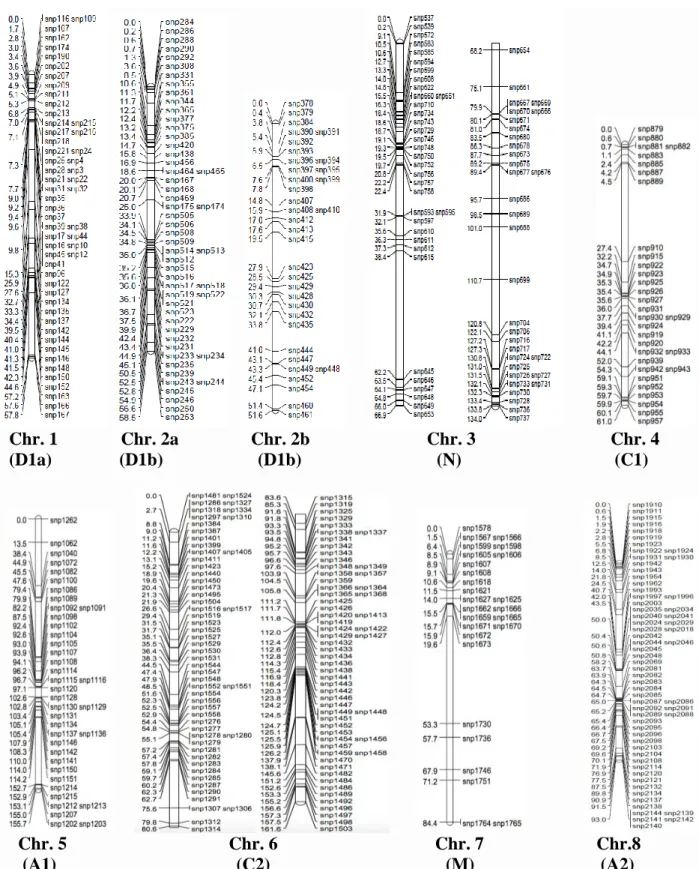
chlorosis to 9=necrosis) ...48 Figure 3. Pedigree of the soybean variety Jake ...49 Figure 4. Frequency distribution of the phenotypic data in the 269 families from the F2:3
population evaluated under greenhouse conditions for the evaluated traits ...50 Figure 5A. Genetic map constructed for chromosomes 1–8 using the F2:3 mapping population
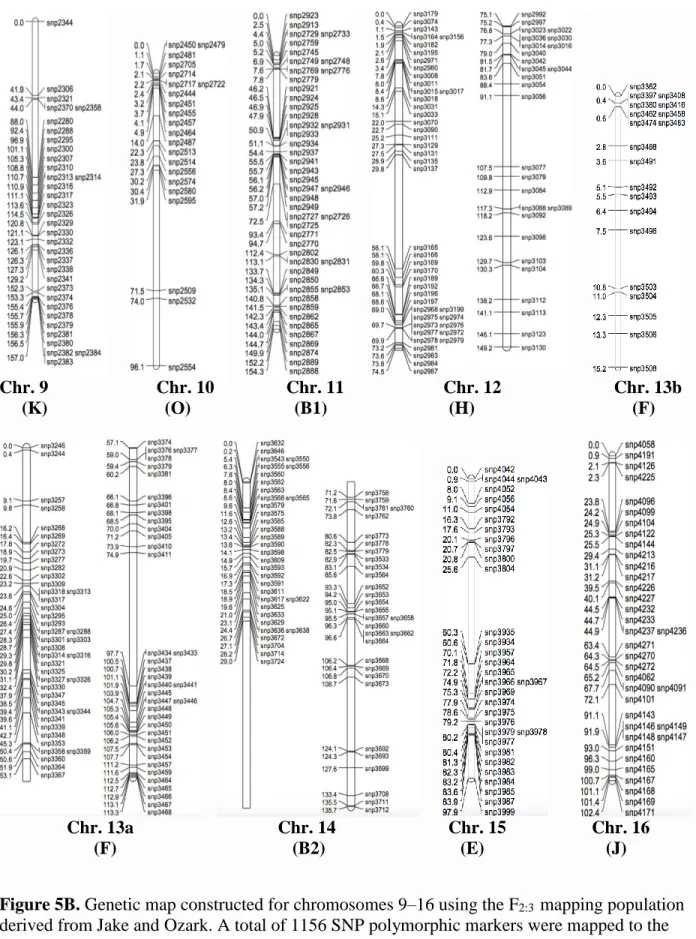
derived from Jake and Ozark. ...51 Figure 5B. Genetic map constructed for chromosomes 9–16 using the F2:3 mapping population
derived from Jake and Ozark ...52 Figure 5C. Genetic map constructed for chromosomes 17–20 using the F2:3 mapping population
derived from Jake and Ozark. ...53
Figure 6. Composite interval mapping using SNP markers on chromosome 3 for QTL detection
in 269 F2:3 derived families from the cross Jake x Ozark for the traits: (A) LSS, (B) PDP, (C)
Leaf chlorophyll content, and (D) Leaf chloride content ...54
Figure 7. Composite interval mapping using SNP markers on chromosome 19 for QTL detection
in 269 F2:3 derived families from the cross Jake x Ozark for leaf chlorophyll content. ...55
Chapter III
Figure 1. Leaf chloride (Cl-) accumulation in four soybean varieties during 30 days under four different salt treatments: 80 mM NaCl (A), 120 mM NaCl (B), 80 mM KCl (C), and 120 mM KCl (D) ...93 Figure 2. Leaf sodium (Na+) accumulation in four soybean varieties during 30 days under four different salt treatments: 80 mM NaCl (A), 120 mM NaCl (B), 80 mM KCl (C), and 120 mM KCl (D) ...94 Figure 3. Leaf potassium (K+) accumulation in four soybean varieties during 30 days under four different salt treatments: 80 mM NaCl (A), 120 mM NaCl (B), 80 mM KCl (C), and 120 mM KCl (D) ...95
Figure 4. Leaf scorch score (LSS) (where 1= healthy dark green leaves and 9 = necrosis) in four soybean varieties during 30 days under four different salt treatments: 80 mM NaCl (A), 120 mM NaCl (B), 80 mM KCl (C), and 120 mM KCl (D) ...96 Figure 5. Leaf chlorophyll content in four soybean varieties during 30 days under four different salt treatments: 80 mM NaCl (A), 120 mM NaCl (B), 80 mM KCl (C), and 120 mM KCl (D). ..97 Figure 6. Leaf area (cm2) in four soybean varieties during 30 days under four different salt
treatments: 80 mM NaCl (A), 120 mM NaCl (B), 80 mM KCl (C), and 120 mM KCl (D). ...98 Figure 7. Leaf dry weight (g) in four soybean varieties during 30 days under four different salt treatments: 80 mM NaCl (A), 120 mM NaCl (B), 80 mM KCl (C), and 120 mM KCl (D).. ...99 Figure 8. Chlorosis and necrosis symptoms in soybean varieties 30 days after being exposed to different salt treatments: 80 mM NaCl (A), 120 mM NaCl (B), 80 mM KCl (C), and 120 mM KCl (D). ...100
1 CHAPTER I. Introduction and literature review
Soybean production and uses
Soybean [Glycine max (L.) Merr.] is one of the most important cash crops worldwide used as a
source of high–quality seed protein (40%) and oil (20%) for animal and human consumption. This crop has the highest protein and vegetable oil content among the cultivated species in the world (Singh, 2010). It is also used as raw material for the production of biodiesel and
nutraceutical/pharmaceutical and industrial products (Phang et al., 2008; Salimi, 2013). The total
soybean world production registered for 2014 – 2015 is 319.73 million metric tons occupying a land area of 118.40 million hectares. The United States ranks first in world soybean production with 106.8 million metric tons followed by Brazil, Argentina, China, and India with 97.20, 61.40, 12.5, and 8.71 million metric tons respectively (Soy Stats, 2013; USDA 2016).
The origin of soybean cultivation is China about 5000 years ago, where the most extensive distribution and diversity types have been registered. Soybean production rapidly developed in the USA during the 1950s. The demand for soybean products is continuously increasing. Some of the traditional non-fermented soybean products for human consumption are: milk, soybean sprouts, tofu (bean curd), and edamame. The most traditional fermented soybean products are natto, tempeh, miso, and soybean sauce. The seed is pressed to obtain oil and soybean meal. Oil is frequently used to produce edible oil, printing ink, and biodiesel while soybean meal is used as a main protein source for animal feed for farming. Compounds with high nutritional value can also be obtained from soybeans: soy peptide, isoflavones, saponins, phosphatides, and
2 Salinity and its effects on soybean
More than 800 million hectares of land across the world are salt-affected due to salinity and sodicity, which is equivalent to more than 6% of the worldwide land area (Arzani, 2008) and about 20% of the arable land (Sairam and Tyagi, 2004). The FAO reported in 2000 a global salt-affected area of 831 million hectares including saline and sodic soils (soils having natric horizons with an exchangeable sodium percentage (ESP) above 15). In order to supply the increasing food demand to feed the growing world population, it is necessary to increase yield per unit of land by improving crop productivity. Most of the suitable area for agricultural practices is already in use, and the expansion of land, in most of the cases, is considered neither feasible not desirable (Rengasamy, 2006).
The process of salinization occurs when water-soluble salts accumulate in the first horizons of the soil. A saline soil is characterized by an electrical conductivity of its saturation extract higher
than 4dS m-1, causing a diversity of negative impacts in agriculture, economy and environment.
The main causes of salinization are rainfall, rock weathering, seawater intrusion, as well as inappropriate drainage, irrigation, and fertilization practices (Rengasamy, 2006; White and Broadley, 2001).
Sodium salts are found to be predominant in saline soils; however, the presence of soluble salts containing such ions as calcium, magnesium, potassium, iron, boron, sulphate, carbonate and bicarbonate are present in certain areas (Rengasamy, 2006).
A plant is considered salt tolerant if it is able to grow and complete its life cycle in a rooting medium with high concentrations of soluble salts. Plants exposed to salt stress conditions can use protection mechanisms to either exclude salt from the cells or tolerate them inside, such as the
3
selective accumulation or exclusion of ions, ion uptake control from roots to shoots, synthesis of compatible solutes, changes in photosynthetic pathways, and induction of enzymes and
hormones, among others (Parida and Das, 2005; Phang et al., 2008). These mechanisms are
classified as low–complexity mechanisms when they involve changes in biochemical pathway, and high–complexity when the mechanisms involve protection of major processes such as photosynthesis, respiration, cell wall and membrane integrity, and chromosome/DNA structure changes (Parida and Das, 2005).
Salt stress is one of the main abiotic stresses that produce significant yield losses in soybean. Soybean is considered a moderately salt–sensitive crop. Currently, plant breeding is a promising strategy to improve salt tolerance as soybean germplasm display wide variation in response to salinity stress.
Luo et al. (2005) found that soybean was more susceptible to Cl– than Na+ after being exposed to
saline solutions in the first stages of development. However, it is still unknown whether Na+ or
Cl– play the most critical role in the response of the plants to salt stress. Additionally, there is a differential inclusion and exclusion of these ions in roots and leaves among soybean cultivars, defining their tolerance capability (Phang, 2008).
In the soil solution, chlorine is present as the chloride ion (Cl–), which is generally considered to
be a conservative tracer of water, flows in soils. It is osmotically active in the vacuoles regulating cell turgor, being involved in the function of some enzymes, membrane regulation, and
intracellular pH gradients. Chloride ion is mobile within the plant and it is an essential
micronutrient required for the water–splitting reaction during photosynthesis. Its transport occurs at the tonoplast and is regulated by its content in the roots. Crops are classified according to their
4
salt tolerance level, depending on their response to high Cl– concentrations and other ions present
in the soil solution.
The capacity of the cultivars to withstand high levels of chloride is related to the capacity of the
plant to restrict the movement of the ion from the roots. In Glycine max, this trait has been found
to be heritable and controlled by one gene: Ncl (White and Broadley, 2001).
Salt stress leads to decreases in productivity and ultimately to plant death. Major processes such as photosynthesis and the metabolism of protein, energy, and lipids are affected under salt stress conditions. Leaf surface expansion and growth are reduced. Saline soils limit water uptake and induce osmotic and nutritional imbalances in the plants. Salt stress interferes in the uptake, transport and use of mineral elements such as N, K, P and calcium. Soybean growth,
development, yield and seed quality are the result of the interaction between genetic potential and environmental conditions (Essa, 2002; Parida and Das, 2005; Ghassemi-Golezani and Taifeh-Noori, 2011).
Mechanisms for salt tolerance in plants
Numerous studies have been performed to understand the salt tolerance mechanisms in different types of plants and crops (Muns and Tester, 2008; Parida and Das, 2005; Tester and Davenport, 2003; Zhu 2001, 2002, 2003) including soybean (Abel and MacKenzie, 1964; Abel, 1969; De Souza et al., 1997; Guan et al., 2014; Pantalone et al., 1997; Luo et al., 2005; Phang et al., 2008;
Ping et al., 2002; Shereen et al., 2001). Phang et al. (2008) summarized four main mechanisms
involved in soybean response to salt stress: 1) maintenance of ion homeostasis, 2) osmotic adjustment by osmoprotectants, 3) restoration of oxidative balance, and 4) other metabolic and
5
structural adaptations. The level of response of soybean using these mechanisms varies according to the efficiency of the genotypes in coordinating them.
1) Maintenance of ion homeostasis: Sodium chloride is one of the most common salts present
in the soil. Even though the accumulation of Cl– in the leaves is associated with salt–induced
damage in soybean, it remains unclear which of the ions, Na+ or Cl–, plays the most critical role
in sodium chloride mortality. It has been suggested that salt tolerant soybeans have a more
energetic system for the transportation of ions and exchange between Na+ and K+ in xylem
tonoplasts mediated by Na+/H+ (NHX exchangers) and K+/H+ antiporters, which sequester excess
of cytosolic Na+ into the vacuoles. This way soybean roots can pump out Na+ from the
transpiration stream in exchange with K+ using energy from H+–ATPase (Allen et al., 1995;
Parida and Das, 2005).
2) Osmotic adjustment by osmoprotectants: Salt excess leads to osmotic stress due to low water potential in the environment dropping stomatal conductance, similar to what it happens in drought stress. In response to this phenomenon, several metabolites (compatible solutes) are
produced to lower the osmotic potential and protect metabolic reactions (Hasegawa et al., 2000).
These metabolites are grouped in four categories: onium compounds, polyols/sugars, amino acids, and alkaloids. The role of proline, another type of osmoprotectant, remains controversial due to the discrepancy among studies when using germplasm of different background in different experimental conditions; however, proline may contribute to the reduction of the plant osmotic potential to enhance water uptake.
3) Restoration of oxidative balance: Salt and osmotic stresses interfere in the scavenging of reactive oxygen species (ROS), a byproduct generated by several metabolic pathways mainly
6
localized in mitochondria and chloroplasts due to their active electron transport. ROS accumulation causes adverse effects in plants by inhibiting enzymes, promoting chlorophyll degradation, lipid peroxidation and damage in nucleic acids leading to cell death (Halliwell and
Gutteridge, 1985; Fath et al., 2001). It is proposed that antioxidant components can minimize
cellular damage by restoring oxidative balance. Some of these components include: the enzyme SOD (superoxide dismutase), oxidases, glutathione (GSH), ascorbic acid (AsA), and acid phosphatases encoded by the gene GmPAP3. Salt tolerant genotypes produce higher amounts of antioxidants than sensitive cultivars as a mechanism to protect cell metabolism (Yu and Liu, 2003).
4) Structural adaptations: Cellular structure modifications are thought to play an important role in soybean adaptation to salt stress environments. One of them is the presence of salt gland–like cells in the epidermis of leaves and stems, which contain large vacuoles. Likewise, the presence
of glandular hairs on wild soybean leaves helps with the secretion of Na+ and Cl– excess (Li et
al., 2003). Similarly, wall and membrane cell modifications support plant adaptation. A proline–
rich cell wall protein encoded by SbPRP3 increases under high salt concentrations to modify wall structure. Under salt stress phospholipid content is reduced and the saturated fatty acid contents increased in plasma membrane in order to enhance salt tolerance (Huang, 1996).
Effect of salt stress in soybean growth and development
High salinity severely affects growth and development by affecting metabolic processes such as
CO2 assimilation, protein and oil synthesis (Ghassemi-Golezani and Taifeh-Noori, 2011). Salt
stress produces damage in the whole soybean cycle, causing decreases in seedling growth,
7
1964; Chang et al., 1994, Essa, 2002; Katerji et al., 1998; Serraj et al., 1998; Wang and
Shannon, 1999; Katerji et al., 2003).
The first stages of soybean are greatly affected by salt stress. Soybean germination is delayed under low salt concentrations and seedling stage is considered to be more sensitive to salt stress
than germination (Shao et al, 1993; Phang et al., 2008). After plants are subjected to salt stress
environments, the first physiological reaction is the reduction of water entry in the roots, followed by reduced height and development of small dark green leaves (Abel and MacKenzie, 1964).
Several studies have reported wide variation in soybean salt tolerance during germination and plant growth. Even though soybean generally behaves as a sensitive cultivar, the duration of this sensitivity varies among cultivars (Abel and MacKenzie, 1964; Lauchli and Wieneke, 1979; Essa
and Al–Ani, 2001; Essa, 2002; Luo et al., 2005; Ghassemi-Golezani and Taifeh-Noori, 2011;
Kondetti et al, 2012).
Parker et al. (1983) reported that salt–sensitive soybean cultivars reached a 37% lower yield than
tolerant cultivars and displayed clear foliar symptoms such as chlorosis, browning, scorch and abscission of leaves. The soybean cultivar Lee, considered moderately salt tolerant, displayed a seed yield reduction of 50% when the electrical conductivity of the soil was raised up to 9 millimhos/cm (Abel and MacKenzie, 1964). Under salt stress net photosynthesis is significantly correlated with grain yield. Higher chlorophyll fluorescence in varieties with higher salt
tolerance is another factor that contributes to better photosynthetic traits (He et al, 2016).
Salinity reduces the amount of chlorophyll and the efficiency of photo–system II and increases the amount of proline, an amino acid involved in the lowering of osmotic potential of vacuoles.
8
The more tolerant the plant is to adverse salinity conditions, the less chlorophyll degradation
occurs (Kummar et al., 2003). Photosynthesis in leaves is reduced under salt stress conditions
and induces premature senescence, primarily due to toxic accumulations of Na+ and Cl– and/or
depletion of K+ or Ca2+ (Saquib et al., 2012). Salt accumulation reduces the potassium roll as an
osmotic regulator in leaves. Thus, Na+ and K+ increase is one of the main causes of growth
decrease (Sofalian et al., 2013).
Chen et al. (2013) found that salt stress reduced photosynthesis rate in cultivated and wild
soybean by reducing stomatal conductance as NaCl concentration increased from 50 to 200 mM. With concentrations higher than 300 mM, a decrease in photosynthesis was due to other non– stomatal factors.
In soybean, salt induced damage is associated with chloride accumulation in the aerial part;
however, it has been found that tolerant cultivars accumulate less Na+ in leaves (Li et al., 2006).
Additionally, there is a differential inclusion and exclusion of Na+ and Cl– in soybean cultivars
with contrasting tolerance response. For example, in a study performed by An et al. (2002) to
study the role of the root system in salt tolerance and compare ion accumulation between the tolerant cultivar ´Dare´ and the susceptible cultivar ´Tachiyutaka´. It was found that ´Dare´ had
lower Na+ contents in roots and higher water uptake rate than ´Tachiyutaka´, which in contrast
performed as a Na+ includer in roots. Therefore, Dare either take up less Na+ ions or exclude
more Na+. Valencia et al. (2008) reported that in general soybean roots tend to contain higher
amount of Na+ and Cl– than leaves, and between them, Cl– is predominant. In addition, Cl–
excluders (tolerant genotypes) contained greater amount of this element in roots than Cl–
9
Also, it is reported that cultivated soybean (Glycine max) is more susceptible to Cl– than wild
soybean (G. soya). Wild soybean is more susceptible to Na+ and its tolerance level depends on
how genotypes successfully retain Na+ in roots (Luo et al., 2005). Tolerant cultivars have the
capacity to not only restrict the mobility and accumulation of Na+ and Cl– in the aerial parts, but
also to assimilate more K+, thus being able to maintain a more desirable Na+ /K+ ratio, especially
in leaves (Essa, 2002; Chen et al., 2013).
Ghassemi-Golezani and Taifeh-Noori (2011) evaluated three soybean genotypes in the field under three concentrations of NaCl solution (3, 6, and 9 dS/m) using hydroponics. Plants were observed over a period of approximately seven weeks in order to evaluate chlorophyll content and fluorescence, protein, oil, proline content, and seed yield. They found that both proline and grain yield were significantly affected by salinity. Chlorophyll content index and protein yield decreased in all cultivars as salinity increased due to disturbance in nitrogen absorption and metabolism. In contrast, proline, and oil content increased with increasing salinity. Crop production was severely limited because high salinity lowers water potential, inducing ionic stress, which leads to secondary oxidative stress.
Salt stress also reduces growth and yield components by affecting endogenous growth hormones.
Hamayun et al. (2010) performed a study to evaluate the effects of NaCl induced stress on
phytohormones and growth attributes on a soybean cultivar using saline solution 70 mM and 140
mMbefore and after flowering. Results showed that endogenous gibberellins (GA) were
significantly reduced under high salt concentration, while abscisic acid (ABA) and jasmonic acid (JA) content in leaves significantly increased in both stages. The decrease in growth and
chlorophyll content was higher when the stress was applied in pre–flowering stage. Under saline
10
Na+ /K+ ratio due to elevated cytosolic Na+, exerts ion toxicity by competition of these ions for
enzyme binding sites and displaces Ca+2 from plasma membranes affecting their permeability.
Salt tolerance screening in soybean
The discovery of new genotypes is essential in the aim of finding new sources of salt tolerance resistance. Although soybean is a moderately salt–sensitive crop, differential response among genotypes has been found, suggesting that there is genetic variability for this trait (Abel and
MacKenzie, 1964; Pantalone et al., 1997; Shannon, 1997; Lee et al., 2004). Different screening
methods have been proposed to evaluate and select salt–tolerant soybean genotypes in the field
and greenhouse (Yang and Blachar, 1993; Pantalone et al., 1997; An et al., 2002; Lee et al.,
2004; Valencia et al., 2008; Lee et al., 2008). Field screening evaluations of soybean genotypes
planted in soils with high salt concentration have been sometimes considered unsuccessful due to the variability of salt levels across the soil and the changing environmental conditions. Another
method was proposed by Valencia et al., 2008 using hydroponics, in which a NaCl solution was
supplied to the plants in a greenhouse controlling nutrition and environment. However, it becomes expensive and inefficient since nutrient solutions need to be constantly changed. A simpler screening called PC method (plastic cone-tainers) was tested with good results. In this
method, sandy soil was used as a growth medium instead of a nutrient solution (Lee et al., 2008).
Measuring traits as plant biomass, leaf scorch, and ion concentration in plant tissue has led to the
discovery of clear differences in salt tolerance among genotypes. Valencia et al. (2008) found
that soybean plants treated with 120 mM NaCl displayed the most effective and consistent salt tolerance data based on visual foliar symptoms evaluating a set of differential genotypes.
11
screening for Cl– sensitivity using root visual evaluation for symptoms was not as effective as the
visual leaf evaluation.
Ledesma et al. (2016) also proposed a greenhouse salt screening method using sandy soil and
120 mM NaCl and measuring visual leaf scorch score (LSS, scale 1–9) and chloride content in leaves as parameters to evaluate salt tolerance in a large set of soybean cultivars with differential response to salt stress. After the development of a set of experiments and the validation of the methodology, a positive and strong correlation was found between LSS and ion content in roots and leaves validating the accuracy of the visual ratings; however, the lowest correlation was found between LSS and ion content in roots indicating that ion content in roots is not a consistent indicator for the evaluation of salt tolerance response. Differently, the strongest correlation was found between LSS and chloride content in leaves. These parameters provided the clearest statistical differences among all growing media and NaCl concentrations.
Genetics of salt tolerance in soybean
Salinity control using environmental amendments like the use of improved irrigation techniques is usually very expensive and constitute a short–term solution to mitigate the process of soil salinization. The development of salt tolerant crops widening plant-breeding programs is a very effective way to develop cultivars able to produce economic yields under saline conditions. Salt tolerance is a complex trait of polygenic nature that responds to cellular osmotic, ionic, and oxidative stresses, which operate at the cellular level. Glycophytes have special cellular
mechanisms to overcome salt stress (Hasegawa et al., 2000). The development of salt tolerant
plants has been achieved via cell and tissue culture, and molecular breeding using molecular markers and genetic engineering (Arzani, 2008).
12
The first genetic studies for soybean salt tolerance report the existence of a single gene pair, which is responsible for the regulation of the exclusion and inclusion of chloride in soybean
leaves and stems denominated Ncl and ncl, respectively (Abel, 1969). This QTL have been since
mapped by several researchers to the same region in Chromosome 3 (linkage group N) using
distinct crosses between cultivated and/or wild soybean parents (Shao et al., 1994; Lee et al.,
2004; Chen et al., 2008; Hamwieh and Xu, 2008; Hamwieh et al., 2011). These consistent results
found in this region of chromosome 3, have led to the hypothesis that a conserved gene or
several genes control salt tolerance in diverse germplasm (Qu et al., 2015).
Recent studies have reported that Ncl gene simultaneously controls Cl–, Na+ and K+ transport and
accumulation in soybean. Do et al. (2016) found that the expression of this gene in the soybean
variety FT–Abyara under salt stress, is higher in roots when the accumulation of these ions in shoots diminishes.
Marker assisted selection and quantitative trait loci (QTL) mapping for salt tolerance in soybean
Important traits in crops such as yield, quality, and resistance are considered quantitative since many genes with a low effect, or polygenes, regulate them. A QTL is a region (loci) within the
genome, which contains genes associated with a particular quantitative trait (Collard et al.,
2005). Marker assisted selection constitutes a powerful tool to identify QTL associated with salt tolerance using specific DNA markers associated with this trait, given that conventional
phenotypic evaluation is not enough for gene discovery and linkage mapping (Hamwieh et al,
2011). A linkage map is a representation of the linkage groups (chromosomes) of a species used to identify genomic regions that contain genes controlling either simple traits (single gene), or
13
complex traits using QTL analysis (process known as QTL mapping). QTL mapping is based on the principle that genes segregate during meiosis through chromosome recombination, which can be analyzed in the progeny considering the fact that genes with narrow distance between them (tightly–linked genes) are going to be inherited together with higher frequency in following generations (Collard et al., 2005).
Mapping of QTL related to abiotic stresses, as salt tolerance, is very important in soybean
breeding programs for the application of map–based cloning and marker assisted selection (Chen
et al., 2008)
Several studies have examined salt tolerance inheritance in soybean. Abel (1969) used different parent combinations to study chloride exclusion in soybean, finding that there is a single
dominant gene, Ncl, controlling salt tolerance in the cultivar Lee (S100 x CNS), S–100 being the
source of tolerance. Lee et al. (2004) identified a major QTL on linkage group N (chromosome
3) associated with salt tolerance, after the evaluation of 106 F2:5 RILs (recombinant inbred lines)
coming from the cross S–100 x Tokyo. The estimated position of this QTL was in the interval between the SSR markers Sat091, Satt339, Satt237 explaining 41% (field), 60% (greenhouse) and 79% (combined environments) of the genetic variance, and it was concluded that it could be
the Ncl locus previously found. Hamwieh and Xu (2008) studied wild soybean salt tolerance
inheritance using an F2 population derived from the cross between the cultivar Jackson
(sensitive) and the wild accession JWS156–1 (tolerant) based on visual symptoms (scorching) and chlorophyll content. A major salt–tolerant QTL, accounting for 68.7 % of the total scorch rating variance, was located in a similar QTL interval region (covering markers Satt339, Satt237)
previously reported by Lee et al. (2004). Hamwieh et al. (2011) found the same QTL using NILs
14
screened under greenhouse and field conditions 184 F7:11 RILs coming from the cross between
Kefeng No.1 (tolerant) x Nannong 1138–2 (sensitive). A different major QTL was localized on linkage group G (chromosome 18) between the markers Sat_164 and Sat_358 explaining 11 and 18% of the phenotypic variation in field and greenhouse, respectively. Overall, they found seven new QTLs in six different linkage groups. Three QTL were detected in field experiments
explaining 7.1–19.7% of the phenotypic variance for salt tolerance in linkage groups G (Chr. 18) and M (Chr. 7). Under greenhouse conditions six QTLs were detected explaining 7.8–19.2% of the phenotypic variation in linkage groups B1 (Chr. 11), B2 (Chr. 14), D1b (Chr. 2), G (Chr. 18), K (Chr. 9), and N (Chr. 3).
The salt tolerance mechanism in wild soybean genotypes is different than the mechanism used by
cultivated soybean in terms of Na+ and Cl– susceptibility and exclusion (Luo et al., 2005). Lee et
al. (2009) reported the existence of a tolerant gene on linkage group N in the wild soybean
PI483463, designated as Ncl2. This PI was crossed to the sensitive cultivar Hutcheson to perform
an allelism test and study the inheritance of this trait. The gene Ncl2 was localized between
Sat_91 and BARC-016485-02069. In a more recent study performed by Ha et al. (2013), the
QTL conferring salt tolerance in PI483463 was mapped within a 658-kb region between SSR03_1335 and SSR_1359. This region was 658-kb and contained 80 annotated genes,
including two genes (Glyma03g32890 and Glyma03g32900) belonging to the sodium/hydrogen
exchanger family. Subsequently, Qi et al. (2014) mapped the candidate causal gene underlying
GmCHX1 (counterpart of Glyma03g32900 in Williams 82) in the wild soybean accession W05
using whole genome sequencing. Similarly, Guan et al in 2014 identified the candidate causal
gene Glyma03g32900 (GmSALT3) underlying the QTL in chromosome 3 in the Chinese soybean
15
The use of Ncl locusby gene transfer or MAS could contribute to sustainable soybean
production in saline soils. Do et al. (2016) isolated the Ncl gene from the soybean cultivar FT–
Abyara using map–based cloning. They found that the gene not only regulated Na+ and K+ as
expected (since the gene belongs to the Na+/H+ antiporter gene family), but was also responsible
for the control of Cl– accumulation. Additionally, the allele Ncl helped to achieve sustainable
yields in a set of NILs obtaining 3.6–5.5 higher yields than lines without the allele. This represented a 28% vs. 80% yield loss for tolerant lines and susceptible lines, respectively.
A study to evaluate alkaline salt tolerance (tolerance to excess of sodium) revealed the existence of a major QTL on linkage group D2 (Chr. 17) between the markers Satt669 and Sat_300, which
accounted for 50.2 and 13.0% of the total variation for scorch scoring in F6 and F2 populations
respectively. These populations were derived from the cross JWS156-1 (tolerant G. soja to NaCl
and alkaline salt stress) x Jackson (sensitive G. max) (Tuyen et al., 2010).
Recently, Guan et al. (2014 a, b) mapped and validated GmSALT3 (Glycine max Salt
Tolerance-associated gene on chromosome 3), a dominant gene for salt tolerance to a 209 Kb region on
linkage group N found in the salt–tolerant cultivar Tiefeng 8. The authors treated an F2:3
population derived from the soybean cultivars Tiefeng 8 (tolerant) and 85–140 (sensitive) with
200 mM NaCl to evaluate salt tolerance, obtaining a 1:2:1 segregation ratio. GmSALT3 was
localized within the markers QS08064 (SCAR) and Barcsoyssr_3_1301 (SSR) using map–based
cloning. This gene encodes a protein associated with cation/H+ exchange in root cells present in
xylem and phloem, leading to lower sodium accumulation in shoots. The expression of this candidate gene in the cultivar Tiefeng was higher in roots compared to shoots. Probably, the
reduction of salinity selection pressure on soybean led the gene GmSALT3 to have mutations
16
et al., 2015). It has been hypothesized that the variation of the response in cultivated and wild
soybean to salt tolerance can be explained by loss-of-function mutation in Ncl occurred before
soybean domestication from ancestral wild species (Do et al., 2016).
Qi et al. (2014) used whole–genome–sequencing and genotyping–by–sequencing based genetic mapping in a recombinant inbred population to identify novel genes associated with salt
tolerance in wild soybean. The RI population was obtained "by crossing the de novo–sequenced
W05 (high–tolerance wild soybean accession) with the re–sequenced cultivated soybean
accession C08 (sensitive)". A 338 Kb novel transporter gene (GmCHX1) was identified. This
major salt tolerant locus confers salt tolerance by lowering the Na+/K+ ratio in leaves.
The constantly detected QTL on chromosome 3 associated with soybean salt tolerance is likely
to be the Ncl locus. The genes Glyma03g32890 and Glyma03g32900, belonging to the Na+/H+
exchanger family have been found in this QTL region in wild soybean accessions. Similarly, the
candidate causal genes GmCHX1 in Williams 82 and GmSALT3 in the wild soybean accession
W05, are counterparts of Glyma03g32900 and are associated with limiting the accumulation of
sodium (Do et al., 2016). Further studies are needed to find genes associated with Cl- transport
and accumulation and its relationship to Na+ and K+ regulation in the efficiency of the salt
17
Table 1. Texture and chemical properties of the sandy loam soil used for the salt tolerance screening in the greenhouse.
pH
EC (µmhos/cm)
---mg/kg--- Texture %
P K Ca Mg S Na Fe Mn Zn Cu B NO3N&NO2N NH4-N Sand Silt Clay
8,3 125 7.8 55 2083 107 4.5 4.9 89 46 1.7 0.6 0.02 16.2 2.4 71 24 5
Table 2. Summary of molecular markers reportedly associated with soybean salt tolerance
Chr. Marker
type % V Marker Parents (T x S) Authors
3 SSR 45 Satt237-Sat_091 S-100 x Tokyo Lee et al. (2004)
3 SSR 68.7 Satt339, Satt237, Satt255 JWS156-1 x Jackson Hamwieh and Xu (2008)
3 SSR, SNP 56.5 Satt255, BARC-038333-10036 PI 483463 x Hutcheson Ha et al. (2013)
3 SSR 44 Sat_091, Sat_304 FT-Abyara x C01 Hamwieh et al. (2011)
3 SSR 47.1 Sat_091 Jin dou No.6 x 0197 Hamwieh et al. (2011)
3 CAPS – QS100001, QS1119 Tiefeng 8 x 85-140 Guan et al. (2014)
7 SSR 7-19.7 Satt702-Satt728, Satt655-Satt210 Nannong1138-2 x Kiefeng Chen et al. (2008)
17 SSR 50.2 Satt447 JWS156-1 x Jackson Tuyen et al. (2010)
18 SSR 10.8 Sat_164-Sat_358 Nannong1138-2 x Kiefeng Chen et al. (2008)
18 REFERENCES
Abel, G.H. and A.J. MacKenzie. 1964. Salt tolerance of soybean varieties (Glycine max L.
Merrill) during germination and later growth. Crop Sci. 4: 157–161.
Abel. G.H. 1969. Inheritance of the Capacity for Chloride Inclusion and Chloride Exclusion by Soybeans. Crop Sci. 9: 697–698.
Allen G.J, R.G Wyn Jones, R.A Leigh. 1995. Sodium transport in plasma membrane vesicles
isolated from wheat genotypes with differing K+/Na+ discrimination traits. Plant Cell Environ.
18: 105–115.
An, P., S. Inanaga, Y. Cohen, U. Kafkafi, and Y. Sugimoto. 2002. Salt tolerance in two soybean cultivars. J. Plant Nutr. 25: 407-423.
Arzani, A. 2008. Improving salinity tolerance in crop plants: a biotechnological view. In Vitro Cell. Dev. Biol. Plant. 44: 373-383.
Chang, R.Z., Y.W. Chen, G.H. Shao and C.W. Wan. 1994. Effect of salt stress on agronomic
characters and chemical quality of seeds in soybean. Soybean Sci. 13, 101–105.
Chen H., S. Cui, S. Fu, J. Gai, and D. Yu. 2008. Identification of quantitative trait loci associated
with salt tolerance during seedling growth in soybean (Glycine max L.). Aust. J. Agric. Res. 59:
1086–1091.
Chen, P., C.H. Sneller, J.C. Rupe, and R.D. Riggs. 2004. Registration of 'Ozark' Soybean. Crop Sci. 44:1872-1873.
Chen, P., H. Wang, X. Tang, M. Brestic, and H. Shao. 2013.Comparative physiological study between cultivated and wild soybean species under salt stress. Jokull J. 63: 114–124.
Chen, P., M. Orazaly, J.C. Rupe, D.G. Dombek, T. Kirkpatrick, R.T. Robbins, C. Wu, and P. Manjarrez. 2014. Registration of _UA 5213C_ soybean. J. of Plant Reg. 8: 150-154.
Chinnusamy, V., A. Jagendorf and J.K. Zhu. 2005. Understanding and Improving Salt Tolerance
in Plants. Crop Sci. 45: 437–448.
Collard, B.C.Y., M.Z.Z. Jahufer, JB Brouwer, and E.C.K. Pang. 2005. An introduction to markers, quantitative trait loci (QTL) mapping and marker-assisted selection for crop improvement: the basic concepts. Euphytica 142: 169-196.
De Souza, P.I, D. Egli, and W. Bruening. 1997. Water Stress during Seed Filling and Leaf Senescence in Soybean. Agron. J. 89: 807-812.
Do, T. D. et al. 2016. Ncl Synchronously Regulates Na+, K+, and Cl– in Soybean and Greatly
Increases the Grain Yield in Saline Field Conditions. Sci. Rep. 6, 19147. 10 p.
19
Essa, A. T., and D. H. Al-Ani, 2001: Effect of salt stress on the performance of six soybean genotypes. Pakistan. J. Biol. Sci. 4: 175–177.
Essa, T.A. 2002. Effect of salinity stress on growth and nutrient composition of three soybean [Glycine max (L.) Merr.] cultivars. J. Agron. Crop Sci. 188: 86–93.
Fath A, P.C Bethke, M.V Belligni, Y.N Spiegel, and R.L Jones. 2001. Signaling in the cereal
aleurone: hormones, reactive oxygen and cell death. New Phytol. 151: 99–107.
Ghassemi-Golezani K. and M. Taifeh-Noori .2011. Chapter 34: Soybean Performance under Salinity Stress. Soybean - Biochemistry, Chemistry and Physiology. Ed. InTech. 654 p.
Guan, R. Y. Qu, Y. Guo, L. Yu, Y. Liu, J. Jiang, J. Chen, Y. Ren, G. Liu, L. Tian, L. Jin, Z. Liu, H. Hong, R. Chang, M. Gilliham, and L. Qiu. 2014 (a). Salinity tolerance in soybean is
modulated by natural variation in GmSALT3. The Plant J. 80: 937–950.
Guan, R., J. Chen, J. Jiang, G. Liu, Y. Liu, L. Tian, L. Yu, R. Chang, and L. Qiu. 2014 (b).
Mapping and validation of a dominant salt tolerance gene in the cultivated soybean (Glycine
max) variety Tiefeng 8. The Crop J. 2: 358–365.
Ha, B. K., T. Vuong, V. Velusamy, H. Nguyen, J.G Shannon, J. Lee. 2013. Genetic mapping of
quantitative trait loci conditioning salt tolerance in wild soybean (Glycine soja) PI 483463.
Euphytica 193:79–88.
Halliwell, B. 1982. The toxic effects of oxygen on plant tissues. In: Oberly, L.W. (Ed.), Superoxide Dismutase, vol. I. CRC Press, Boca Raton, FL, p. 89–123.
Hamayun, M.,S.A. Khan, A. L. Khan, Z. K. Shinwari, J. Hussain, E. Sohn, S. Kang, Y. Kim, M.
A. Khan, and I. Lee. 2010. Effect of salt stress on growth attributes and endogenous growth hormones of soybean cultivar Hwangkeumkong. Pak. J. Bot., 42: 3103-3112.
Hamwieh, A., D. D. Tuyen, H. Cong, E. R. Benitez, R. Takahashi, and D. H. Xu. 2011.
Identification and validation of a major QTL for salt tolerance in soybean. Euphytica 179: 451– 459.
Hasegawa P.M, R.A Bressan, J.K Zhu, H.J Bohnert. 2000. Plant cellular and molecular responses to high salinity. Annu. Rev. Plant Physiol. Plant Mol. Biol. 51: 463–499.
He, Y., Y. Chen, C. L. Yu, K.X. Lu, Q. S. Jiang, J.L. Fu, G. M. Wang, and D.A. Jiang. 2016. Photosynthesis and yield traits in different soybean lines in response to salt stress.
Photosynthetica 54. 6 p.
Huang C.Y. 1996. Salt-stress induces lipid degradation and lipid phase transition in plasma
membrane of soybean plants. Taiwania.41: 96 – 104.
Huang, L. 2013. Genome-wide association mapping identifies QTLs and candidate genes for salt tolerance in soybean. M.S thesis. University of Arkansas. 129 p.
Jamil, M., Rehman, S., Lee, K. J., Kim, J. M., Kim, H. S. and Rha, E. S. 2007. Salinity reduced growth PS II photochemistry and chlorophyll content in radish. Sci. Agric. 64: 1-10.
20
Kondetti, P., J. Narendra, S. K. Apte, and M. G. Shitole. 2012. Salt tolerance in Indian soybean (Glycine max (L.) Merill) varieties at germination and early seedling growth. Ann. Biol. Res. 3: 1489-1498.
Kummar S.G., A. Matta, C. Sudhakar. 2003. NaCl effects on proline metabolism in two high yielding genotypes of mulberry with contrasting salt tolerance. Plant Sci. 165: 1245–1251. Lauchli, A., and J. Wieneke. 1979. Studies on growth and distribution of Na, K and Cl in soybean varieties differing in salt tolerance. Z. Pflanzenernahr. Bode- nkd. 142: 3–13.
Ledesma, F., C. Lopez, D. Ortiz, P. Chen, K. L. Korth, T. Ishibashi, A. Zeng, M. Orazaly, and L.
Florez-Palacios. 2016
.
A simple greenhouse method for screening salt tolerance in soybean.Crop Sci. 56: 585-594.
Lee, G.J., R.H. Boerma, R.M. Villagarcia, X. Zhu, T.E. Carter, Jr., Z. Li, and M.O. Gibbs. 2004. A major QTL conditioning salt tolerance in S-100 and descendent cultivars. Theor. Appl. Genet. 109: 1610-1619.
Lee, J.D., S.L. Smothers, D. Dunn, M. Villagarcia, C.R. Shumway, T. Carter, Jr., and J.G. Shannon. 2008. Evaluation of a simple method to screen soybean genotypes for salt tolerance. Crop Sci. 48: 2194-2200.
Li G, G.Y Wang, J.Z Son, H. Gao, J.M Lu. 2003. Salt-resistant structures of leaves from Glycine max cultivar “Fendou 16”. J. Northeast Normal Univ. 4: 109–111.
Li, X., P. An, S. Inanaga, E. Eneji, and K. Tanabe. 2006. Salinity and defoliation effects on soybean growth. J. Plant Nutr. 29: 1499–1508.
Luo, Q., B. Yu and Y. Liu. 2005. Differential sensitivity to chloride and sodium ions in
seedlings of Glycine max and G. soja under NaCl stress. J. Plant Physiol.162: 1003–1012.
Munns, R. and M. Tester. 2008. Mechanisms of salinity tolerance. Annu. Rev. Plant Biol. 59:
651–681.
Parida, A.K., and A.B. Das. 2005. Salt tolerance and salinity effects on plants: a review. Ecotoxicol. Environ. Saf. 60: 324–349.
Pantalone, V.R., W.J. Kenworthy, L.H. Slaughter, and B.R. James. 1997. Chloride tolerance in
soybean and perennial Glycine accessions. Euphytica 97: 235–239.
Parker M.B., G.J. Gascho, and T.P. Gaines. 1983. Chloride toxicity of soybean grown on Altantic coast flatwoods soils. Agro. J. 75:439-443.
Phang, T.H., G.H. Shao and H.M. Lam. 2008. Salt tolerance in soybean. J. Integr. Plant Biol. 50:
1196–1212.
Ping, A., S. Inanaga, Y. Cohen, U. Kafkafi and Y. Sugimoto. 2002. Salt tolerance in two soybean cultivars. J. Plant Nutr. 25: 407–423.
21
Plank, C.O. 1992. Plant analysis reference procedures for the southern region of the United States. Southern Cooperative Series Bull. 368. Univ. of Georgia, Athens.
Qi, X., M. Li, M. Xie, X. Liu, M. Ni, G. Shao, C. Song, A. Yim, et al., 2014. Identification of a
novel salt tolerance gene in wild soybean by whole-genome sequencing. Nat. Commun. 5: 4340. 11 p.
Qu, Y., R. Guan, L. Qiu, and M. Gilliham. 2015. Improving the Salinity Tolerance of Soybean. ISB News Report. Available in: http://www.isb.vt.edu/news/2015/Apr/QuGuanQiuGilliham.pdf. Last visit: June 2016.
Rengasamy, P. 2006. World salinization with emphasis on Australia. Journal Exp. Bot. 57: 1017–1023.
Tester, M. and R. Davenport. 2003. Na+ Tolerance and Na+ Transport in Higher Plants. Ann.
Bot. 91: 503-527.
Tuyen, D.D., S.K. Lal, and D.H. Xu. 2010. Identification of a major QTL allele from wild
soybean (Glycine soja Sieb. & Zucc.) for increasing alkaline salt tolerance in soybean. Theor.
Appl. Genet. 121: 229–236.
Sairam, R.K., and A. Tyagi. 2004. Physiology and molecular biology of salinity stress tolerance in plants. Curr. Sci. 86: 407–421.
Saquib, Z., Zulfiqar A. Saqib, J. Akhtar, M. A. Ul-Haq, and I. Ahmad. 2012. Salt induced
changes in leaf phenology of wheat plants are regulated by accumulation and distribution pattern
of Na+ ion. Pak. J. Agri.Sci. 49: 141–148.
Slabu, C., D.P. Simioniuc, F. D. Lipşa , V. simioniuc. 2010. Physiological response to water and
salt stress of some white lupine cultivars (Lupinus Albus L.). Lucrări Ştiinţifice. 53: 64–68.
Shannon, M.C. 1997. Adaptation of plants to salinity. Adv. Agron. 60: 75-120.
Shannon J.G., J.A. Wrather, D.A. Sleper, R.T. Robbins, H.T. Nguyen, and S.C. Anand. 2007. Registration of ‘Jake’ Soybean. J. Plant Regist. Vol 1. May–June. p.29.
Shereen, A., R. Ansari, and A. Soomro. 2001. Salt tolerance in soybean (Glycine max L.): Effect on growth and ion relations. Pak. J. Bot. 33: 393–402.
Shao G.H., J. Z Song, and H. L Liu. 1986. Preliminary studies on the evaluation of salt tolerance in soybean varieties. Acta Agron. Sin. 6: 30– 35.
Shao G.H, C.W Wan, R.Z Chang, and Y.W Chen. 1993. Preliminary study on the damage of plasma membrane caused by salt stress. Crops 1: 39–40.
Shao G.H., R.Z. Chang, Y.W. Chen, and S.R. Yan. 1994. Study on inheritance of salt tolerance
in soybean. Acta Agron. Sin.20: 721–726.
22
Singh, A. K. and Dubey, R.S. (1995). Changes in chlorophyll a and b contents and activities of photosystems 1 and 2 in rice seedling induced by NaCl. Photosynthetica, 31: 489-499.
Sofalian, O., P.B Miandoab., A. Asghari, M. Sedghi, and A. Eshghi. 2013. Relationship between
salt tolerance related physiological traits and protein markers in soybean cultivars (Glycine max
L.). Cercet. Agronon. Mold. 46:47–56.
USDA– United States Department of Agriculture. 2016. World Agricultural Production. Foreign Agricultural Service. Circular Series WAP 6-16 June 2016. Available in:
http://apps.fas.usda.gov/psdonline/circulars/production.pdf
USDA, ARS, National Genetic Resources Program. Germplasm Resources Information Network (GRIN).URL: http://www.ars-grin.gov/npgs/searchgrin.html. Last visit: January, 2014.
Valencia, R., P. Chen, T. Ishibashi, and M. Conaster. 2008. A rapid and effective method for screening salt tolerance in soybean. Crop Sci. 48:1773-1779.
Vile, D., E. Garnier, B. Shipley, G. Laurent, M. Navas, C. Roumet, S. Lavorel, S. Diaz, J. Hodgson, F. Lloret, G. Midgley, H. Poorter, M. Rutherford, P. Wilson, I. Wright. 2005. Specific leaf area and dry matter content estimate thickness in laminar leaves. Ann. Bot. 96: 1129–1136.
Virginia Crop Improvement Association.Glenn Soybean Variety Description. URL:
http://www.virginiacrop.org/glenn_soybean_variety.htm (January, 2014).
Wang J, M. van Ginkel M, D. Podlich, G.Ye, R. Trethowan, W. Pfeiffer et al. (2003).
Comparison of two breeding strategies by computer simulation. Crop Sci. 43: 1764–1773. Wheal, M.S., and L.T Palmer. 2010. Chloride analysis of botanical samples by ICP- OES. J. Anal. At. Spectrom 25: 1946-1952.
White, P., and M. Broadley. 2001. Chloride in Soils and its Uptake and Movement within the
Plant: A Review. Ann. Bot.88: 967-988.
Yang, J., and R.W. Blanchar. 1993. Differentiating chloride susceptibility in soybean cultivars. Agron. J. 85: 880-885.
Yu, B.J., Y.L. Liu. 2003. Effects of salt stress on the metabolism of active oxygen in seedlings of annual halophyte Glycine soja. Acta Bot. Boreal.-Occident. Sin. 23: 18–22.
Zhu, J.K. 2001. Plant salt tolerance. Trends Plant Sci. 6: 66-71.
Zhu, J.K. 2002. Salt and drought stress signal transduction in plants. Annu. Rev. Plant Biol. 53:
247–273.
Zhu, J.K. 2003. Regulation of ion homeostasis under salt stress. Curr. Opin. Plant Biol. 6: 441– 445.
23
CHAPTER II. Identification of Quantitative Trait Loci in Soybean for Salt Tolerance
ABSTRACT
Soybean growth and yield is adversely affected by soil salinity. The identification tolerance genes that improve soybean performance in soils with problems of salinization is a very effective way to use and develop soybean genotypes with high salt tolerance response. Early studies have
revealed that salt tolerance in soybean is regulated by a single dominant gene, Ncl, locatedin
chromosome 3, mainly responsible for Cl- exclusion. Recently, additional studies have
repeatedly reported a major QTL associated with salt tolerance in chromosome 3 close to the markers Satt 255 and Sat_091, and other minor QTLs have been also reported. The main
objective of this study, was to identify/confirm QTL associated with salt tolerance using an F2:3
linkage mapping population from the cross Jake (salt tolerant) x Ozark (salt- sensitive). This population was screened in the greenhouse using 120 mM NaCl. After two weeks, leaf scorch score (LSS), percentage of dead plants (PDP), leaf chlorophyll, and leaf chloride content were measured. Genotyping was performed using SoySNP 6K chip. Two QTLs were found in this study, a major QTL on chromosome 3 (linkage group N) and a minor QTL on chromosome 19 (linkage group L). The QTL identified on chromosome 3, is located in the same genomic region previously reported. Four SNP markers were highly linked to this QTL mapped to chromosome 3. The SNP Gm03_41020834_T_C is associated with LSS, PDP, and leaf chlorophyll content explaining 37 to 48.9 % of the phenotypic variance; Gm03_40600088_A_G is associated with PDP and leaf chlorophyll accounting for 37% and 43.5% of the variation, respectively, and the markers Gm03_40270199_T_C and Gm03_40663609_G_A explained 41% to 43% of the leaf chloride variation. The new minor QTL identified on chromosome 19, is associated to leaf chlorophyll content and linked to the SNP markers Gm19_40508288_C_T and
24
Gm19_42246131_A_G, which explained approximately 5% of the phenotypic variation of the trait. The markers linked to the identified QTLs associated with the evaluated traits, can be of valuable use for future marker assisted selection.
25 INTRODUCTION
Soybean is a traditional cash crop cultivated in different types of environments being exposed to many biotic and abiotic stresses. Salt stress is considered a major limitation to soybean
production in several regions around the world, affecting all the crop development stages and
yield components. Sodium salts dominate in many saline soils around the world;Na+ and Cl- are
major ions responsible for salinization. Salt damage in soybean is expressed by the accumulation of chloride and other ions in stems and leaves causing toxicity, followed by the presence of leaf chlorosis and necrosis leading to a reduction in plant biomass. It has been reported that the
soybean salinity threshold is 5.0 dS m–1. Soybean yield is reduced up to 20 % and 56 % under a
soil electrical conductivity of 4.0 dS m–1 and 6.7 dS m–1, respectively (Lee et al., 2008; Katerji
et al., 2003).
Soybean germplasm displays a wide spectrum in the response of phenotypes to salt stress, suggesting that there is genetic diversity and natural variation of this crop to salt tolerance.
Several studies have reported U.S varieties and breeding lines to be chloride tolerant based on visual ratings and the measurement of leaf chloride content. A high correlation between low leaf scorch visual ratings and low leaf chloride accumulation has led to the use of the common
description of tolerant genotypes as chloride excluders (Lee et al., 2004). Chloride resistance in
soybean cultivars is controlled by the single dominant gene Ncl, identified by Abel (1969) in the
cultivar ‘Lee’ (CNS x S-100), and it has been confirmed that the cultivar S-100 is the source of the major chloride exclusion allele. Several research groups have mapped this QTL to the same region in chromosome 3 (linkage group N), using parents from both, cultivated and wild
26
the hypothesis that a conserved gene or several few genes control salt tolerance in diverse soybean germplasm.
Plant breeding is considered to be the major strategy to improve salt tolerance in soybean,
however, substantial effort is needed to achieve this goal due to the close linkage between abiotic
stress loci and undesirable traits (Phang et al., 2008; Wang et al., 2003). Several studies based on
shoot chloride accumulation have provided evidence to conclude that soybean genotypes may be dominated by a single or few major loci suggesting that salt tolerance is an inheritable qualitative trait. However, other studies have reported the existence of salt tolerance mechanisms regulated
by minor genes when soybean plants are rated on salt–induced chlorosis in leaves (Luo et al.,
2004). These variable results are probably associated with the genetic background of the parental germplasm selected and the use of different parameters for the evaluation of the salt stress
response (Phang et al., 2008).
The lack of salinity selection pressure in soybean (e.g. when plants are grown in soils with low salinity levels) can either cause no significant change in conserved salt tolerance genes, or produce some gene mutations, which eventually can reduce the function of the gene products
lowering salt tolerance (Qu et al., 2015). Additionally, salt tolerance genes may be lost after
following several recombination events through natural selection and domestication (Guan et al.,
2014 (a)).
Making use of soybean natural variation with the application of conventional breeding and marker assisted selection, it is possible to identify genes that improve soybean salt tolerance obtaining stable yields under saline conditions, and at the same time, gaining effectiveness in soil utilization for agriculture to make a contribution in present and future food security challenges.
27
The objective of this study was to identify and / or confirm QTL associated with salt tolerance using linkage mapping.
MATERIALS AND METHODS
Parental material and population development
The F1 segregating population Jake x Ozark was selected to perform this study. Jake is tolerant (excluder) and Ozark susceptible (includer) to salt stress. After subjecting these soybean genotypes to a 120 mM NaCl treatment during two weeks, Jake reached a maximum LSS (leaf
scorch score: 1–10 scale) of 4, while Ozark displayed a LSS of 7 (Ledesma et al., 2016). Jake
comes from the cross S94-1867 × ‘Anand’, tracing back to S-100, a salt-tolerant cultivar. Jake was developed and released by the University of Missouri in 2006 due to its high yield potential (50 bu/ac average) and broad nematode resistance (SCN, reniform, and southern root knot). It
has purple flowers, tawny pubescence, tan pods and black hilum seed (Shannon et al., 2007;
USDA–GRIN). Ozark (Holladay x Delta Pine DP 415) is a cultivar released by the University of Arkansas in 2004 with high yield potential (61.6 bu/ ac). It has purple flowers, grey pubescence,
tan pods and buff/imperfect black hilum (Chen et al., 2004; USDA–GRIN). The crosses for the
development of this population were made in the field in 2012, in the Agricultural Experiment Station of the University of Arkansas (Fayetteville, AR). The F1 plants were grown and
confirmed as true hybrids in 2013. The F2 generation was advanced in the greenhouse in 2014;
300 seeds were planted and seeds from 269 plants were harvested individually to create the F2:3
mapping population. Subsequently, the seed coming from each F2:3 family (line) was planted in
the greenhouse to be screened for salt tolerance in order to obtain the phenotypic data to perform the QTL analysis.
28 Phenotyping: Salt tolerance screening
The F2:3 families obtained from Jake x Ozark were screened for salt tolerance in the greenhouse.
The parents, two salt–tolerant (S–100, Lee 68) and two salt–sensitive (Clark, Dare) checks were included in the experiment. The checks were used to have an additional reference for the
initiation of salt response evaluation of the population. This experiment was performed in the Rosen Center at the University of Arkansas, maintaining plants under 14 hours of light /day at 25 ± 2 °C.
Twelve to ten seeds of each genotype were planted per pot (3.5 x 3.5 ") using sandy loam soil
(Table 1).After emergence, 8–10 seedlings per pot were maintained for further data collection.
Pots were placed in plastic trays (17 3/4" x 25 1/2" x 1") to be irrigated from the bottom (Figure 1). When plants reached stage V1 (first trifoliate leaf expansion) the salt treatment was initiated pouring inside the tray 4 L of 120 mM NaCl solution every day. The solution was left standing
for two hours daily and the treatment was applied during two weeks.Right after the 2-h
treatment, the solution was immediately removed from the trays and no other type of irrigation
was provided.The experiment was a split– plot design with two replications (2 pots per
treatment), where the main plot was salt level (NaCl 0, 120 mM) and the sub–plot the genotypes. This experiment was repeated to confirm results obtaining a total of four replications. Plants were fertilized once a week with the application of water–soluble fertilizer Miracle-Gro® All Purpose Plant Food (The Scotts Miracle-Gro Company, Marysville, Ohio) to avoid nutritional deficiencies following the manufacturer´s instructions. The fertilizer was dissolved in both, the saline solution used for the salt treatment application and the irrigation water for the control.