The stellar mass assembly of
galaxies in the Illustris simulation:
growth by mergers and the spatial
distribution of accreted stars
The Harvard community has made this
article openly available.
Please share
how
this access benefits you. Your story matters
Citation
Rodriguez-Gomez, Vicente, Annalisa Pillepich, Laura V. Sales, Shy
Genel, Mark Vogelsberger, Qirong Zhu, Sarah Wellons, et al. 2016.
“The Stellar Mass Assembly of Galaxies in the Illustris Simulation:
Growth by Mergers and the Spatial Distribution of Accreted Stars.”
Monthly Notices of the Royal Astronomical Society 458 (3) (February
26): 2371–2390. doi:10.1093/mnras/stw456.
Published Version
doi:10.1093/mnras/stw456
Citable link
http://nrs.harvard.edu/urn-3:HUL.InstRepos:30353760
Terms of Use
This article was downloaded from Harvard University’s DASH
repository, and is made available under the terms and conditions
applicable to Other Posted Material, as set forth at
http://
nrs.harvard.edu/urn-3:HUL.InstRepos:dash.current.terms-of-use#LAA
6Institute for Gravitation and the Cosmos, The Pennsylvania State University, University Park, PA 16802, USA 7Max-Planck-Institut f¨ur Astrophysik, Karl-Schwarzschild-Straße 1, D-85741 Garching bei M¨unchen, Germany 8TAPIR, Mailcode 350-17, California Institute of Technology, Pasadena, CA 91125, USA
9Heidelberg Institute for Theoretical Studies, Schloss-Wolfsbrunnenweg 35, D-69118 Heidelberg, Germany 10Zentrum f¨ur Astronomie der Universit¨at Heidelberg, ARI, M¨onchhofstr. 12-14, D-69120 Heidelberg, Germany 11Department of Astronomy, University of California, Berkeley, CA 94720, USA
Accepted 2016 February 23. Received 2016 February 23; in original form 2015 November 27
A B S T R A C T
We use the Illustris simulation to study the relative contributions ofin situstar formation and stellar accretion to the build-up of galaxies over an unprecedentedly wide range of masses (M∗ =109−1012M), galaxy types, environments, and assembly histories. We find that the ‘two-phase’ picture of galaxy formation predicted by some models is a good approximation only for the most massive galaxies in our simulation – namely, the stellar mass growth of galaxies below a few times 1011M is dominated byin situstar formation at all redshifts. The fraction of the total stellar mass of galaxies atz=0 contributed by accreted stars shows a strong dependence on galaxy stellar mass, ranging from about 10 per cent for Milky Way-sized galaxies to over 80 per cent forM∗≈1012Mobjects, yet with a large galaxy-to-galaxy variation. At a fixed stellar mass, elliptical galaxies and those formed at the centres of younger haloes exhibit larger fractions ofex situstars than disc-like galaxies and those formed in older haloes. On average,∼50 per cent of theex situstellar mass comes from major mergers (stellar mass ratioμ >1/4),∼20 per cent from minor mergers (1/10< μ <1/4),∼20 per cent from very minor mergers (μ <1/10), and∼10 per cent from stars that were stripped from surviving galaxies (e.g. flybys or ongoing mergers). These components are spatially segregated, within situstars dominating the innermost regions of galaxies, andex situstars being deposited at larger galactocentric distances in order of decreasing merger mass ratio.
Key words: methods: numerical – galaxies: formation – galaxies: haloes – galaxies: interac-tions – cosmology: theory.
1 I N T R O D U C T I O N
In thecold dark matter (CDM) cosmological model, structure forms hierarchically: galaxies grow by accreting smaller systems composed of both dark matter (DM) and baryons. However, the
E-mail:vrodriguez-gomez@cfa.harvard.edu
†Hubble fellow.
importance of mergers (as opposed to secular processes) in driving the growth of the stellar components of galaxies, as well as in deter-mining their resulting kinematic and chemical properties, are still the subject of significant discussion in the literature, both theoret-ically (e.g. Hopkins et al.2010c; De Lucia et al.2011; Sales et al.
2012; Zavala et al.2012; Fiacconi, Feldmann & Mayer2014) and observationally (e.g. Bundy, Treu & Ellis2007; Oesch et al.2010; L´opez-Sanjuan et al.2012). In particular, the scientific community has not yet come to an agreement in regards to the amount of stars
that were formedin situ(i.e. formed from accreted gas within the galaxy where they are currently found), relative to stars that were formedex situ(i.e. formed in other galaxies and subsequently ac-creted; e.g. Oser et al.2010; Lackner et al. 2012). Furthermore, theoretical predictions for the spatial distribution of accreted stars remains an ongoing effort (e.g. Deason et al.2013; Hirschmann et al.2015; Pillepich, Madau & Mayer2015) as a powerful means to explain many observed properties of stellar haloes (e.g. Deason, Belokurov & Evans2011; Pastorello et al.2014; Greene et al.2015). One of the first systematic studies of the stellar mass assembly of galaxies that used hydrodynamic simulations as the main tool was carried out by Oser et al. (2010), who performed zoom-in simulations of 39 haloes with virial masses between 7.0×10¹¹and
2.7×10¹³h−1M
, and used them to investigate galaxy formation by distinguishing stars that were formed in situfrom those that were accreted. They found that their simulated galaxies exhibit ‘two phases’ of stellar mass growth: an early stage ofin situstar formation untilz∼2, which resembles so-called ‘monolithic collapse’ models (e.g. Eggen, Lynden-Bell & Sandage 1962), followed by a dry merger-dominated stage with markedly smaller star formation rates. In general, Oser et al. (2010) found very highex situstellar mass fractions for all of the galaxies they studied, with values ranging from 60 to 80 per cent with increasing stellar mass. Similarly, Lack-ner et al. (2012) studied thein situandex situstellar populations of 611 galaxies formed in two hydrodynamic zoom-in simulations, one of them centred on a massive cluster, and the other one centred on a void. For galaxies with M∗≈1011M
, they found ex situ
stellar mass fractions which are lower by a factor of∼3 than those found by Oser et al. (2010), which implies that accreted stars are no longer the dominant stellar component for galaxies of this mass.
Similar studies have been carried out with semi-analytic models (SAMs) of galaxy formation (e.g. Guo & White2008; Jim´enez et al.
2011; Lee & Yi2013). In particular, Lee & Yi (2013) determined that theex situstellar mass fraction is a strong function of stellar mass, finding values of approximately 20, 40, and 70 per cent for galaxies in the mass ranges log(M∗/M)=10.5–11.0, 11.0–11.5, and 11.5–12.0, respectively. Lee & Yi (2013) also quantified the amount of merger-induced ‘bursty’ star formation, which they found to be negligible compared to quiescent, ‘disc-mode’ star formation, in agreement with Hopkins et al. (2010b). This is explained by the fact that most gas-rich mergers happen at high redshifts when galaxies are smaller, while recent mergers tend to be gas-poor and happen more rarely.
Investigating thein situandex situstellar components of simu-lated galaxies can provide important insights into galaxy formation and the effects from galaxy interactions. For instance, the trans-formation of disc to elliptical galaxies is believed to take place by the addition ofex situstars from dry mergers, which are deposited at large radii. The size evolution of massive, compact galaxies ob-served at z∼2 (e.g. Daddi et al.2005; Trujillo et al.2006; van Dokkum et al.2008; Damjanov et al.2009) provides an example of such transformation, since many of them are believed to eventually become the ‘cores’ of large, massive ellipticals in the local Uni-verse (e.g. Naab, Johansson & Ostriker2009; Feldmann et al.2010; Hopkins et al.2010a; van Dokkum et al.2010; Cimatti, Nipoti & Cassata2012; Oser et al.2012; Wellons et al.2016).
Other studies have focused on the stellar haloes around simu-lated galaxies, either using hydrodynamic simulations of large sam-ples of galaxies (Font et al.2011; McCarthy et al.2012; Pillepich et al.2014) or highly resolved individual galaxies (Abadi, Navarro & Steinmetz2006; Zolotov et al.2009, 2010; Tissera, White & Scannapieco2012; Dubois et al.2013; Tissera et al.2013,2014;
Pillepich et al. 2015; Hirschmann et al. 2015), or usingN-body simulations along with particle tagging techniques (Cooper et al.
2010,2013,2015; Rashkov et al.2012). Such theoretical predic-tions for the spatial distribution of in situand ex situ stars can be used to explain several observational features of stellar haloes at large galactocentric distances, such as metallicity and stellar age gradients, abundance ratios, kinematics and velocity anisotropy pro-files, or degree of substructure. With the advent of next-generation deep and wide-field surveys, it will become necessary to have reli-able theoretical predictions that will aid in guiding and explaining observations.
In this work, we provide a comprehensive view of the stellar mass assembly of galaxies using the Illustris simulation (Genel et al.2014; Vogelsberger et al. 2014a,b; Nelson et al. 2015), a hydrodynamic cosmological simulation carried out on a periodic box of∼106.5 Mpc per side, which features a realistic physical model (Vogelsberger et al.2013; Torrey et al.2014). Because of the wide range of stellar masses, environments, and spatial scales covered, the Illustris simulation presents a unique opportunity to study the assembly of the different stellar components of galaxies in a self-consistent, cosmological setting.
This paper is organized as follows. In Section 2 we describe the Illustris simulation, the merger trees, and the stellar particle clas-sification scheme. In Section 3 we define and quantify thespecific stellar mass accretion rate, for which we provide a fitting function that is accurate over a wide range of stellar masses, merger mass ratios, and redshifts. Theex situ stellar mass fractionis introduced in Section 4, including a discussion of its general trends atz=0 (Section 4.1), its correlation with galaxy properties such as stellar age, morphology and assembly history (Section 4.2), and its red-shift evolution (Section 4.3). In Section 5, we examine the spatial distribution ofex situstars and present a systematic study of the
normalized transition radius. Finally, we discuss our results and present our conclusions in Section 6.
2 M E T H O D O L O G Y
2.1 The Illustris simulation
Throughout this paper we use data from the Illustris Project (Genel et al.2014; Vogelsberger et al.2014a,b), a suite of hydrodynamic cosmological simulations of a periodic box with 106.5 Mpc on a side, carried out with the moving-mesh codeAREPO(Springel2010).
Illustris-1 (known hereafter astheIllustris simulation) follows the joint evolution of 18203 DM particles along with approximately
18203gas cells or stellar particles. Each DM particle has a mass of
6.26×10⁶M
, while the average mass of the baryonic elements is 1.26×10⁶M
. The gravitational softening for DM particles is 1.4 kpc in comoving coordinates, while for stellar particles this scale is held constant at 0.7 kpc in physical coordinates atz <1. The Illustris-2 and Illustris-3 simulations are lower resolution versions of Illustris-1, carried out with 2×9103and 2×4553resolution
elements, respectively.
The Illustris simulation features a galaxy formation model which includes star formation and evolution, primordial and metal-line cooling, chemical enrichment, gas recycling, and feedback from supernovae and supermassive black holes. This galaxy formation model is described in detail in Vogelsberger et al. (2013) and Tor-rey et al. (2014), where it is also shown to reproduce several key observables across different redshifts. The model has also been found to be in good agreement with a number of observables for which it was not tuned, including the column density distribution of
simulations, so that every FoF group is associated with onecentral SUBFINDhalo and possibly a family of satellite objects. Throughout this paper, FoF groups are referred to ashaloesandSUBFINDhaloes
assubhaloes, unless noted otherwise. Moreover, we define a galaxy as the baryonic component of aSUBFINDhalo (central or satellite)
withM∗>0. At any given time, stellar particles and gas elements belong to a given galaxy if they are gravitationally bound to such galaxy according to theSUBFINDalgorithm, regardless of their
dis-tance to the galactic centre. In all computations we will characterize galaxies according to their total stellar mass, rather than by using the stellar mass measured within some fiducial aperture such as twice the stellar half-mass radius.
The Illustris simulation was carried out with a CDM cos-mological model with parametersm = 0.2726, = 0.7274,
b=0.0456,σ8=0.809,ns=0.963, andh=0.704, in
agree-ment with the 9-yrWilkinson Microwave Anisotropy Proberesults (Hinshaw et al.2013).
2.2 Merger trees
Merger trees of the subhaloes have been constructed with the
SUBLINKalgorithm (Rodriguez-Gomez et al.2015), which proceeds in two main stages: (1) finding subhalo descendants, and (2) re-arranging this information in order to make it ‘usable’ for galaxy formation studies (i.e. constructing the merger trees). For the first stage, each subhalo from a given snapshot is assigned aunique descendantfrom the next snapshot by comparing particle IDs in a weighted fashion, assigning a higher priority to particles that are more tightly bound. In some special cases, a subhalo is allowed to ‘skip’ a snapshot when finding a descendant, which accounts for situations in which a small subhalo is temporarily ‘lost’ due to in-sufficient density contrast while it is traversing a larger structure. Once all descendants have been determined, thefirst progenitor
(also known as themain progenitor) is defined as the one with the ‘most massive history’ behind it (De Lucia & Blaizot2007). In this paper we make exclusive use of thebaryonicmerger trees, constructed by tracking only the stellar particles and star-forming gas cells of subhaloes. Differences with respect to theDM-only
merger trees and further details about the algorithm can be found in Rodriguez-Gomez et al. (2015), while a complete description of the data format is presented in Nelson et al. (2015).
2.3 Stellar particle classification
Although the merger trees by themselves are a very effective tool for studying galaxy formation and evolution, further insight can be
galaxiescategory if it has been stripped from the galaxy in which it formed and this galaxy has not merged with the galaxy where the particle is currently found. Otherwise, theex situstellar particle is classified asaccreted through mergers.
(iv)Merger mass ratio:For each stellar particle accreted through completed mergers, this is the stellar mass ratio of the merger in which the particle was accreted, measured at the moment when the galaxy in which the particle formed reaches its maximum stellar mass.
A stellar particle in thestripped from surviving galaxycategory must have been ‘captured’ during a flyby event or during a close pas-sage of an ongoing merger. We will not distinguish between these different scenarios, and we note that a stellar particle in this cate-gory at one time can eventually be reclassified asaccreted through mergersat a later time if the galaxy in which the stellar particle formed eventually merges with the galaxy where it is currently found.
We emphasize that the definitions ofin situandex situstars can vary substantially in the literature. As detailed in Section 2.1, stellar and gas elements are considered to belong to a given galaxy accord-ing to theSUBFINDalgorithm and its unbinding procedure. However, our classification scheme is based exclusively on the origin of the stellar particles, without additional considerations on the gas out of which the stars form, differently from other works. In fact, we note that the gas element progenitors ofin situstars of a given galaxy can have become bound to it either through smooth gas accretion on to the parent halo, via mergers, or through tidal and ram pressure stripping of gas from other nearby galaxies. In this work we do not distinguish between these gas progenitor channels. We also note that, in the case of central galaxies, ourex situcategory doesnot
include stars which formed in satellite galaxies but which have not been stripped. Therefore, ourex situstellar mass doesnotinclude satellite stellar mass.
Finally, we point out that the fraction of stars in Illustris which were not bound to anySUBFIND halo at formation (e.g. from gas
cells turning into stars along gas filaments or clumps outside any identified galaxy) is very small, namely 0.1 per cent atz=0. On the other hand,ex situstars in Illustris rarely accretesmoothlyinto their final host galaxy. We estimate that only 0.2–0.3 per cent of the
ex situstars have been accreted on to galaxies without being bound to anySUBFINDhalo, possibly having been kicked far away from
their birth sites as the result of a violent merger.
1In the case of multiple halo passages, this definition refers to thelasttime
2.4 The galaxy sample
We consider all galaxies from the Illustris simulation with stellar massesM∗>109M
, without imposing any further restrictions. This choice produces a sample of 29 203 objects atz=0, including both centrals and satellites (no distinction is made between the two classes except when explicitly stated). For some calculations in the next sections, results are shown for three stellar mass bins centred at 1010, 1011, and 1012 M
(in log-space), each with a full width equivalent to a factor of 101/3 ≈ 2.15, and therefore containing
3829, 804, and 37 galaxies, respectively. 3 T H E S P E C I F I C S T E L L A R M A S S AC C R E T I O N R AT E
Before exploring thein situandex situ(accreted) stellar compo-nents of galaxies in Section 4, we dedicate the current section to quantifying theinstantaneousrate of mass growth due to stellar accretion. In particular, we introduce thespecific stellar mass ac-cretion rate, which measures the average amount of stellar mass that a galaxy accretes per unit time through mergers with other galaxies. The specific stellar mass accretion rate is an interesting quantity on its own, as it can be directly compared to the specific star formation rate (e.g. Behroozi, Wechsler & Conroy 2013a; Moster, Naab & White2013), the specific DM accretion rate (e.g. Genel et al.2014, fig. 13), or the cosmological gas accretion rate (e.g. Kereˇs et al.
2005; Dekel et al.2009; Nelson et al.2013), in order to evaluate the importance of dissipative processes with respect to galaxy for-mation. In addition, the specific stellar mass accretion rate acts as a link between the galaxy–galaxy merger rate studied in Rodriguez-Gomez et al. (2015) and theex situstellar mass fraction that will be presented in Section 4.
In the current section we define the specific stellar mass accre-tion rate, discuss some of its basic properties, and provide a fitting function that is accurate over a wide range of stellar masses, merger mass ratios, and redshifts. We also evaluate the importance of merg-ers relative to star formation when building up the stellar mass of a galaxy. Throughout this section, our galaxy sample is extended down to a minimum stellar mass of 108M
. 3.1 Definitions
Following the merger analysis presented in Rodriguez-Gomez et al. (2015), we define galaxy mergers in the following way. If a galaxy in the merger trees hasNpdirect progenitors, we countNp−1 mergers, occurring between the first progenitor and each of the other ones. For each merger, we denote the stellar masses of the descendant, primary progenitor and secondary progenitor byM0,M1andM2, respectively. Both progenitor massesM1andM2are measured at the time whenM2reaches its maximum value, which we refer to astmax. The corresponding merger mass ratio is given byμ=M2/M1. In the case of multiple mergers (Np>2), the primary progenitor is always the same object, but its stellar massM1is generally measured at a different time for each merger, i.e. at the time whenM2reaches its maximum value.
With the definitions above, we can introduce thespecific stellar mass accretion rate, which measures theaverageamount of stellar mass accreted by a single ‘descendant’ galaxy during a time interval dt, normalized by the stellar mass of the descendant galaxyM0, and considering only mergers with stellar mass ratios inside the range (μ,μ +dμ). The specific stellar mass accretion rate, which we
denote by ˙macc,∗, is a function of descendant stellar massM0, merger mass ratioμ, and redshiftz:
˙ macc,∗(M0, μ, z)= 1 M0 dMacc dμdt, (1) where Macc= Np−1 k=1 M2,k
is the total stellar mass contributed by the secondary progenitors2
of the mergers that took place in the appropriate (M0,μ,z) interval. Each stellar mass contributionM2,k(corresponding to a merger of
stellar mass ratio μk = M2,k/M1) is also measured attmax. The
specific stellar mass accretion rate is very closely related to the galaxy–galaxy merger rate: it is also a global, mean quantity, giving the average accretion rateper galaxy, and is also given in units of Gyr−1. We note that the specific stellar mass accretion rate given by
equation (1) is mathematically similar to the dimensionless growth rate studied by Guo & White (2008), with the important difference that in their work the time interval dtis always normalized by the age of the Universet(z). Additionally, our specific stellar mass accretion rate is given as a function of stellar mass ratioμand can therefore be integrated over anyμ-interval in order to evaluate the importance of major mergers, minor mergers, or all mergers (i.e. by integrating fromμ=0 to 1).
In practice, we approximate equation (1) by going through the following five steps: (1) defining small three-dimensional bins in (M0,μ,z)-space (yet large enough to contain at least five merger events each), (2) adding the stellar mass contributions (from the secondary progenitors) of all mergers that take place in each bin, (3) dividing by the number of descendant galaxies in each bin, (4) dividing by the descendant stellar mass M0, and finally (5) dividing by the appropriate time and merger mass ratio intervals (corresponding to the edges of the selected bins).
3.2 Connection with the galaxy merger rate
The merger rate ofDM haloeshas been systematically studied in previous work usingN-body simulations of structure formation in the Universe, with different predictions showing agreement within a factor of∼1.5 (Fakhouri & Ma2008; Genel et al.2009,2010; Fakhouri, Ma & Boylan-Kolchin2010). Furthermore, the merger rate ofgalaxiescan be estimated using semi-empirical methods, which combine results fromN-body simulations with observational constraints (e.g. Stewart et al.2009; Hopkins et al.2010c), and it has been recently determined to great accuracy using cosmological hydrodynamic simulations in Rodriguez-Gomez et al. (2015). In the latter study, the galaxy–galaxy merger rate was found to have a relatively simple mathematical form as a function of stellar mass, merger mass ratio, and redshift.
In principle, it seems possible to calculate the specific stellar mass accretion rate based on the galaxy–galaxy merger rate alone. In prac-tice, however, this is complicated by the fact that the mass ratio of a merger must be measured at an earlier time than when the merger actually happens, such astmax, i.e. the time when the secondary pro-genitor reaches its maximum stellar mass (see Rodriguez-Gomez et al.2015, for a discussion). Betweentmaxand the moment when the
2More precisely, we add min (M
1,M2) for each merger, consistent with
the condition that the mass ratioμshould always be smaller than one (see Rodriguez-Gomez et al.2015, for a discussion).
Figure 1. The specific stellar mass accretion rate as a function of merger mass ratioμ, shown for different descendant massesM0. Each mass bin is a factor
of∼2 wide. The left-hand, centre, and right-hand panels correspond to redshift bins centred aroundz=0.1, 1, and 2, respectively. In all panels, the shaded regions correspond to the Poisson noise in the number of mergers, while the black dashed line represents the fitting function from Table1. Top: the differential specific stellar mass accretion rate, as given by equation (1). Bottom: the cumulative specific stellar mass accretion rate, i.e. integrated with respect to merger mass ratioμso that eachy-value represents the growth rate due to all mergers with mass ratios greater than the value given on thex-axis (note that in this case the dashed black line is actually the integral of the fitting function with respect toμ, and therefore it is not a direct fit to the data). For reference, the growth rates due to major (μ >1/4) and major+minor (μ >1/10) mergers are given by the intersections with the vertical blue and cyan dotted lines, respectively. The fact that each curve in the lower panels asymptotes very quickly towards low merger mass ratios demonstrates the decreased importance of mergers with
μ1/100 with respect to galaxy growth, despite the fact that we can actually resolve mergers with even smaller mass ratios.
merger finally takes place, one or both progenitors can undergo sig-nificant star formation or have interactions with a third object. This implies that the stellar mass conservation relationM0=M1+M2is not satisfied in general. Therefore, it becomes necessary to measure the specific stellar mass accretion rate directly from the simulation, rather than attempting to derive it from the merger rate.
If we assume that the stellar mass conservation relation
M0=M1+M2 is satisfied, then the specific stellar mass accre-tion rate (equaaccre-tion 1) and the galaxy–galaxy merger rate would be related by 1 M0 dMacc dμdt = μ 1+μ dNmergers dμdt . (2)
Essentially, the only difference between the two quantities would be a factor ofμ/(1+μ). In practice, however, and given that stellar mass is generally not conserved during a merger, we find that a ‘conversion’ factor ofμ/(1+3μ) results in a better description of the data (see Section 3.4). This empirical correction down-weighs the major-merger end in the right-hand side of equation (2) by a factor of∼2, suggesting that in this regime the primary progenitor
can grow by a similar amount between tmaxand the time of the merger, as a consequence ofin situstar formation and mergers with additional objects.
3.3 Results
Fig.1shows the specific stellar mass accretion rate as a function of merger mass ratioμ, calculated for different descendant masses
M0. The panels from left to right correspond to redshift bins centred aroundz=0.1, 1, and 2. The upper panels show the specific stellar mass accretion rate in its most general form, as given by equation (1), while the lower panels show thecumulativemass accretion rate, integrated for mass ratios larger than the value on thex-axis. For convenience, the specific stellar mass accretion rates from major (μ >1/4) and major+minor (μ >1/10) mergers are indicated with blue and cyan vertical dotted lines, respectively. The shaded regions represent the uncertainty arising from Poisson noise in the number of mergers, while the black dashed line shows predictions from the fitting function presented in Table 1and discussed in Section 3.4.
Table 1. Fitting function and best-fitting parameters for the specific stellar mass accretion rate. See Section 3.4 for details.
Definition m˙acc,∗(M0, μ, z)= M01 ddMaccμdt
Units (Gyr−1) A(z) M0 1010M α(z) 1+M0M 0 δ(z) μβ(z)+γlog10 M0 1010 M μ 1+3μ , where Fitting function A(z)=A0(1+z)η, α(z)=α0(1+z)α1, β(z)=β0(1+z)β1, δ(z)=δ0(1+z)δ1, andM0=2×10¹¹Mis fixed. log10(A0/Gyr−1) −2.0252±0.0060 η 1.5996±0.0146 α0 0.2013±0.0050 α1 −1.4888±0.0540 β0 −0.9964±0.0030 β1 0.1177±0.0030 γ −0.0656±0.0015 δ0 0.6949±0.0311 δ1 −1.7581±0.0675 χ2 red 1.21
The lower panels of Fig.1demonstrate the rapidly decreasing importance of mergers with respect to mass ratio. Although we are able to resolve mergers with mass ratiosμ∼10−4and below (and
find them to be quite numerous), the cumulative effect from mergers with stellar mass ratios belowμ∼1/100 is essentially negligible with respect to stellar mass growth, as can be seen from the fact that the curves in the lower panels of Fig.1quickly asymptote towards low values ofμ.
In Fig.2we show thecumulative(with respect to mass ratio) specific stellar mass accretion rate as a function of descendant stellar massM0. The blue, cyan, and green lines show the contributions from major, major + minor, and all mergers, respectively. The panels from left to right correspond to redshift bins centred around
z=0.1, 1, and 2. As before, the shaded regions correspond to the Poisson noise in the number of mergers, while the dashed black lines represent the model from Table1. For comparison purposes, the median specific star formation rate is shown in red, along with its associated 1σscatter.
It is clear from Figs1and2that the contribution to stellar mass growth due to different types of mergers is 50–60 per cent from ma-jor mergers, 20–25 per cent from minor mergers, and 20–25 per cent from very minor mergers. Fig. 2also shows that the growth of galaxies below a certain stellar mass is dominated byin situstar formation, while more massive galaxies above this threshold grow primarily byex situcontributions. The value of this transition point decreases from∼5×10¹¹M
atz≈1 to 1–2×10¹¹M
atz
≈0.1. Our results are in broad agreement with observational work by Robotham et al. (2014), who found a transition between the two modes of stellar mass growth at M∗≈7×10¹⁰M
. In general, these trends are explained by the fact that massive galaxies have mergers more frequently than smaller galaxies, while at the same time their star formation rate is substantially suppressed by AGN feedback (see Sparre et al.2015, for a discussion of star formation and its scatter in Illustris).
Comparing with Guo & White (2008), we find that the spe-cific stellar mass accretion rate has a relatively weak dependence
on stellar mass and a strong redshift evolution, whereas Guo & White found precisely the opposite: a strong dependence on stel-lar mass and a weak redshift evolution. In other words, we find that the mathematical form of the specific growth rate of galaxies contributed by mergers is more similar to that of DM haloes than previously thought. Given that the stellar mass accretion rate is closely related to the galaxy–galaxy merger rate, these contrasting trends originate from the analogous qualitative differences found in the galaxy–galaxy merger rates from Guo & White (2008) and Rodriguez-Gomez et al. (2015), as discussed in the latter work. In spite of these qualitatively different trends with mass and redshift, it is noteworthy that Guo & White (2008) found that the instantaneous growth rates due to mergers and star formation become comparable atz=0 for galaxies withM∗=4−8×10¹⁰M
, within a factor of∼2 from the value found in this work.
Despite the mathematical similarities in the merger rates of galax-ies and DM haloes, it is interesting to note an important difference between their overall growth mechanisms. Since star formation ‘quenching’ has no analogue in the case of DM haloes, the rela-tive contributions from the two main channels of DM halo growth – mergers and smooth accretion – are independent of halo mass (approximately 60 and 40 per cent, respectively; e.g. Genel et al.
2010; Fakhouri et al.2010). On the other hand, the importance of mergers forgalaxygrowth changes substantially with stellar mass, from being statistically negligible in the case of small galaxies to becoming the dominant growth mechanism for galaxies with stellar masses above a few times 1011M
.
Finally, Fig. 2can be readily used to make predictions about the instantaneous rate of stellar mass growth by mergers and its importance relative to dissipative processes. For example, the left-hand panel from Fig. 2shows that the stellar mass of a Milky Way-sized galaxy withM∗≈6×10¹⁰M
(McMillan2011) grows by∼1 per cent per Gyr due to mergers (of any mass ratio) atz≈ 0.1, but at the same time grows by∼10 per cent per Gyr due toin situstar formation, which is the dominating factor for galaxies of this mass.
Figure 2. The cumulative (with respect to merger mass ratioμ) specific stellar mass accretion rate as a function of descendant massM0, shown for major
(blue,μ >1/4), major+minor (cyan,μ >1/10), and all mergers (green). The left-hand, centre, and right-hand panels correspond to redshift bins centred aroundz=0.1, 1, and 2, respectively. In all panels, the shaded regions correspond to the Poisson noise in the number of mergers, while the black dashed line represents the fitting function from Table1, integrated over the appropriate range in merger mass ratioμ. The red line shows the median specific star formation rate for each mass bin, with the shaded region around it indicating the range between the 16th and 84th percentiles, or 1σ. This figure shows that the specific stellar mass accretion rate has a relatively strong dependence on stellar mass, and also that the stellar mass growth of most galaxies is dominated byin situstar formation rather than stellar accretion from mergers, except for sufficiently massive galaxies atz1.
3.4 A fitting function
In Table 1, we provide a fitting function for the specific stellar mass accretion rate of galaxies as a function of descendant mass
M0, merger mass ratio μ, and redshiftz, along with the corre-sponding best-fitting parameters. The fit was carried out by mini-mizing a chi-squared merit function in log-space using a Markov chain Monte Carlo (MCMC) algorithm.3The data points were
gen-erated by creating three-dimensional bins inM0, μ, and 1 + z with bin widths equal to factors of 2.0, 1.2, and 1.1, respec-tively, and subsequently calculating the specific stellar mass ac-cretion rate inside each bin. Only mergers withM0> 108M
,
μ >1/1000, andz <4 were considered in the fit. The param-eter uncertainties are defined as the range between the 16th and 84th percentiles of the marginal probability distributions produced by the MCMC algorithm, which are found to be approximately Gaussian. The best-fitting parameters yield a reduced chi-squared statistic of 1.21, which indicates that the fit is a good descrip-tion of the data, while keeping the number of free parameters relatively low.
We point out that the specific stellar mass accretion rate of galax-ies has a much stronger mass dependence than the specific DM accretion rate of DM haloes. In particular, Fakhouri et al. (2010) and Genel et al. (2010) determined that the specific growth rate of DM haloes is proportional toM0.1
0 andM 0.15
0 , respectively,
inde-pendently of redshift (in this caseM0denotes the descendanthalo
mass), whereas the fitting function given in Table1implies that the specific stellar mass accretion rate of galaxies atz=0 is pro-portional toMα0
0 ≈M 0.2
0 at low masses and toM
α0+δ0 0 ≈M
0.9 0 at
high masses. This strong, positive trend with mass, along with the fact that the specific star formation rate is a decreasing function of stellar mass, implies that the ‘importance’ of mergers with respect to galaxy growth increases rapidly with stellar mass, as we quantify in the next section.
3http://dan.iel.fm/emcee/current/(Foreman-Mackey et al.2013).
4 T H E EX SITUS T E L L A R M A S S F R AC T I O N In the previous section, we have presented predictions from the Illustris simulation on theinstantaneousstellar mass accretion rates of galaxies. In the present section we address the related question of how much stellar mass do galaxies assemble by stellar accretion
across their lifetimes. Specifically, in the following paragraphs we present results on theex situ stellar mass fraction, i.e. the fraction of the total stellar mass of a galaxy which is contributed by stars that formed in other galaxies and were subsequently accreted as a consequence of the hierarchical growth of structures. We analyse its dependence on stellar mass, redshift, and a selection of galaxy properties, as well as in terms of the different stellar ‘components’ that originated from different kinds of accretion events.
4.1 General trends
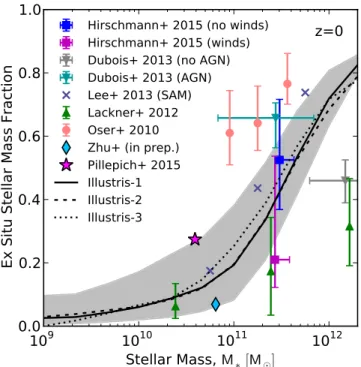
Fig.3shows theex situstellar mass fraction of galaxies atz=0 as a function of their stellar massM∗, measured for the three differ-ent resolutions of the Illustris simulation: Illustris-1 (solid black), Illustris-2 (dashed black), and Illustris-3 (dotted black), of which Illustris-1 has the highest resolution. These three black curves repre-sent medianex situfractions for galaxies binned inM∗and obtained with the stellar particle classification technique given in Section 2.3. The grey shaded region shows the corresponding 1σscatter at a fixed stellar mass.
Theex situstellar mass fraction evidently has a strong dependence on stellar mass, ranging from ∼10 per cent for Milky Way-like galaxies to over 80 per cent for some of the most massive galaxies in the simulation. This trend is a consequence of both the increased rate of stellar mass accretion as well as the lower specific star formation rate displayed by more massive galaxies at later times, as summarized in Fig.2. The magnitude of the scatter is significant, reaching a full width of∼0.3 for galaxies withM∗≈1011M
. For these galaxies theex situfraction can vary from 8 to about 38 per cent of their total stellar mass within the 1σscatter, while for Milky Way-like galaxies theex situfraction ranges from 5 to 30 per cent of the total stellar mass. This is the result of the wide range of merging
Figure 3. The fraction of accreted stellar mass (with respect to the total) for galaxies atz=0, shown as a function of stellar massM∗. The solid, dashed, and dotted black lines show the median results from the Illustris simulation carried out at different resolutions, with Illustris-1 being the highest resolution one. The grey shaded region represents the range between the 16th and 84th percentiles, or 1σ, while the different symbols show theex situstellar mass fraction as obtained in other theoretical models, both semi-analytic and hydrodynamic. The Illustris results here, as in the remainder of the paper unless otherwise stated, are obtained by adopting the stellar particle classification technique presented in Section 2.3. This figure shows that our determination of theex situstellar mass fraction is well converged with resolution and also reduces the apparent tension among predictions from different theoretical models.
histories and halo formation times that are naturally produced by a cosmological simulation, as we will explicitly demonstrate in Section 4.2.
The Illustris predictions at different resolutions are in excellent agreement with each other, which demonstrates that our classifica-tion scheme forex situparticles, as well as the underlying physics that determines the stellar mass assembly of galaxies, are well con-verged with numerical resolution. The different symbols in Fig.3
show predictions from previous theoretical works, both from SAMs of galaxy formation (Lee & Yi2013) and from hydrodynamic zoom-in simulations (Oser et al.2010; Lackner et al.2012; Dubois et al.
2013; Hirschmann et al.2015; Pillepich et al.2015; Zhu et al., in preparation). The error bars from Oser et al. (2010) and Lackner et al. (2012) show interquartile ranges divided into three stellar mass bins. The data points from Hirschmann et al. (2015) indicate the median and 1σ scatter of the 10 galaxies considered in their study, showing results from their model both with strong galactic winds (magenta) and without them (blue). Similarly, the data points from Dubois et al. (2013) show the median and 1σ scatter of their six simulated galaxies, including results from their model both with AGN feedback (cyan) and without it (grey). We find that theex situ
stellar mass fraction in the Illustris simulation lies close to the ‘me-dian’ prediction from all the other studies, reducing the apparent tension among them.
We caution, however, that a direct comparison among the differ-ent studies shown in Fig.3is not a priori fully consistent, given
the possibly different operational definitions adopted for theex situ
classification (e.g. including or excluding satellites) and for the galaxy stellar mass itself. For example, the results from Pillepich et al. (2015) are reported by excluding the contribution from satel-lites to the totalex situfraction (i.e. by applying a correction to their nominalex situfraction based on information provided in the same paper), while we note that the results by Oser et al. (2010) and Dubois et al. (2013) are given as a function of the stellar mass measured within 0.1Rvirand are not corrected here. It is worthwhile to note that, if in Illustris we measured theex situfraction not across the wholeSUBFINDhalo (as done throughout) but within a sphere of
twice the stellar half-mass radius, theex situfractions would be lower at all masses, by about 5 per cent at the high-mass end and by∼30–40 per cent for less massive galaxies.
In Fig.4, we further expand on various techniques to measure the
ex situfraction and on the origin of the accreted stars. The top-left panel of Fig.4compares different ways of calculating theex situ
stellar mass fraction: the solid black line, obtained with the stellar particle classification scheme described in Section 2.3 and already shown in Fig.3, is compared to the dotted curves corresponding to calculations carried out with the merger trees alone. In the latter case, theex situstellar mass is obtained by finding all the mergers a given galaxy has ever had and adding up the stellar masses of the so-identified secondary progenitors. There is some freedom of choice regarding the stage of the merger at which the progenitor masses are measured: the dotted blue, dotted red, and dotted green lines show the effects from taking the progenitor masses attmax(when the maximum stellar mass is reached), at infall4(right before the
progenitor joins the same parent FoF group as the main progenitor), and right before the merger, respectively.
In previous work (Rodriguez-Gomez et al. 2015, fig. 5), we showed that the maximum stellar mass of galaxies is usually reached
after infall. Indeed, for satellites merging with central galaxies atz=0, we found thattmax andtinfall typically happen 2–3 Gyr and∼6 Gyrbeforethe time of the merger, respectively. In the same study we recommended measuring merger stellar mass ratios at
tmax, and indeed here we find this definition to be the one that gets closer to the more refined method of classifying stellar particles individually. However, even with this definition, the calculation is neglecting the contribution from stars that were stripped from surviving galaxies, which cannot be taken into account using the merger trees alone. However, if this missing component is included by adopting information from the stellar particle classification tech-nique (dashed blue), the calculation becomes fully consistent with the more complete estimate given by the solid black line.
The other two definitions – measuring progenitor masses at infall (dotted red) or right before the merger (dotted green) – tend to un-derestimate theex situstellar mass fraction, although for different physical reasons. If the stellar mass of a progenitor is measured at infall, then the correspondingex situstellar mass cannot include the contribution from stars formed in galaxiesafterinfall. This results in an underestimate of theex situstellar mass by∼50 per cent, with some galaxy-to-galaxy variation, suggesting that a significant amount of stellar mass can form in satellites also while they are orbiting the gravitational potential of a more massive companion. On the other hand, if the stellar mass of a progenitor is taken right before the moment of the final coalescence, the measurement cannot take into account the stellar material that has already been stripped
4If the secondary progenitor itself undergoes additional mergers with other
Figure 4. Theex situstellar mass fraction of galaxies atz=0 as a function of stellar massM∗, calculated with different methods or showing different particle selections. In all panels except the bottom-right one, the solid black curve is the medianex situfraction from Fig.3, with the grey shaded region representing the range between the 16th and 84th percentiles. Top left: the different lines show different methods of calculating theex situstellar mass fraction. All curves except the black one represent calculations carried out with the merger trees alone (instead of the stellar particle classification technique) by identifying all mergers and adding the masses of the secondary progenitors right before the merger (dotted green), at infall (dotted red), and attmax(dotted blue). The latter
gets close to the prediction from the stellar particle classification scheme, but is missing the contribution from stars that were stripped from surviving galaxies, which cannot be determined with the merger trees alone. If this missing component is added by adopting information from the stellar particle classification scheme (dashed blue), the two calculations become consistent with each other. On the other hand, the dotted red and dotted green lines both underestimate the ex situstellar mass fraction, in the former case because stars formed after infall are not taken into account and in the latter because satellites have already lost a substantial amount of stellar mass due to stripping. Top right: the two coloured lines show the amount ofex situstellar mass that was formed before and after infall (as defined in Section 2.3). Bottom: the contributions to theex situstellar mass of galaxies atz=0 from stars with different accretion origins, shown as a function of stellar massM∗. The different colours correspond to stars accreted in major mergers (blue,μ >1/4), minor mergers (cyan, 1/10< μ <1/4), very minor mergers (green,μ <1/10), or stripped from surviving galaxies (magenta). The latter component includes stellar mass transferred during flyby events or during the first passages of an ongoing merger. Bottom left: the dashed and solid lines correspond to mean and median quantities, respectively. Bottom right: the average fraction ofex situstellar mass contributed by stars with different accretion origins (to be compared with the dashed lines from the left-hand panel).
from the progenitor, both tidally and numerically (e.g. due to insuf-ficient density contrast), therefore also underestimating the fraction of stars accreted from other galaxies.
The top-right panel of Fig.4further illustrates in physical terms the reasons why the different methods presented in the top-left panel give different estimates of the accreted stellar fraction. Here we show the amount ofex situstellar mass that was formedbefore infall
andafter infall, as defined in Section 2.3. About 60 per cent of the
ex situstellar mass inM∗≈1010.5M
galaxies was formed after
infall, i.e. in satellite galaxies orbiting Milky Way-like hosts, but this fraction becomes smaller as the mass of the host increases, most likely as a consequence of the stronger environmental effects exerted by more massive hosts (see Sales et al.2015, for a discussion). We note that the ‘before infall’ component from the top-right panel is closely related to the dotted red line from the top-left panel, the latter of which is an approximation of theex situfraction obtained by adding the infall masses of all progenitors recursively (as mentioned above). The small differences between the two calculations can be
attributed to the fact that the merger-tree-only estimate cannot take into account the ‘mass transfer’ that results from stripping during galaxy interactions which are not recorded as mergers.
Finally, as mentioned in Section 2.3, for eachex situstellar par-ticle we are able to determine the stellar mass ratio of the merger in which it was accreted. This allows us to evaluate the relative contributions from major (μ >1/4), minor (1/10< μ <1/4), and very minor (μ <1/10) mergers to the final stellar mass of a galaxy, as well as the contribution from stars in thestripped from surviv-ing galaxiescategory – namely, stars that have been stripped from a galaxy which is either in the process of merging with the descendant host or is undergoing a flyby passage. The contributions from these different components of theex situstellar mass atz=0 are plotted as a function of stellar mass in the bottom row of Fig.4. The blue, cyan, and green colours represent major, minor, and very minor mergers, while magenta corresponds to stars that were stripped from surviving galaxies, and black shows the total fraction of
ex situstellar mass.
The bottom-left panel shows that the mean (dashed) and median (solid) stellar mass fractions can be very different from each other. In general, given the discrete nature of mergers, the mean is larger than the median. This happens because very few galaxies at low masses have an important contribution from major or minor mergers, but the few of them that have recently undergone such mergers tend to have significantly higherex situfractions, raising the value of the mean. The two measures converge as we consider galaxies of higher stellar masses, whose growth is dominated by accretion.
The bottom-right panel of Fig.4shows theaverage(hence the mean) contributions to the ex situ stellar mass from the ex situ
components shown on the left-hand panel. These fractions are ap-proximately constant with respect to stellar mass, with their trends and values being consistent with the results from Section 3. It is worth mentioning that the near mass-independence of the relative contributions to thegalaxy merger ratefrom mergers with different mass ratios (Rodriguez-Gomez et al.2015, fig. 7) leads to a specific stellar mass accretion rate with the same property (Fig.2), which in turn results in anex situstellar mass fraction atz=0 for which the same statement is approximately valid. Consequently, the blue, cyan and green lines used in Rodriguez-Gomez et al. (2015) as well as in this work, where we examine more complex quantities than the galaxy merger rate, always appear to be roughly parallel to each other.
4.2 Dependence on galaxy type and halo assembly history We have just shown in Section 4.1 that theex situ stellar mass fraction has a very large scatter at a fixed stellar mass. In the current section, we investigate the origin of such scatter by considering all galaxies atz=0 with stellar masses>109M
and separating them – at a fixed stellar mass – according to different quantities, which can be grouped into three broad categories: stellar properties, morphology, and halo assembly.
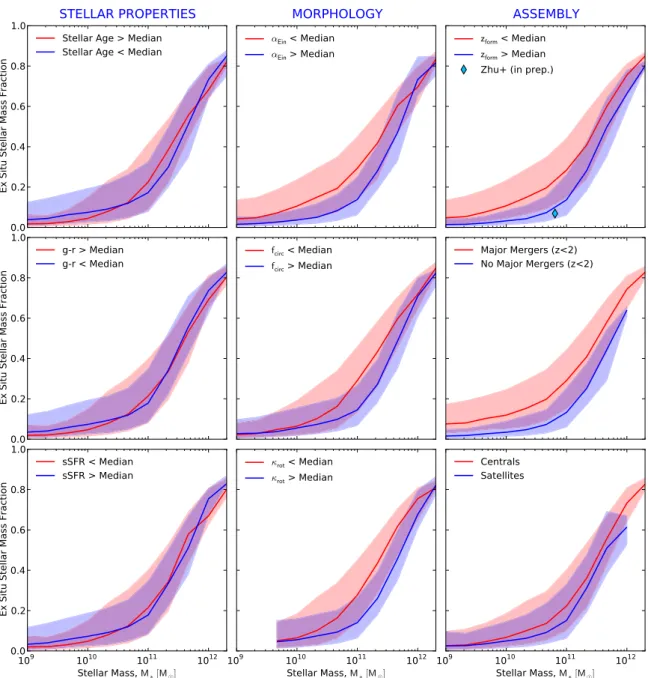
Fig.5shows theex situstellar mass fraction as a function of stellar mass, showing two components (red and blue) correspond-ing to galaxy populations separated by the criteria indicated in the labels. In particular, when separating galaxies by the median value of a given galaxy property (e.g. stellar age), the median is calculated within each mass bin, rather than for the full galaxy population. The shaded regions show the 16th to 84th percentile ranges. The left-hand, centre, and right-hand panels correspond to galaxies separated by stellar properties, morphology, and assembly history, respectively. Below is a brief description of the quantities
used to classify galaxies, along with some observations about the implications from Fig.5.
4.2.1 Stellar properties
We consider the correlation between theex situstellar mass fraction and galactic stellar properties (at a fixed stellar mass) by measuring the following quantities.
(i)Stellar age:The stellar mass-weighted median age of all the stellar particles in the subhalo.
(ii) g–r:A measure of galaxy colour. Thegandrmagnitudes are based on the sum of the luminosities of all the stellar particles in the subhalo (see Nelson et al.2015, for more details).
(iii)sSFR: The specific star formation rate, defined as the star formation rate of all the gas cells in the subhalo, divided by the total stellar mass.
In general, once the galaxy stellar mass is fixed, theex situstellar mass fraction shows a very weak, if not null, secondary dependence on the stellar properties described above. We find the same result when separating galaxies by their cold gas fraction (not shown).
4.2.2 Morphology
We consider the correlation of theex situstellar mass fraction with galactic morphology by using the following calculated parameters. (i)αEin: The ‘α’ exponent of an Einasto profile fitted to the stel-larcontent of each subhalo. The fit was carried out by maximizing the log-likelihood that the stellar particles are drawn from a spheri-cally symmetric probability distribution proportional to an Einasto profile, which is given by
ρ(r)=ρ−2exp −2 α r r−2 α −1 , (3)
wherer−2is the radius at which the logarithmic slope of the profile
becomes−2, andρ−2is the density atr=r−2. Only stellar particles
within twice the stellar half-mass radius were considered for the fit. An Einasto profile is mathematically similar to a S´ersic profile, which is typically used to fit observations of surface brightness pro-files. However, we point out thatαEinis inversely proportional to the S´ersic indexn, so thatαEin<Median (αEin>Median) corresponds to early-type (late-type) galaxies.
(ii) fcirc: The fraction of ‘disc’ stars in the subhalo, defined as those with >0.7, where the ‘orbital circularity’ parameter
=Jz/J(E) of a star is the ratio between its specific angular mo-mentumJzand the maximum specific angular momentum possible at the specific binding energyE (Abadi et al.2003; Marinacci, Pakmor & Springel2014). Thez-direction corresponds to the total angular momentum of the stars in the subhalo. All stellar particles within 10 times the stellar half-mass radius were considered (see Nelson et al.2015, table C2, for more details). Genel et al. (2015) found the scaling relations of Illustris galaxies would remain ap-proximately unchanged if only particles within 5 times the stellar half-mass radius were considered instead.
(iii)κrot: The fraction of kinetic energy that is invested in ordered rotation, defined in Sales et al. (2012) as
κrot= Krot K = 1 K 1 2 Jz R 2 . (4)
Figure 5. The medianex situstellar mass fraction as a function of stellar massM∗, calculated for galaxies atz=0. The red and blue lines show the correlation (at a fixed stellar mass) with respect to various galaxy properties, which are divided into three broad categories: stellar properties (left), morphology (middle), and halo assembly (right). These galaxy properties are described in detail in Section 4.2. The shaded regions indicate the 16th to 84th percentile ranges. The blue diamond in the upper-right panel corresponds to the Milky Way-like galaxy studied in Zhu et al. (in preparation), which has a relatively early formation time.
In this case thez-direction coincides with the angular momentum of the stellar content of the subhalo. The sum was carried out over all stellar particles within twice the stellar half-mass radius.
The panels from the middle column of Fig. 5 show that the
ex situstellar mass fraction is correlated with morphology. At a fixed stellar mass, spheroidal galaxies (red lines) have a higher accreted fraction relative to their disc-like counterparts (shown in blue), although the scatter is large. Observationally, this result is supported by D’Souza et al. (2014), who found that galaxies with high concentration have higher fractions of accreted material than their low-concentration counterparts (at a fixed stellar mass). We note, however, that when using kinematic morphologies (middle and bottom panels) this separation becomes very weak for Milky Way-sized galaxies, and in fact completely disappears atM∗∼1010M
,
in good agreement with previous results (Sales et al.2012). The significant overlap in the fraction of accreted stars for disc- and spheroid-dominated galaxies suggests that mergers alone cannot be the only driver of galaxy morphology.
4.2.3 Assembly
Finally, we characterize the assembly of the underlying DM haloes with the following information.
(i)zform: The redshift at which thetotal massof the subhalo in question reachedhalf of its maximum value. The maximum total mass is not necessarily attained atz=0, especially in the case of satellites. In order to smooth out short-term noise fluctuations in the mass of the subhalo, we fit a seventh-order polynomial to the
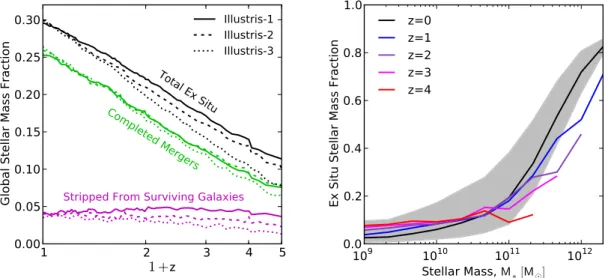
Figure 6. Redshift evolution of theex situstellar mass fraction. Left: the fraction ofex situstars across the whole Illustris volume as a function of redshift, obtained by summing over all galaxy stellar masses (black lines). The green and magenta curves denote the contributions from stars that were accreted via completed mergers (of any mass ratio) and from those that were stripped from surviving galaxies, respectively. The solid, dashed, and dotted lines correspond to the Illustris-1, 2, and 3 simulations, of which Illustris-1 has the highest resolution. Right: theex situstellar mass fraction as a function of galaxy stellar mass, shown at different redshifts. The black line corresponds toz=0 and is shown for reference (it is identical to the solid black line in Figs3and4), while the coloured lines show theex situstellar mass fraction atz=1, 2, 3, and 4.
total mass history of the subhalo. An alternative method consists in convolving the mass history with a median box filter of full width equivalent to five snapshots (Bray et al.2016). We find that these methods are in good agreement with each other. We caution thatzform is referred to ashalo formation timeorhalo formation redshift, even though the calculation is carried out for the corresponding subhalo (i.e.SUBFINDhalo) of each galaxy.
(ii)Major mergers sincez= 2:Mergers are identified as de-scribed in Rodriguez-Gomez et al. (2015): the stellar mass ratio of each merger is taken attmax(the time when the secondary pro-genitor reaches its maximum stellar mass) and it is checked that each merger has a well-defined ‘infall’ moment. The merger itself is considered to take place at the time of the final coalescence.
(iii)Central/satellite status:As determined by theSUBFIND
algo-rithm (see Section 2.1 for more details).
Theex situstellar mass fraction shows a strong correlation with halo formation time (parametrized by zform) and merging history (given by the number of major mergers sincez=2). This means that galaxies inside haloes that assembled late and galaxies with vio-lent merging histories have relatively higherex situstellar mass frac-tions. There is also a noticeable trend with respect to central/satellite status, but the differences are smaller because not all satellites have been equally subjected to the environmental effects, especially those which entered their parent halo at later times.
An interesting special case is the Milky Way-like galaxy de-scribed in Marinacci et al. (2014), which is shown in Zhu et al. (in preparation) to have a relatively lowex situstellar mass fraction, around 7 per cent (upper-right panel from Fig.5). Their simula-tion uses the same hydrodynamic code and physical model as those used in Illustris. Additionally, the merger trees and the stellar par-ticle classification scheme employed by them are identical to the ones used in this work. Therefore, the low ex situ stellar mass fraction found in their study can only be attributed to scatter: con-sistently with the findings presented so far, the simulated halo from Marinacci et al. (2014) has a relatively quiet merging history and
is also found to have assembled very early on, compared to other Illustris galaxies of similar mass (Zhu et al., in preparation).
Finally, we note that we also examined the dependence of theex situstellar mass fraction on galaxy overdensity (not shown), using a definition based on the distance to the fifth nearest neighbour with an
r-band magnitude brighter than−19.5 (Vogelsberger et al.2014a), but found no significant correlation. This null result is in agreement with Lackner et al. (2012), who compared theex situstellar mass fractions of galaxies in void and cluster environments, and also found no significant difference between the two populations. 4.3 Redshift evolution
We find that the fraction of the total stellar mass that is classified as
ex situin the whole Illustris volume increases monotonically with time, reaching 17 per cent atz=2 and 30 per cent atz=0. This means that the majority of the stars found in galaxies today have been formedin situ, and this holds true at all available redshifts. We show this in the left-hand panel of Fig.6, where the black curves denote the global ex situfraction (obtained by summing the contributions from all galaxies) as a function of redshift. The green curves show the contribution from the subset ofex situstars which were accreted via completed mergers (of any mass ratio), while the magenta curves indicate the contribution from stars that were stripped from surviving galaxies. The solid, dashed, and dotted lines represent the three different resolutions of Illustris, of which Illustris-1 is the highest. While the lower resolution runs are well consistent with the Illustris-1 results atz=0 (in agreement with Fig.3), they underperform at higher redshifts when mergers are more frequent, since the lack of resolution limits the time during which two (or more) objects that are undergoing a merger can be resolved as separate entities, underestimating the number of surviving galaxies at any given time.
When considering the redshift evolution of theex situstellar mass fraction as a function of mass (right-hand panel of Fig.6), we find that theex situstellar mass fraction is an increasing function of cosmic time for galaxies aboveM∗≈1011M
Figure 7. The median stellar mass history of galaxies selected atz=0 and tracked back in time using the merger trees. The left-hand, centre, and right-hand panels correspond toz=0 stellar mass bins centred at 1010, 1011, and 1012M
, respectively (each mass bin is a factor of∼2 wide). Each individual stellar mass has been normalized by the stellar mass of the corresponding descendant atz=0. The dot–dashed black line shows the evolution of the total stellar mass, while the solid red and solid black lines show the contributions from stars that were formedin situandex situ, respectively. The shaded regions indicate the 16th to 84th percentile ranges. The bottom panels show the evolution of the median ‘instantaneous’ex situstellar mass fraction, which corresponds to the ratio between the solid and dot–dashed black lines from the upper panels. We note that the so-called two-phase picture of galaxy formation only happens for the galaxies in our most massive bin.
time for galaxies belowM∗≈1010M
, while galaxies in the inter-mediate range (1010–1011 M
) show little evolution with redshift. As we have seen in Fig.2, these opposing trends can be understood by a cessation ofin situstar formation at low redshifts in the most massive galaxies, and a decrease in the specific mass growth by accretion at low redshifts for dwarf galaxies. We note, however, that these redshift trends cannot be applied to individual galaxies, but only to galaxy populations selected at a constant stellar mass across different redshifts (see Torrey et al.2015, for an observation-ally motivated discussion on matching galaxy populations across different epochs). In the following paragraphs we investigate the redshift evolution of theex situstellar mass fraction for individual galaxies (rather than temporally ‘disconnected’ galaxy populations) by following them in time using the merger trees.
The upper panels from Fig.7show the (normalized) stellar mass histories of galaxies selected atz= 0 and tracked back in time using the merger trees, showing the relative contributions of stars that were formedin situ(red) andex situ(black), along with the evolution of the total stellar mass (dot–dashed black). The panels from left to right correspond to galaxies withz=0 stellar masses of approximately 1010, 1011, and 1012 M
, respectively (each mass bin is a factor of∼2 wide). The lower panels from Fig.7show that the ‘instantaneous’ fraction ofex situstellar mass (given by the ratio between the solid and dot–dashed black lines from the upper panels) displays different redshift evolution trends for galaxies of different masses. For galaxies in the low-mass bin, theex situ frac-tion is approximately constant with redshift, while for galaxies in the medium-mass (high-mass) bin theex situfraction is found to mildly (strongly) increase with cosmic time.
As pointed out before, the stellar content of most galaxies is usually dominated by in situ star formation. However, for the galaxies in our most massive bin (Fig.7, right) there is a clear ‘crossover’ point at z 1, where the in situ and ex situ stel-lar components become comparable. We note that although this crossover between the two components has been presented before
(Oser et al.2010, fig. 8), we find that it only happens for galaxies in our most massive bin, whereas Oser et al. observed a transition for all of the galaxies they studied, with halo masses ranging from 7.0×10¹¹to 2.7×10¹³h−1M
(stellar masses between 4×10¹⁰
and 4×10¹¹h−1M
). This implies that the ‘two-phase’ picture of galaxy formation put forward by Oser et al. (2010) is only a good description for the most massive galaxies in our simulation, which reach stellar masses of∼1012 M
atz=0. These differ-ences can be partially attributed to the star formation and feedback prescriptions used by Oser et al., which resulted in very efficient star formation at early times and a large frequency of spheroidal systems with old stellar populations at later times.
The increased importance ofin situ star formation relative to stellar accretion that we have found for most galaxies in our sam-ple is in qualitative agreement with results from semi-empirical methods (Moster et al.2013, fig. 8), as well as with hydrodynamic simulations of individual disc galaxies (e.g. Pillepich et al.2015). Furthermore, our results are in broad agreement with recent work by Vulcani et al. (2016), who used observations of ultramassive galax-ies betweenz=0.2 and 2 to study the growth of galaxies withz=0 descendants withM∗>1011.8M
, which roughly corresponds to our most massive bin (M∗≈1012 M
). Vulcani et al. found that the growth of massive galaxies is dominated byin situstar forma-tion atz∼2, both star formation and mergers at 1< z <2, and mergers alone atz <1. We caution, however, that such observa-tional estimates of galaxy growth are sensitive to the assumptions used to link progenitors and descendants across cosmic time, which is a non-trivial task (Behroozi et al.2013b; Torrey et al.2015). 5 T H E S PAT I A L D I S T R I B U T I O N O F EX SITU
S TA R S
We have mentioned in Section 4.1 that the fraction of accreted stars measured within a sphere of twice the stellar half-mass radius is smaller than the corresponding fraction measured across the whole