Bus Passenger Origin-Destination Estimation and Travel Behavior Using Automated Data Collection Systems in London, UK
by Wei Wang B.S. in Transportation Engineering Southeast University Nanjing, China (2007) ARCHIVES
Submitted to the Department of Civil and Environmental Engineering in partial fulfillment of the requirements for the degree of
Master of Science in Transportation at the
Massachusetts Institute of Technology June 2010
MASSACHUC OINSITUTE
OF TECHNOLOGY
JUL 15 2010
LIBRARIES@ 2010 Massachusetts Institute of Technology. All Rights Reserved. Author
Department of Civil and Environmental Engineering May 24, 2010 C e rtified by ... ...
Nigel H.M. Wilson Professor of Civil and Environmental Engineering Chair, Master of Science in Transportation Program Thesis Supervisor C ertified by...
=
:p... John P. Attanucci Research Associate of Civil and Environmental E ineering-T Supervisor
A ccepted by...
Professor Daniele Veneziano Chairman, Departmental Committee for Graduate Students
Bus Passenger Origin-Destination Estimation and Travel Behavior Using Automated Data Collection Systems in London, UK
by Wei Wang
Submitted to the Department of Civil and Environmental Engineering On May 24, 2010 in Partial Fulfillment of the
Requirements for the Degree of Master of Science in Transportation
ABSTRACT
This research explores the application of archived data from Automatic Data Collection Systems (ADCS) to transportation planning with a focus on bus passenger Origin-Destination (OD) inferences at the bus-route level and on travel behavior, using London as an example. This research demonstrates the feasibility and ease of applying the trip-chaining method to infer bus passengers' boarding and alighting locations, and validates the results by comparing them with the Bus Passenger Origin and Destination (BODS) survey data in London. With the inferred OD matrices, the variations of weekday and weekend bus route OD patterns over a two-week period are examined for planning purposes. Given these variations, reliance on ADCS can provide transit planners with more comprehensive, reliable and correct information for service planning than traditional manual surveys.
Moreover, while interchange conditions and performance are considered important inputs for public transit planning, collecting such data has not been easy. Based on the inferred OD matrices and the Automatic Vehicle Location (AVL) data, alighting times for bus passengers can also be estimated. As a result, bus journey stages can easily be linked to form complete journeys based on the difference between the subsequent trip's boarding time and the previous trip's alighting time for each bus passenger. By comparing the interchange time and the connecting bus route's headway, this research also provides a way to evaluate connecting bus services and bus
passengers' interchange patterns.
Finally, this research can be expanded to the full bus network and other travel modes, opening the door to developing more comprehensive data bases for use in intermodal network planning.
Thesis Supervisor: Nigel H.M. Wilson
Title: Professor of Civil and Environmental Engineering Thesis Supervisor: John P. Attanucci
Acknowledgments
I would like to thank Prof. Nigel Wilson and Mr. John Attanucci for their guidance, support and attention to detail during my two-year graduate study at MIT. Through working with them, I benefit a lot not only on research skills and aptitudes but also on their industriousness and self-discipline. I like the weekly Wednesday afternoon meeting, when we three sat in Nigel's office discussing the research work. It is a time of wisdom and innovation, which motivates me to move further.
I am grateful to the staff at Transport for London (TfL), especially Rosa McShane, John Barry, Daly Aiden, Lisa Labrousse and H6lne Bataille for providing the great support for this research. The two-month summer intern in TfL provided me invaluable field experiences in the operation of public transit. Thank you!
My officemates, Mr. Frumin and Mr. Ehrlich as well as Jinhua provided indispensable technical assistance. My best friends, Wow Fred Webb, Rizard, Candy Gaga, Ehrlich Boy, Frudog Cookie Monster, Jerato, Tony Iron Man, Hulian, Alburg, David Uniman and BRT expert Harvey have brought me all the great happiness and made my life in the US & A and in 123 & 5 more diversified and colorful. Thank you, my dearest friends!
I also would like to thank Ginny for all the help during my two-year study here. I still save the special One-day Trip Guidance from London Booklet for Winnie from you, Ginny. That is the best booklet I have ever got!
Special thanks to MIT Writing Center teacher Ms. Elizabeth Fox for helping me with the writing and for mentoring me during the past three months. I am so lucky to
have such a great friend and mentor like you!
Most importantly, I would like to thank my parents and my sister: their support, encouragement, patience and love make me who I am and help me go through all the challenges. My parents have supported me unconditionally since I went to college. My dear mother, who is a brave and warm-hearted woman, has set up a model for me to follow for the rest of my life. I love you Mommy! And I know "Impossible is Nothing!"
Table of Contents List of T ables ...- .. ---...--- 9 List of F igures ...---... 11 1 Introduction ... 13 1.1 Motivation ... ...13 1.2 R esearch O bjectives... 16 1.3 Research Approach ... .. 16
1.4 Overview of London's Bus Network and Service Planning ... 16
1.5 T hesis O rganization ... 18
2 Origin-Destination Estimation Methodology ... 20
2.1 Previous Research on OD Estimation using ADCS Archived Data ... 20
2.1.1 OD Estimation with Both Entry and Exit Locations Recorded ... 21
2.1.2 OD Estimation with Entry-Only Boarding Locations Recorded...21
2.1.3 OD Estimation with Neither Entry Nor Exit Locations Recorded...22
2.2 General Methodology to Infer Transit Passenger Origins and Destinations ... 25
2.2.1 A DC S Data Preparation ... 25
2 .2 .2 O rigins Inference ... . . 27
2.2.3 D estination Inference ... 28
2 .3 S u m m a ry ... 2 9 3 London Case Study: Origin-Destination Inference ... 30
3.1 TfL ADCS ...-- ... 30
3.1.1 Understanding Data Quality and Characteristics... 30
3 .2 O rigin Infe re nce ... . 34
3.2.1 U nderlying A ssum ptions... 34
3.2.2 Process of O rigin Inference ... 37
3.2.3 O rigin Inference R esults ... 37
3.2.4 Adjustment for Terminal Stops ... 41
3.3 D estination Inference ... 42
3.3.1 Look-up Table G eneration ... 42
3.3.2 Destination Inference for Each Passenger Trip ... 43
3 .4 S u m m a ry ... ... 4 7
4 Origin-Destination Inference Validation ... 49
4.1 Comparison of BODS, ETM and Oyster Data for all Surveyed Trips...49
4.1.1 Aggregate Comparison between BODS, ETM and Oyster for all Surveyed T rip s ... 4 9 4.1.2 Trip Level Comparison between BODS, ETM and Oyster... 51
4 .1.3 S um m a ry ... . 5 3 4.2 Comparison of Boarding Locations between BODS and Oyster Datasets ... 54
4.3 Comparison of Alighting Locations between BODS and Oyster Datasets...59
4 .4 S u m m a ry ... 6 2 5 Application of the Inferred Origin-Destination Matrices ... 63
5.1 D aily R idership V ariation ... 63
5.1.1 Oyster and non-Oyster ridership based on ETM data ... 63
5.1.2 Daily ridership variations for each bus trip ... ... 67
5 .2 D aily Lo ad P rofile s .. ... ... ... ... 7 1 5.2.1 Expansion process for BODS... 71
5.2.2 Expansion process for Oyster data ... 71
5 .2 .3 Load profiles ... . . 73
5.3 Passenger Trip D istances... 80
5.4 Interchange Time Analysis ... ... ... 81
5 .4 .1 P rio r W o rk ... . . 8 2 5.4 .2 M ethodology ... . . 85
5.4.3 Case Study of Interchange Time Analysis in London ... 85
5.5 Subsequent Travel Behavior for Bus Passengers ... 94
5 .6 S um m a ry ... . ... 9 8 6 Conclusions and Recommendations ... 99
6.1 S um m ary of Key Results ... 99
6.1.1 Feasibility and practicality of applying the OD inference method for London b u s e s ... 1 0 0 6.1.2 Variations of daily ridership and travel pattern ... 100
6 .2 R eco m m e ndations...10 1 6.2.1 Implement the proposed methodology to infer bus passenger OD matrices 101
6.2.2 Improve the temporal precision of recorded Oyster transactions ... 101
6.2.3 Consistent stop naming between BODS and iBus ... 101
6.2.4 More complete and accurate iBus information ... 102
6.3 Potential Further Research...103
R E F E R E N C E S ... 10 5 Appendix A: OD Inference Rates...107
Appendix B: Validation of OD Inferences...115
Appendix C: Aggregate Ridership Comparison ... 122
List of Tables
Table 3-1: Destination inference results for the BODS survey day...45
Table 3-2: Invalid O D pair analysis ... 46
Table 3-3: Two week OD inference results (Route W4)... 46
Table 3-4: Origin and destination inference results* ... 47
Table 4-1: Aggregate ridership comparison between BODS, ETM and Oyster Datasets ... 5 0 Table 4-2: Origin inference rates for the selected routes on their survey days ... 55
Table 4-3: Summary of boardings from BODS and Oyster (Route 185) ... 55
Table 4-4: Summary of boardings from BODS and Oyster datasets (Route 307)...56
Table 4-5: Destination inference rates for the selected routes on their survey days...59
Table 5-1: Ridership comparison for Route 185 ... 73
Table 5-2: Ridership comparison for Route 307 ... 74
Table 5-3: Average distance traveled along Route 70 (kilometers) ... 81
Table 5-4: Median interchange time ... 89
Table 5-5: Travel modes of subsequent linked trips for passengers on Route 185 ... 97
List of Figures
Figure 2-1: The Alighting Location Estimation Model for "Normal" and "Last" Trips
(T re p a nie r 2 0 0 7 ) ... 2 2
Figure 2-2: Combining AFC with AVL to infer the boarding stop (Zhao 2006) ... 23
Figure 2-3: Network level OD matrix (Cui 2006) ... 25
Figure 2-4: Process for destination inference ... 29
Figure 3-1: The effectiveness of "previous stop" rule (W4) ... 35
Figure 3-2: The effectiveness of "next stop" rule (W4)... 35
Figure 3-3: "Closest Stop" rule for origin inference ... 36
Figure 3-4: The effectiveness of "closest stop" rule (W4)... 36
Figure 3-5: Route schematic for W4 ... 38
Figure 3-6: Dummy stop for "Hail-and-Ride" segments on Route W4...39
Figure 3-7: Route schematic for 70... 40
Figure 3-8: Relationship between inferred "seed" OD matrix and the original data...48
Figure 4-1: Aggregate ridership comparison between BODS, ETM and Oyster...50
Figure 4-2: BODS-ETM-Oyster ridership comparison for Route 329...52
Figure 4-3: Boarding location comparison for Route 185...56
Figure 4-4: Boarding location comparison for Route 307...58
Figure 4-5: Alighting location comparison for Route 185 ... 60
Figure 5-1: Daily ridership variation for Route W4 ... 64
Figure 5-2: Daily ridership variation for Route 70...65
Figure 5-3: Daily ridership variation for Route 185... 65
Figure 5-4: Daily ridership variation for Route 307...66
Figure 5-5: Daily ridership variation for Route 329... 67
Figure 5-6: Daily variation in trip-level ridership for Route 70 ... 68
Figure 5-7: Average trip-level ridership for Route 70 during PM Peak...69
Figure 5-8: Daily variation in trip-level ridership for Route 185 ... 70
Figure 5-9: Load profile for Route 185 in AM Peak...75
Figure 5-10: Daily load variation along Route W4 during AM Peak ... 77
Figure 5-11: Load profiles on Route 185 in AM Peak ... 78
Figure 5-12: Load profiles for Route 307 ... 80
Figure 5-13: Histogram of successive boarding times difference (Hofmann & Mahony, 2 0 0 5 )...8 3 Figure 5-14: CDF of interchange times for return trips on Route 185 ... 87
Figure 5-15: CDF of bus-to-bus interchange times for passengers on Route 185...88
Figure 5-16: Connecting route headway distribution for passengers from Route 185 ...88
1 Introduction
The ever-increasing usage of the Automatic Data Collection Systems (ADCS) generates new transport data that can be used by transport service providers for a range of applications. These data were previously too expensive to obtain by traditional manual surveys. This research is undertaken to assess the feasibility and ease of using this ADCS archived data to provide useful information for decision-making by different departments within a transit agency.
Specially, this research explores the application of the ADCS archived data to public transport planning with a focus on bus passenger Origin-Destination (OD) inference at the bus-route level and on travel behavior, using London as an example. To infer the OD matrices for bus passenger trips, the characteristics of available ADCS archived data are examined. With the estimated OD matrices and the Automatic Vehicle Location (AVL) data, the alighting time for bus passengers can also be estimated. Then, bus journey stages can easily be linked to form complete journeys based on the difference between the next trip's boarding time and the previous trip's alighting time. Thus interchange patterns and other travel behaviors can also be studied. This research can also be expanded to the full bus network and other travel modes, opening the door to providing comprehensive database for more effective support of intermodal network planning. This chapter presents the research motivation, objectives, and approach, as well as an overview of London's bus network planning process.
1.1 Motivation
Public transportation systems provide people with communal transportation services, generally by bus or rail. Public transportation provides access to those who cannot or do not choose to drive, congestion reduction by providing a high-quality alternative to the automobile, and land use influence by allowing agglomeration of economic activity in cities. Finally, as an environmentally friendly alternative, public transportation has obtained great support from the government and the public.
There are high public expectations for the services that public transportation systems can provide. In order to provide better service needed to attract choice riders
and generate a greater return for the public support as well as maintain success in the future, public transit agencies have gone through organizational changes, including greater operating staff responsibility, accountability and increased customer orientation. They have also implemented new technologies for better information provision and more effective real-time operations control as well as improved vehicle design.
For the provision of better services, service planning is one of the most important support functions. Major planning elements include data collection, problem identification, ridership estimation and other variables. For service design, most agencies have guidelines for scheduling based on maximum (policy) headway and maximum passenger crowding. When transit agencies set the standards, peak load at the maximum load point is particularly important for ensuring that adequate capacity is provided. Research shows that increased understanding of passenger behavior can be used to make gains in efficiency, customer service and cost reduction for the agencies involved. Among them, the passenger OD matrix provides a basis for evaluating the performance of individual bus routes and the bus network as a whole. Reliably estimated OD matrices can be used in service planning, in operations analysis, in before-and-after impact analysis, and in service management.
Traditionally, transit agencies obtain OD matrices by conducting occasional on-board passenger surveys and using various techniques to expand the survey results based on manual boarding and alighting counts at stops. However, such passenger surveys are expensive to conduct and therefore are extremely infrequent. The sample size will also be limited due to the high cost of data collection.
In the past decade, Automatic Fare Collection (AFC) systems have become increasingly popular as they provide an efficient and cost-saving alternative to traditional manual fare collection methods. Some research has pointed out and evaluated the potential benefits of using AFC data for transportation planning, especially using the AFC data to obtain OD matrices for performance measurement and service planning (Barry et al., 2002). Due to the limitation that most AFC systems record the passenger trip boarding location coarsely at the bus-route level, it is still difficult to get detailed information about where individual passengers board a bus. Integration of the AFC system archived data, which includes characteristics of each fare card transaction, with
the AVL system data, which includes vehicle locations, offers a solution by matching the vehicle location information against the passenger trip information to help transit planners to infer the individual passenger's boarding bus stop (Zhao 2006).
Research has also been conducted on utilizing the ADCS archived data to infer the destination for an individual bus passenger's trip. Current system-wide or even single route level OD matrices are usually not available in most transit agencies. One of the primary advantages of using the ADCS archived data is to make these OD matrices
available to transit agencies. Also, in terms of reduced cost, larger sample size, larger time span coverage and a more automated system, the ADCS provide a good way to obtain daily OD matrices (for both weekdays and weekends), which is very helpful for public transportation network planning, especially for large, complex and dynamic networks like London's.
Interchange planning has long been recognized as a key component of public transportation planning. It reduces operational costs and supports efficient route planning in exchange for passengers' inconvenience. Making interchanges less burdensome must be a critical consideration in public transportation planning. Acquiring interchange data is very difficult as it adds more possible variables to the data collection efforts. Before the advent of the AFC system, the only way to get such data was through a manual survey of passengers about their itineraries. Some research has been performed on bus passenger interchange behavior using AFC data to link journey stages into complete journeys based on elapsed time thresholds. Nonetheless, this kind of research work has usually been limited because the spatial scale of bus boarding locations was only at the bus route level and there was no information on the bus passengers' alighting times or locations. Therefore, the interchange time defined in such research is actually the bus journey time plus the "true" interchange time. However, with the implementation of the AVL system, the location and time for each bus can be obtained, which provides a new way to infer individual bus passenger's boarding and alighting locations as well as alighting times. Hence interchange times can be estimated more accurately by calculating the difference between the alighting time on the previous
1.2 Research Objectives
The objective of this research is to make the best use of the ADCS archived data to support public transportation service planning. This goal will be achieved by assessing the feasibility and ease of using these ADCS archived data to provide useful information for decision-making in service planning using London as an example. The following questions will be addressed:
1. What kind of passenger behavior information can be obtained from the ADCS to use in public transportation service planning?
2. How can this information be used for the decision-making within transit agencies? Answering these questions will provide a better understanding of what ADCS can contribute to service planning by making more effective use of the available data. This research can also be expanded to apply to any transit agencies with similar ADCS. 1.3 Research Approach
In order to test the hypothesis that the ADCS archived data can be used to improve bus service planning, two data samples are used: (a) a 100% sample of AFC data for a sample of Transport for London (TfL) bus routes for two weeks, and (b) a 100% sample of AVL data for two weeks for all the routes that are parallel to or intersect the selected bus routes. The general approach is based on constructing trip chains for individual bus passengers. The methodology used here involves data cleaning and integration, inference of bus passenger trip boarding location, and inference of bus passenger trip alighting location and time, as well as interchange pattern analysis. The inference
results are further validated by comparing with the BODS manual survey data.
Since this thesis applies this methodology to the bus network in London, the next section presents a brief overview of London Buses network and service planning.
1.4 Overview of London's Bus Network and Service Planning
This thesis uses the London bus network as a basis for analyzing the application of the ADCS archived data to bus network planning with a focus on OD estimation and travel behavior, especially the interchange pattern analysis. This section discusses the basic characteristics of the London bus network and service planning.
London has one of the largest bus networks in the world, with over 6 million passengers transported on its 700 routes every day. In a report by the Mayor of London (2009), it is reported that "Bus usage is growing at its fastest rate since 1946. More than two billion passenger trips were made on London's fleet of more than 8,000 buses in the year to March 2009. The number of operated kilometers has also risen to 478 million, the highest since 1957".
Every 5-7 years, the Bus passenger Origin and Destination Survey (BODS) is conducted by TfL for each bus route in London. This survey obtains detailed information about passenger travel patterns, including the number of people boarding and alighting at each stop, the purpose of travel, the location of the boarding and alighting of each journey, and how passengers get to the bus boarding stop and from the bus alighting stop to their final destination. Expansion factors are added to account for non-returned survey cards and non-surveyed bus trips. An automated database (BODS database) is compiled with the survey results. The automated reports from the BODS database include boardings, alightings, and loads at each stop (or stop zone) along a route, as well as its parallel routes. BODS can be considered the primary data system used by Network Development in TfL because it provides the detailed, disaggregate passenger demand information that is necessary for bus network planning in London. A major limitation of this type of survey is that it records passenger travel for only one day per route. Recognizing the substantial network growth and changes, supplementary data from other sources are needed for network planning. Moreover, although surveyed passengers are asked for their ultimate origin and destination in addition to their travel on the route itself, this information is rarely transferred from the paper surveys into the BODS database and is therefore not readily available to network planners.
In addition to BODS survey data, London bus planners also get timely route-level passenger demand information from Electronic Ticketing Machine (ETM) transactions, which are downloaded from bus garages to the Bus Contracts Management System (BCMS). One drawback of this data, however, is that it only records aggregate ridership for each bus trip, while detailed information for each bus passenger trip cannot be obtained directly.
The Oyster smartcard was launched in London by TfL in December 2003 as a new ticketing medium. It is now accepted on the Underground, buses, the Docklands Light Rail (DLR), Tramlink, and National Rail stations. Though this data source has not yet been fully used by London bus network planners, the Oyster Smart Card data is readily available. It has large sample sizes and offers a network perspective. Bagchi and White (2004) summarize the key benefits of Oyster Cards in terms of planning as:
(1) much larger volumes of individual passenger trip data than it is
possible to get from manual surveys;
(2) ability to link individual passenger trips to individual cards or travelers; (3) continuous trip data covering longer time periods than manual surveys; (4) proportion of different types of customers using transit services. (2004) In addition, using the Oyster smartcard data enables one to determine linked trips and the ultimate OD flows across the network. This process can be repeated on a day-by-day basis to assess variability in trips and get more accurate estimates of ridership for specific days of the week and times of the year. It provides an easier and more reliable way to get more detailed passenger behavior information than manual survey data, which can help transit agencies to make gains in efficiency and reduce cost.
1.5 Thesis Organization
This rest of thesis is organized into five chapters. Chapter 2 proposes the general transit passenger OD inference methodology as one way to obtain useful information from the ADCS archived data for public transportation planning. This chapter begins with a
review of the previous research on inferring OD matrices using the ADCS archived data from transit networks. It further discusses the general OD inference methodology that can be applied to any transit agencies having similar ADC systems.
Chapter 3 presents the bus passenger OD inference results for the selected bus routes in London. It begins with a detailed description of the data sources that are used in this research. Then it moves to the inference results for the selected bus routes in
London. Some data issues related to terminal bus stops during the OD inference process are discussed, followed by a recommended resolution.
Chapter 4 focuses on the validation of the OD inference methodology that we apply to London buses. It starts with a primary analysis of BODS, ETM and Oyster smartcard data for all the surveyed bus trips, after which, origin and destination inference results are validated separately by comparison with BODS data for all the surveyed bus trips. This chapter concludes that the inferred OD matrices are generally valid and provide more detailed information for a wide range of operating conditions.
Further applications of this methodology and the inferred OD matrices are discussed in Chapter 5, which includes daily ridership, load profile and trip distance distribution for weekdays and weekends for different time periods and different directions for the selected bus routes. A further study of interchange times and the subsequent travel behaviors of bus passengers are also presented.
Chapter 6 concludes with a summary of the key findings, discussion of possible improvements to enhance current practices, and suggestions for future research.
2 Origin-Destination Estimation Methodology
This chapter describes the proposed Origin-Destination estimation methodology in detail. It begins with a review of the previous research on using Automated Data Collection Systems (ADCS) to create Origin-Destination (OD) matrices for public transportation networks. Then it discusses the characteristics of ADCS archived data required in order to infer transit passengers' origins and destinations, followed by a description of the general OD estimation methodology that can be applied to any transit
agencies with similar ADCS.
2.1 Previous Research on OD Estimation using ADCS Archived Data
Cui (2006) has summarized OD estimation techniques using manually collected data. Basically, the OD matrix can be obtained either by surveys or by techniques which combine various sources of data. The increasing use of ADCS provides a cost-effective way to collect data that goes far beyond the scope of data collected from manual surveys. Although most ADCS are designed to support specific narrow functions, the resulting data can be applied to areas far beyond their design purposes. This thesis illustrates the potential for the ADCS to provide transit agencies with new, richer data sources at low marginal cost. For the purposes of this thesis, only the most important attributes of ADCS archived data are described in detail; for example, the recorded location and time of each farecard transaction, which offer a new way to infer passenger trip ODs.
Although ADCS change the quantity, type and quality of data available to transportation planners, there is still a gap between what these systems can directly provide and what transit agencies need in practice. One example is the passenger trip OD matrix, one of the most important elements for transit planning, which cannot be obtained directly from the ADCS since most AFC systems record entries but not exits. Some research has been carried out to bridge the gap between what ADCS archived data offers directly and what is desired by transit agencies through extensive data
Recent passenger trip OD estimation research can be divided into three cases: both entry and exit locations are recorded by the ADCS; only entry locations are recorded; and neither entry nor exit locations are recorded. The following sections review approaches to deal with these three cases.
2.1.1 OD Estimation with Both Entry and Exit Locations Recorded
An early example of an automated fare collection system was the Bay Area Rapid Transit (BART) system. Buneman (1984) initiated the creation of OD matrices by using farecard-based data in the BART system. In that case, the distance-based fare structure required identification of both entry to and exit from the system, which provided a more accurate passenger trip OD matrix with simpler processing than for entry-only systems.
Jang (2010) further examines the possibilities of using data from such closed systems for transportation planning applications in the city of Seoul. One feature that distinguishes the Seoul ADCS from many other cities is that it records each trip's entry and exit times and locations, as well as the trip chains with interchanges. Based on this dataset, Jang analyzes interchange patterns and identifies interchange points that need improvements by examining the points where interchange demand exceeds 5,000 per day and/or the average interchange time exceeds 10 minutes.
2.1.2 OD Estimation with Entry-Only Boarding Locations Recorded
Tr6panier et al. (2007) present a model to estimate the alighting stop for each individual passenger boarding a bus with a smart card in Gatineau, Quebec. In their case, the ADCS store the location where the passengers boarded using the onboard positioning equipment. Hence, they only need to develop a way to infer the destination in order to define the passenger trip. The destination inference is based on two assumptions: first, the destination of a passenger's trip is the first stop of his/her following transit trip ("normal trips") and second, the passenger's last transit trip returns to the stop where he/she first boarded ("last trips"). They report a success rate of 66 percent in the first application of this methodology but up to 80 percent in peak periods. Figure 2-1 illustrates the destination inference process.
Figure 2-1: The Alighting Location Estimation Model for "Normal" and "Last" Trips (Trepanier 2007)
2.1.3 OD Estimation with Neither Entry Nor Exit Locations Recorded
If neither the boarding nor the alighting locations can be obtained directly from the ADCS, then both of them need to be inferred. Methodologies have been developed to infer the boarding and alighting locations separately using ADCS archived data as illustrated below.
a) Origin Inference
Depending on the data available, boarding locations can be inferred in two ways. One is to infer the origin with an AVL system, and the other is to infer the origin without an AVL system. Clearly, the origin inference process with an AVL system is more reliable.
Origin Inference with an AVL system
In the Chicago Transit Authority (CTA) case, the AFC system is an entry-only system, meaning passengers only swipe their cards when entering a rail station or boarding a bus, so no information about the destination is provided directly. In addition, the boarding location is only coarsely recorded at the bus route level with no specific information about the bus stop provided. Zhao (2006) proposes a way to integrate the AFC and the AVL systems to infer boarding locations. He integrates the two systems by 22
matching the vehicle location information from the AVL against the passenger trip information from the AFC to infer the individual passenger's boarding stop. The AFC transaction time for a passenger boarding should be shortly after the corresponding AVL time recorded as illustrated in Figure 2-2:
Figure 2-2: Combining AFC with AVL to infer the boarding stop (Zhao 2006)
Cui (2006) further applies this origin inference methodology to the bus network in Chicago, beginning at the single route level, and then at the network level with an origin inference rate at 90% for all CTA passenger trips using AFC cards.
0 Origin Inference Without an AVL system
Barry et al. (2008) propose an approach to identify the specific boarding and alighting locations using only the AFC data with no location information in New York City. Without an AVL system, it is impossible to know the accurate bus location at any time. They use the scheduled run time to estimate the location of a bus along its route at the time of the AFC transaction. Transfer information obtained from the AFC system is used to adjust for buses running off schedule. For example, if a passenger has two bus trips successively within a short period of time and the two bus routes intersect, then the
second bus must be close to the intersection stop at the transaction time, and the scheduled bus trajectory can be adjusted accordingly.
b) Destination Inference
To infer the destination for individual passengers' trips, Zhao (2006), Cui (2006), Trepanier et al. (2007) and Barry et al. (2008) all use trip-chaining with similar assumptions as those summarized by Zhao (2006):
" There is no private transportation mode trip segment (car, motorcycle, bicycle,
etc) between consecutive transit trip segments in a daily trip sequence;
e Passengers will not walk a long distance to board at a different rail/bus station
from the one where they previously alighted. In Zhao's application in Chicago, the acceptable walking distance was assumed to be 1320 feet -- or five minutes' walking time at a speed of three miles per hour;
e Passengers end their last trip of the day at the station where they began their first
trip of the day.
The destination of an individual passenger's trip is inferred to be the boarding location of the next transit trip. If the trip is the last transit trip of that day, then the destination is inferred to be the boarding location of the first transit trip of that day. Barry et al. (2008) further assume that travelers making only a single trip on a day have the same destination distribution as multiple-trip card users, given the same boarding location. They validated their results by comparing them to a travel diary survey for subway riders. This study found that this methodology resulted in 90% valid destinations.
Cui (2006) further applies this destination inference methodology to the bus network in Chicago with an inference rate of 67% for all the transit passenger trips using AFC cards. The network OD matrix is formed as shown in Figure 2-3:
Q51
Tuinsfer(WMatrx Non-Transfer_ 0nOD Matrix
00 TojRQI#1 Route #n
Note: Transfer fow matrices between any two route-dirs wil have much lower values due to lower transfer volunes compared to non-transfer volurnes. Transfer flow matrices are also
more sparse, and transfers between many route-dis are not possible.
Figure 2-3: Network level OD matrix (Cui 2006)
2.2 General Methodology to Infer Transit Passenger Origins and Destinations The transit passenger OD estimation methodology described here is built upon the trip-chaining OD estimation method applied in Chicago in 2006 by Cui (2006). Since different transit agencies may have different data sources with different characteristics, this section describes a general methodology that can be applied by any transit agency with ADCS, regardless of the specific characteristics. It begins with a discussion of the required characteristics of the ADCS archived data, followed by a detailed description of the methodology used to infer transit passengers' origins and destinations.
2.2.1 ADCS Data Preparation
ADCS are among the most powerful ITS technologies available to transit planners. However, many ADCS were not initially designed for data collection purposes. For example, ADCS are often designed to announce bus stops, to collect fares, or to report emergencies. This often poses problems in using the data, especially because much of
Destinaton
Desinations on Route#1 Destirtions on Route 42 Destnatons on Route #n
g Non-Transfer Transfer 01D Mt
OD Matrix --- #1
0 Q Route #1 ToRoutwf#
Transfr 00Marix Non-Transfer
OD Matrix
the data collected may be intermittent and fragmented. These limitations make the raw data meaningless without extensive analysis. In addition, different systems supplied by different vendors often have incompatible data structures and the data are often stored and managed in different database management systems. All of these factors make the integration across different systems difficult and severely limit easy access to the ADCS archived data.
Though different transit agencies have different ADCS, in order to implement the proposed OD inference methodology, some basic characteristics of the ADCS archived data are required. In general, three data sources are necessary: AFC, AVL and GIS data.
a) AFC Data
An AFC transaction record is generated each time a passenger swipes (or taps) a farecard at AFC equipment. The record includes the time, location (bus route and trip), and a unique serial number for that farecard. The time recorded is when a passenger swipes (or taps) a farecard to board a bus or enter a rail station to wait for the train; the location recorded may be as coarse as the bus route ID and the bus trip ID, in which case the actual boarding location cannot be obtained from the record directly; the unique serial number is assigned to each farecard to track each card holder's multiple trips over the life of the farecard. Since most of AFC systems are entry-only, passengers only use their farecards when boarding a bus, and no information about passengers' destinations can be obtained directly. The basic information needed from the AFC system for the OD inference includes:
" time (date and time for the farecard transactions);
e bus route ID, showing the route number that each farecard holder boards; and
" bus trip ID, showing the trip number of the bus, which also indicates the direction for each trip;
b) AVL Data
The AVL system records vehicle location information, which may be used to keep the driver informed of on time performance, to inform the bus control center of current bus location, and to drive the automatic stop announcement system.
An AVL record typically includes the following data:
* the vehicle's progress along a route, for instance, "the arrival" and "the departure," including a time-stamp (always to the second);
e the location information at each bus stop; and
* the identification information such as the bus route number and the bus trip number, which are the most important features needed to infer bus passengers' boarding locations.
c) GIS Data
To infer the alighting locations, we also need GIS files encompassing the bus and railway networks, as well as the road network of the studied area. These GIS files should include:
* every bus route in the network;
* each direction for every bus route, as routing varies by direction;
e every bus stop/rail station in the network.
Although all of these data are collected automatically, possible human errors could still be involved in the AFC and AVL systems. For example, bus drivers may not log on/off the AVL system correctly. And bus trip number and direction may not be changed at the right time, which may cause problems at the terminal stops. Using the
published schedule, it is possible to identify the correct trip that the given transaction should be assigned to. These issues will be discussed in detail in Section 3.2.
2.2.2 Origins Inference
The basic idea for inferring bus passengers' origins is that it should be possible to identify the boarding stop for every passenger with a farecard who boarded a bus with a
functioning AVL system. For a given route and trip, the fare collection timestamp from the farecard is used to search through the AVL data to determine the boarding stop.
This step is logical and straightforward and can easily be implemented by matching the farecard transactions against the AVL recorded bus run information to identify bus stops where passengers board.
2.2.3 Destination Inference
The destination inference method is built on the establishment of trip-chains for each farecard user, with the same assumptions described in the above literature review. Before implementing the methodology, lookup tables are needed to help infer the alighting stop which is nearest to the next trip's boarding location. Lookup tables can be derived by calculating the distance between bus stops and between bus stops and rail stations with up-to-date GIS files.
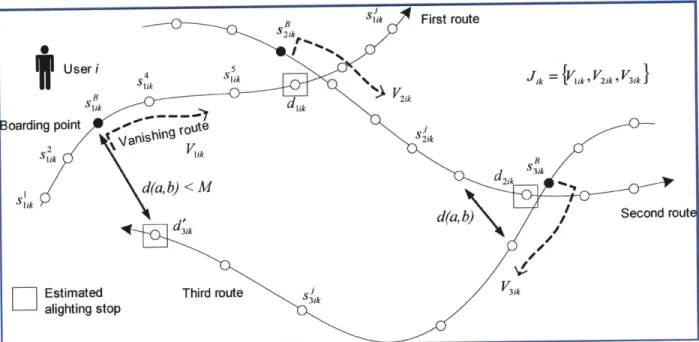
The detailed procedures to implement this methodology are illustrated in Figure 2-4. Assume the bus trip segment currently under examination is trip segment s by person (farecard) p on day d, and its subsequent trip segment is ss. The algorithm determines whether trip segment ss is on bus or on rail and moves onto the "next trip" rule with a lookup table for bus sub-procedure or "next trip" rule with a lookup table for rail sub-procedure respectively. There are two exceptions as also indicated in Figure
2-4:1) if trip segment s is a single trip made on a day, then the destination cannot be
inferred; 2) when trip segment s is the last trip segment of the day, the first trip segment of the day is regarded as the trip segment immediately following s and then the "next trip" rule can be applied to infer the destination of the trip segment s.
Figure 2-4: Process for destination inference 2.3 Summary
From both the literature review discussed in Section 2.1 and the methodology described in Section 2.2, it is feasible to infer the transit passengers' OD matrix. Generally, for transit agencies equipped with ADC systems, as long as they have the AFC, AVL and GIS data with required characteristics as described in Section 2.2.1, the methodology proposed in Sections 2.2.2 and 2.2.3 can be applied to obtain the passengers' OD matrices automatically.
Moreover, since the ADCS have extensive spatial coverage and a full temporal span of continuous data, detailed daily transit passenger travel information can be obtained easily. With traditional methods, only key locations and "typical" day and peak hours are studied, but with ADCS, transportation planners can get much more useful and reliable information about the transport system with continuous data. They can also get a complete picture of the travel demand variations for different days, different time periods and different locations, which can help them to make better service planning decisions.
3 London Case Study: Origin-Destination Inference
Following the general methodology described in Chapter 2, this chapter develops a method specifically for London buses using data available at Transport for London. The characteristics of ADCS archived data in London and the feasibility of using these data to infer bus passenger OD matrices are discussed in detail in Section 3.1. Five bus routes in London are selected for study with results presented in Section 3.2 and 3.3. The bus terminal issues encountered during the process are discussed in Section 3.2 as part of the discussion of origin inference. This chapter ends with a summary of the application of this OD estimation method to London.
3.1 TfL ADCS
There are four key data sources available in London for inferring bus passengers' OD matrices: Oyster Smart Cards, iBus, Electronic Ticketing Machines (ETM) and GIS with characteristics as described below.
3.1.1 Understanding Data Quality and Characteristics
(1) Oyster Smart Card Data
The Oyster Smart Card was launched in London by TfL in December 2003 as a new contactless ticketing medium. The penetration of smart cards is crucial for automatic OD inference as practiced in this research. It is currently estimated that about 80% of all journeys are made each day on the bus, Tube, DLR and London Overground using Oyster Cards (Transport for London, 2010). Oyster Smart Cards in London are owned by individuals and record every transaction the card holder makes in the public transportation system. For the Underground and Overground networks, both the time and rail station for entry and exit are recorded, while for bus, only the time of bus boarding and route information is recorded. Several types of analyses are possible with the smart card data, including ridership monitoring, revenue estimation and service performance measurement in the rail network. The key contribution of this research, however, is to develop a methodology to infer the origins and destinations for bus passengers in London using the Oyster smart card data and to develop related
applications for the London bus network. For the purposes of this project, the following data are used:
Prestige (Oyster Card) data from November 8, 2008 to November 21, 2008, and from May 11 to June 7, 2009 for the entire TfL network including the following data fields:
>
Daykey - identifies the date of the Oyster transaction>
Pid_encrypt - unique card ID, encrypted to provide anonymity and protect privacy>
Sequenceno - sequence number of the transaction>
Subsystemid - distinguishes bus trips from rail trips in the database>
T_cen - transaction time (in minutes after midnight)>
Routeid - route number of bus transactions>
Bus TripNo - trip number of bus transactions>
Direction - bus route direction at boarding>
NextSequenceno - sequence number of the next transaction for the same Oyster card holderCurrently about 90% of bus passengers use Oyster Cards although this percentage is increasing over time.
To infer the alighting locations for bus passengers, we need the boarding information for bus passengers' next transit trips, which could be either by National Rail/Underground or bus. Before January 2, 2010, Oyster Cards could be used on National Rail only on trains travelling in Zones 1-9 (Transport for London, 2010). The coverage of National Rail network is increasing over time meaning that more information will be available in the future for destination inference.
(2) iBus Data
iBus is a E1 17m AVL and radio system which aims to help London Bus Services Limited (LBSL) to run more reliable and consistent bus service. The first installations took place in March 2007, with completion in April 2009. iBus data contain information about the
'The Oyster transaction times are truncated to the minute while the iBus AVL timestamps are to the second, and this will cause some problems when matching the two against each other to infer the origin.
route number and trip number as well as the direction for each bus trip, but most importantly, it provides a unique identifier for each bus stop and the observed departure time from each stop. iBus data for the selected bus routes and all parallel and intersecting routes for November 8-21, 2008, and May 11 to June 7, 2009 are used in this research. These datasets, provided by the Technical Support Group (TSG) of London Buses, contain the following fields:
>
Shortdesc - service bus route number>
Direction - direction of trip>
Tripnr - LBSL trip number run by the vehicle>
Stoppointid - unique iBus identifier of each bus stop>
Stopsequence - sequence number of stops within the route at each direction, for example, 1 means the first stop at one direction along a bus route, and 2 means the second stop, etc.>
Shortdesc2 - LBSL bus stop code, which can be joined with GIS files>
Longdesc - LBSL bus stop name>
Observed Run Nr - run number of the observed trip>
Scheduled distance - distance between one bus stop and its previous stop in meters>
Sched Dist In Trip - cumulative distance of the trip from the origin stop to the stop in question in meters>
Scheduled departure time - scheduled departure time from this stop, including the date and time>
Observed departure time - observed departure time from this stop, including the date and time, but there is ambiguity about what is exactly recorded>
Tripid - unique iBus identifier of the trip (3) Electronic Ticketing Machine (ETM) DataRoute-level passenger demand data are gathered through Electronic Ticketing Machine (ETM) transactions, which are downloaded from bus garages to the Bus Contracts Management System (BCMS). The BCMS is used to determine the number of journey
stages over an entire day (24 hours) for any timeband (e.g., AM Peak usage from 7 to 9:30 a.m.) as recorded by bus drivers.
The ETM totals (the aggregate number of trips taken in each bus) from November 8 to 21, 2008, and from May 11 to June 7, 2009 are used in this research as control totals to expand the Oyster counts to all passengers.
(4) GIS Data
Up-to-date GIS files encompassing the TfL bus and rail networks are provided by Network Development of London Buses, which include the following files:
" BusnetRoutes071108 - a line file of every route in the bus network; for every route, a separate line indicates each direction, as routing varies by direction. * BusnetStops071108 - a point file of every iBus AVL stop in the network. * The railway network files and the London road network.
3.1.2 Methodology based on Oyster and iBus Data
Based on the characteristics of the Oyster and iBus data, the methodology proposed in Chapter 2 is applied. The basic idea is that it should be possible to determine the boarding stop for every passenger using an Oyster Card to board an iBus-equipped bus. For a given route and trip, the fare collection timestamp (including the date) from the Oyster smart card is used to search through the iBus data to determine the boarding stop. The next trip taken by the user is used to infer the alighting stop, where possible.
Refinements to the general methodology proposed in Chapter 2 are made due to the specific data characteristics in London. A feature that distinguishes the London case from other transit agencies is that in addition to obtaining the "seed" OD matrix from the Oyster and iBus data, London has Electronic Ticket Machine (ETM) data, which counts both the Oyster and non-Oyster passengers for each bus trip over the day. The ETM data is used to expand the "seed" matrix from the Oyster passengers to all passengers. Section 5.5.2 below discusses this issue in detail.
3.2 Origin Inference
Since the Oyster transactions only record the timestamp when every Oyster passenger gets onboard, and no information about the location is recorded, while the iBus AVL system records the timestamp when the bus door opens/closes at each bus stop for each bus run, the boarding stop can be determined by matching the Oyster transaction times against the iBus time data.
The origin inference procedure is implemented through a custom-built Java program, according to the assumptions, rules and limitations set out below.
3.2.1 Underlying Assumptions
Several assumptions are made to infer the origins:
- Since the Oyster transaction times are truncated to the minute, while the iBus timestamps are recorded to the second, the actual boarding times can be thought of as a random variable uniformly distributed over the 60 seconds starting with the recorded minute. When we match the Oyster transactions against the iBus timestamps, we first try to search for the iBus timestamp that is within the same minute as the Oyster transaction. If there is such an iBus record, then it is a perfect match for the Oyster transaction; if there is no such iBus record, then we set the expected value of the Oyster transaction time to be equal to the value recorded in the Prestige Oyster database plus 30 seconds and compare the time differences between the Oyster transaction and the iBus records.
- Each Oyster transaction time falls between two iBus transaction times, a "previous stop" and a "next stop." Fares are generally paid before the doors of the bus close. However, since the definition of "departure time" in the iBus
system is ambiguous, one cannot say with certainty that an Oyster transaction should always be assigned to the "next stop." Experiments are made by matching the Oyster transactions to the "previous stop" and "next stop" separately and the effectiveness is compared as shown in Figures 3-1 and 3-2.
Difference between Transaction Time and Departure Time 1200 1000 800 600 400 200 0
.1.1.
LA LA -- LA LA LA - - -- - - -A - -4 - -4 -t -ILA t LA LA LA LA LA LA LA LA LA LA LA LA LA LA 1o-i -4 0yi C-4 ' &; LAi &; L5iN- 6i 00im 0
Time
Figure 3-1: The effectiveness of "previous stop" rule (W4) Difference between Transaction Time and Departure Time
1600 1400 1200 1000 800 600 400 200 0 LA LA LA LA LA LA LA LA Ln LA LA LA LA LA LA LA LA LA LA LA Wj -O Oi O m q O'O 't O 4 O O - O ' 00 tO oo0 0 0 0 0 0 0 0 0 0 0 0 0 0 0 0 0 0Z Time
Figure 3-2: The effectiveness of "next stop" rule (W4)
Since both of these rules show some large differences between the Oyster transaction time and the iBus observed departure time, another rule, "closest stop" is
also tested, as illustrated in Figure 3-3 below. "Closest stop," is the minimum of {(next stop - Oyster transaction), (Oyster transaction - previous stop)}, i.e., the closest stop in time to the Oyster transaction.
Oyster
Transactioil Closest Stop
Previous Stop *Next Stop
Figure 3-3: "Closest Stop" rule for origin inference
Figure 3-4 shows the effectiveness of the "closest stop" rule using Route W4 as an example: 3000 2800 2600 2400 2200 2000 1800 1600 1400 1200 1000 800 600 400 200 0
Difference between Transaction Time and Departure Time
... I. Ln Rt. LA Rt oA o L Oct r..4 LA qt Lo LA LA 19 j LA r1 LA qT LA -4 LA 't LA LA LA LA LA LA r 4 '- -t '- q o o 0 0 0 0 0 0 0 0 0 0 0 0 0 0 0 0 0 Z o o o o o o o o o o o o 6 6 o o o 6 6 lime
Figure 3-4: The effectiveness of "closest stop" rule (W4)
By comparing the three rules, the "closest stop" rule works best in minimizing the time difference between the Oyster transaction time and iBus observed departure time. Therefore, the "closest stop" is used to infer the origin.
In some cases, a bus driver may open the bus doors to allow boarding while waiting at the terminal for an extended period of time. In these cases, some passengers
1111.11 1 1 M
will board the bus a few minutes after the bus doors open. However, if the time between the bus departure and passenger payment is longer than a few minutes, it is likely that this data is due to an error and we cannot rely on it to infer the boarding stop. In this study, 5 minutes is used as the threshold to determine errors. If there is no valid iBus AVL record within this threshold value, this method considers the boarding stop for this
Oyster transaction to be unidentifiable and this transaction record is discarded.
3.2.2 Process of Origin Inference
The Java program for origin inference operates as follows:
>
Read all the iBus data, placing the data into the following hierarchical format (where "point" is a single record of a "departure" from a specific bus stop, including the departure time and the ID of the stop that the bus departs from):Route Day Trip Point
In this case, the "Route" level will contain the route ID selected for O-D inference and all of its parallel and intersecting routes for which iBus data are available. "Points" are ordered by iBus departure time, to make the search algorithm in the following step more efficient.
>
Each Oyster transaction is then read. If a match is found for the route, the program then looks for a match for the date and trip. If a match is found, the transaction ismatched to a stop (point) using the "closest stop" rule. If no match is found, that particular Oyster transaction is discarded.
>
This process is repeated for all Oyster transactions in the file.3.2.3 Origin Inference Results
Routes W4 and 70 are used here as examples to show the results of origin inference process.
* Route W4
Route W4 runs between Tottenham Hale (Ferry Lane Estate) and Haringey via Bruce Grove, Broadwater Farm, Turnpike Lane and Wood Green. This route is 7 miles (11km) long with daytime headways of 10 minutes and 20 minutes during the early
morning and late night. This route connects with two National Rail stations and three Underground stations. The route schematic is shown in Figure 3-5 (the grey line).
ms Mad Gre Nonhodd Road~tife Roada
GrwntermBw~f G~mTatteniamn Cealstery
Nasige h Foeri Centre
Poatire Roadan New Avetpt entr e yj, worp o
W'OM Night buses
Wammpawa __d N29 &x
Paoh Roadr~r
Figurehe5: Rout schematc for W
(http://wwwffl~~~~~~gov.~ uktlgtigrun/asbsspfwdgren233.d
The W4is alo oneof sevral bs rouesm~w inLnon whihcnti ulilw"al and-ride section. These engthy sctions d not hav any t arker tpan hrfr
no~~~~~~~~~~~~~~~~~~Udo hs etosaercre nteiu ytm, nM ote stp ln rsn challeng when uing thepropose methodlogyto dtermn th badig n alighting locations for each passenger atntheeso-ee.dnti tdy h tp
-"bookending" the "hail-and-ride" sections are aggregated into a single "dummy" stop as shown in Figure 3-6. This way, passengers matched to a stop using the "closest stop" rule are assigned to a general "hail-and-ride" stop, not to a specific street intersection.
stop Hail-andi-RideMO
A ---- B
Dummy Stop
Figure 3-6: Dummy stop for "Hail-and-Ride" segments on Route W4
Of a total of 8585 Oyster transactions that are recorded on Route W4 on November 20, 2008, boarding stops were inferred for 94% or 8028 passenger trips. Most unmatched transactions are due to a lack of iBus data for the trip, since 6 out of the 192 bus trips run that day had no iBus data.
* Route 70
Route 70 runs between Acton and South Kensington via East Acton, Ladbroke Grove, Queensway and Notting Hill Gate. This route is 8 miles (12 km) long with daytime headways of 10 minutes and 15 minutes during the early morning and late night. There are no "hail-and-ride" segments for Route 70, which makes the matching less complicated. The route map is shown in Figure 3-7 (the pink line).
Figure 3-7: Route schematic for 70
(http://www.tfl.gov.uk/tfl/gettingaround/maps/buses/pdf/southkensington-2236.pdf) There are a total of 196 bus trips on Route 70 with 8 bus trips lacking iBus data on November 11, 2008 (BODS survey day). A problem with the iBus system on this day is that there is no iBus data available for the first 5 stops westbound from South Kensington. Section 3.2.4 proposes a method to deal with this problem.
Of a total of 12074 Oyster transactions that are recorded on Route 70 on November 11, 2008, 11381 or 94% of the Oyster transactions have origins that were successfully inferred. Similar analyses are conducted for the other three selected routes. Table 3-4 at the end of Section 3.3 summaries the origin inference results for all five selected routes. In general, most of the routes have similar origin inference rates, with around 90% of all Oyster transactions having the origins inferred.
The major reason why some transactions do not have origins identified is a lack of iBus information for some trips. Another possible reason is that sometimes the