Proceedings of the 19th IAHR-APD Congress 2014, Hanoi, Vietnam ISBN 978604821338-1
POTENTIAL CLIMATE CHANGE EFFECTS ON THE METEOROLOGICAL FORCING AND THE DESIGN
EFFICIENCY OF URBAN DRAINAGE SYSTEMS
GIOVANNA GROSSI, BALDASSARE BACCHI & ROBERTO RANZI Università degli Studi di Brescia, Brescia, Italy, [email protected]
ABSTRACT
Urban drainage systems design and management are strictly connected to meteorological forcing. For design purposes synthetic forms (e.g. depth duration frequency curves) are usually adopted to represent the meteorological solicitation, while a stochastic representation could be more promptly used to investigate the effects of potential climate change both on the design and on the efficiency of urban drainage devices. A simplified semi-probabilistic approach, relying on simple models of the stochastic rainfall process and of the rainfall-runoff (hydrological) transformation, is expected to be a sound tool. Since the rainfall process is described through the definition of three random variables and their probability distribution, the main advantage is the possibility of changing one, two or more characteristics of the rainfall model at a time. The effect of the change can then be easily evaluated through the application of the hydrological model.
The semi-probabilistic approach is applied to study some aspects of the drainage system design for locations in the Italian territory. Potential effects of climate change on fictitious urban basins are evaluated through a rainfall stochastic model calibrated on the basis of long series observations recorded at site. Precipitation climate change scenarios were defined on the basis of both international climate studies report and local meteorological observation analysis. The effects on the urban drainage system are evaluated with respect to specific urban drainage devices and the efficiency of the design procedure in the hypothesis of climate change is finally discussed.
Keywords:Urban drainage systems, climate change scenarios, design efficiency 1. INTRODUCTION
Climate change potential effects on water resources and on their management has become a topical debate in the scientific community dealing with hydrological sciences and hydraulic structures. Besides, after the publication of the Fourth Assessment Report (AR4) by the Intergovernmental Panel on Climate Change (IPCC, 2008) the level of awareness of a forthcoming potential threat has increased and most public and private institutions devoted either to the protection of the environment or to the exploitation of the water resources encourage research in this direction. The Fifth Assessment Report (IPCC, 2013) has just been published: the foreword of the physical science basis reports that “warming in the climate system is reported to be unequivocal, with many of the observed changes unprecedented over decades to millennia: warming of the atmosphere and the ocean, diminishing snow and ice, rising sea levels and increasing concentrations of greenhouse gases. Each of the last three decades has been successively warmer at the Earth’s surface than any preceding decade since 1850”. On the other hand, referring to the water cycle in the atmosphere and besides precipitation it is also stated that the contrast between wet and dry seasons “will increase, although there may be regional exceptions […]”. Therefore, the impact on the hydrological response of a particular area, even more than on the meteorological forcing, has to be searched and considered at the regional scale.
Focusing on urban areas and combined sewer systems, the frequency of occurrence of heavy precipitation events, which has been likely increasing since 1950 “in more regions than it has decreased” (IPCC, 2013), is a fundamental piece of information in any design procedure. Besides in Europe “there have been likely increases in either the frequency or intensity of heavy precipitation with some seasonal and regional variations”. For a given T- year return period, just to mention some of the used design procedures, the size of a combined sewer channel is assigned on the basis of the T-year peak runoff, while sewer tanks have to cope with the T-year runoff volume. A major role is also played though by some physical characteristics of the rainfall process, such as the duration or the intensity: the runoff peak discharge and the runoff volume depend on the intensity and duration of the storm, on how much runoff is produced and on how it is routed from the point where it is generated to the downstream control section. In what way these features change depends on the local climate change and in many cases it is hard to be translated in detailed future scenarios. Italian traditional design procedures for urban drainage system devices account for the characteristics of the local climate through the definition of depth duration frequency (DDF) curves and the assumption of simple geometric shapes (rectangular) of the design hyetograph. These curves roughly synthesize the characteristics of the rainfall processes. For each basin, a runoff coefficient is also usually assumed, on the basis of the typical hydrological response of the watershed. In fact the
fraction of water contributing to runoff generation depends on the rainfall intensity and depth and on how important the role of each type of hydrological loss (infiltration, interception, evapotranspiration,…) is within the urban basin. The runoff coefficient then accounts for the weight of the water losses within the water balance equation at the basin scale.
If the potential effects of climate change on the storm patterns for urban drainage design have to be investigated (Van Nguyen, 2010), the traditional procedures might be based on a not reliable representation of the rainfall process and of some parts of the rainfall-runoff transformation (R-R) model. In this perspective traditional procedures might be less effective than a semi-probabilistic approach, first introduced by Guo and Adams (1998a, 1998b, 1999) and then modified in a simplified version by Bacchi et al. (2008). In the semi-probabilistic approach a stochastic rainfall model is adopted to represent the rainfall process. A deterministic rainfall-runoff model is then coupled to the rainfall model in order to derive the probability distribution of some characteristics of the outflowing hydrograph.
If the rainfall process is described by assuming three main characteristics (the event volume, the event duration and the interevent time) as independent random variables fitting an assigned type of frequency distribution, then the potential effects of climate change may be considered by modifying the parameters of each frequency distribution according to the expected change. On the other hand the weight of the water losses might also be affected and the parameters of the rainfall-runoff model need to be accordingly modified.
The semi-probabilistic approach is here adopted in order to assess the potential effects of climate change on fictitious urban basins affected by meteorological forcing defined on the basis of long series observations recorded in Brescia (North Italy).
2. THE SEMIPROBABILISTIC APPROACH
It is assumed that the rainfall process of a basin is a stochastic process where the storm ‘events’ have the depth v, the duration t and inter-storm time b as independent variables exponentially distributed. Then the marginal probability density functions (pdf) are:
v V
v
e
f
(
)
=
ζ
⋅
−ζ⋅ [1] t Tt
e
f
− ⋅⋅
=
λ
λ)
(
[2] b Bb
e
f
(
)
=
ψ
⋅
−ψ⋅ [3] where the distribution parameters ζ=1/vm, λ=1/tm and ψ=1/bm are the inverse of the mean storm depth vm, mean storm duration tm and mean inter-arrival time bm.By introducing the rainfall events as input in a simplified rainfall-runoff model it is possible to derive analytically the probability distribution function (CDF) of the storm runoff and of the peak-flood, the most interesting variables of the resulting hydrograph. The method of the ‘derived distribution’ in the R-R process description was firstly introduced by Eagleson (1972) and later applied by others to derive the CDFs of runoff and peak-flood in
different countries (Diaz-Granados et al., 1984; Bacchi and Rosso, 1988, among others). In this paper the storm runoff volume vr is derived from rainfall volume v through the model:
)
(
a rv
I
v
=
φ
−
for v≥Ia [4]0
=
rv
for v<Ia [5]where φ is a runoff efficiency coefficient and Ia is the initial abstraction of the rainfall due to the interception, depression storages and high initial infiltration capacity. The CDF of vr is easily derived as
( )
{
}
( )
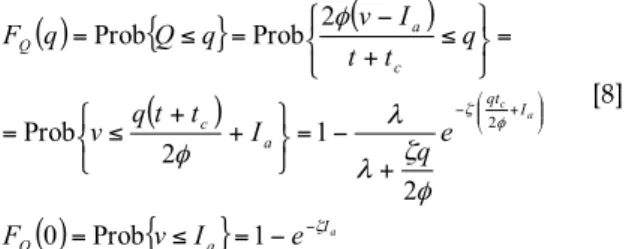
a r a I Vr v I r a r r r Vr e F e v I v v V v F ζ φ ζ φ − ⎟⎟ ⎠ ⎞ ⎜⎜ ⎝ ⎛ + − − = − = ⎭ ⎬ ⎫ ⎩ ⎨ ⎧ + ≤ = ≤ = 1 0 1 Prob Prob [6] Assuming for the runoff hydrograph a triangular shape with a base time equal to the sum of time storm duration t and the time of concentration of the basin tc (West, 1974) the peak of the hydrograph Qi becomes (see Figure 1))
t
t
(
v
Q
c r i+
⋅
=
2
[7] With reference to the Figure 2, the CDF of Qi is then derived assuming constant values for the concentration time tc, the Ia and φ. The derived distribution is
( )
{
}
(
)
(
)
( )
{
}
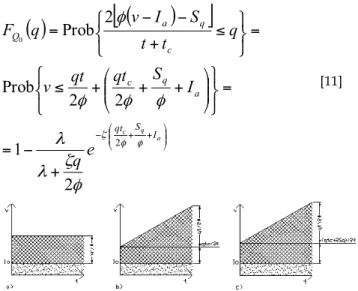
a a c I a Q I qt a c c a Q e I v F e q I t t q v q t t I v q Q q F ζ φ ζ φ ζ λ λ φ φ − ⎟⎟ ⎠ ⎞ ⎜⎜ ⎝ ⎛ + − − = ≤ = + − = ⎭ ⎬ ⎫ ⎩ ⎨ ⎧ + + ≤ = = ⎭ ⎬ ⎫ ⎩ ⎨ ⎧ ≤ + − = ≤ = 1 Prob 0 2 1 2 Prob 2 Prob Prob 2 [8]For the conceptual representation of the reservoir-routing process a simplified scheme suggested by West (1974) and Wycoff & Singh (1976) is adopted. As shown in Figure 1, also the output flood hydrograph from the retention storage is assumed to be a triangle with peak Qo on the recession limb of the input hydrograph. The resulting storage SQo needed to obtain the peak reduction is (shaded area in Figure 1):
)
t
t
(
)
Q
Q
(
S
Q0=
2
1
i−
0⋅
+
c [9] then Qo is related to the other variables with the relationship:)
t
t
(
)
S
v
(
Q
c Q r+
−
⋅
=
2
0 0 [10]If the relationship between the output flow qo and the stored water Sq is known, the CDF of peak Qo can be derived, with reference to the Figure 2c, as:
( )
[
(
)
]
⎟ ⎟ ⎠ ⎞ ⎜ ⎜ ⎝ ⎛ + + −+
−
=
=
⎭
⎬
⎫
⎩
⎨
⎧
⎟⎟
⎠
⎞
⎜⎜
⎝
⎛
+
+
+
≤
=
⎭
⎬
⎫
⎩
⎨
⎧
≤
+
−
−
=
a q c S I qt a q c c q a Qe
q
I
S
qt
qt
v
q
t
t
S
I
v
q
F
φ φ ζφ
ζ
λ
λ
φ
φ
φ
φ
22
1
2
2
Prob
2
Prob
0 [11]Figure 2. The integration regions utilized for the derivation of the CDF’s of: a) runoff volume, vr, b)peak-flood of the input
hydrograph Qi, c)peak of the output hydrograph Qo.
3. CLIMATE CHANGE SCENARIOS
The simplified semi-probabilistic procedure was applied to the case study of the Brescia time series of rainfall observations. The parameters of the rainfall stochastic model, that is the average rainfall volume per event, vm, the average storm duration, tm, and the average inter-event time, bm, were estimated on the basis of the 50 year long, 30 minutes duration, rainfall data series recorded at ITAS-Pastori (Brescia). For the analysis, a minimum volume per event of 0.5 mm and a minimum inter-event time of 6 hours were assumed: these threshold values gave the best fit for the exponential probability distribution of rainfall volume (1) and storm duration (2), but it must be mentioned though, that the parameter estimate is strongly affected by the choice of the threshold values (Balkistrocchi et al., 2013; Balistrocchi et al., 2009; Bacchi et al., 2008).
If a water retention facility has to be designed for a draining basin 100 ha wide (1 km2), with a peak routed
discharge of 1 m³/s for a 10 year return period, the volume Sq to be stored in the reservoir depends on the runoff coefficient φ and on the initial abstraction Ia, as shown in Table 1. For the computation a reasonable value of the time of concentration tc=0.5h is assumed.
Table 1. Water retention storages [m3] computed by using the semi-probabilistic procedure for the Brescia case study for a 10 years return period routed discharge.
Ia [mm]
ϕ [-] 0 2 5
0.2 9516 9116 8516
0.4 22615 21815 20615
0.6 36486 35286 33486
In the last years, in Brescia, as well as in many climatic stations in the Po Valley, a hotter climate scenario characterized by higher storm intensities and rainfall events occurring only a few months in a year might be expected in the future.
Although this experience might have a limited scientific contribution, it is worth reporting that in year 2002 the maximum precipitation of 1 hour and 3 hours observed at the meteorological station at the University of Brescia had a return period of 50 years and the observed maximum temperature was 38,5 °C. Both short duration precipitation and temperature are the highest values ever recorded in Brescia, since 1949. Even if the historical data series of reference values are those recorded at the meteorological station at ITAS-Pastori, about 2 km South-East of the University, those values indicate a particularly hot and dry summer with storm episodes of very high intensity. In summary it seems that most precipitation events are occurring in some periods of the year and that the events are shorter and more intense. It is also experienced that the annual precipitation amount of the last two years, 2006 and 2007, are 30% lower of the historical climatic mean of 1000 mm/a. Since two years do not make a long enough period, as regards climate observations, this information has not been taken into account yet. As a consequence, the mean annual precipitation is globally assumed not affected by any appreciable modification but its spatial and temporal distribution change. Since the events are also less diffused and shorter, the effects at the soil surface are significantly different from those of precipitation events associated to the ordinary climate. Therefore four climate change scenarios (A-D, in the following) were considered, which translated this evidence in terms of the parameters of the stochastic rainfall model. For this comparison the runoff coefficient φ is assumed equal to 0.4 and the initial abstraction is set to 0 mm. With these values the water retention storage with Qo=1 m3/s for a return period of 10 years is 22795 m³ (22.795 mm), if the drained area is 100 ha wide. If the return period was 50 years, the storage volume would be 30198 m³ (30.198 mm).
Scenario A: increased storm intensity – same annual volume
The annual total precipitation, V, is equal to the one observed so far, but the average rainfall intensity for each event, v/t, increases. The average rainfall volume per event, v, and the number of events per year, n, are not changing, but the average storm duration, t, decreases by a factor 0.8 (-20%):
VA=nAxvA=V=nxv nA=n vA=v i=v/t tA=tx0.8 iA=v/(0.8t)>i Scenario B: increased storm volume – same annual volume
The annual total precipitation is equal to the one observed so far, but the average rainfall intensity increases. The average storm duration is not changing, but the average rainfall volume per event increases by 20% and the number of events per year decreases in order to keep the annual total precipitation constant.
VB=nBxvB=V=nxv nB=n/1.2 vB=1.2xv i=v/t tB=t iB=1.2v/t>i
Scenario C: increased annual volume – decreased storm duration
The annual total precipitation increases by 10%, and the average rainfall intensity increases. The number of events per year is not changing, but the average rainfall volume per event increases by 10% and the average storm duration decreases by 20%, so that the average storm intensity increases by about 37%.
VC=nCxvC=1.1xV nC=n vC=1.1xv tC=0.8xt
Scenario D: decreased annual volume - decreased storm duration
The annual total precipitation decreases by 20%, and the average rainfall intensity increases. The average rainfall volume per event is not changing but the average storm duration and the number of events per year decreases by 20%, so that the average storm intensity increases by about 25%.
VD=nDxvD=0.8xV nD=0.8xn vD=v
tD=0.8xt
4. RESULTS AND DISCUSSION
Effects of scenario A: increased storm intensity – same annual volume
The average storm duration is decreased from 9.70 h to 7.76 h. Higher values of probability correspond to fixed values of storm durations (Figure 3a), this induces a slight increase in the volume retention storage corresponding to a fixed return period (Figure 3b).
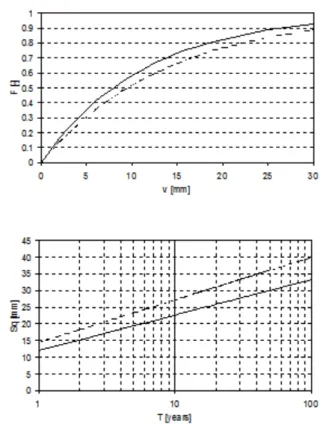
Figure 3. a) Probability distribution of storm duration t, b) design water retention storage Sq as a function of the return period. Continuous lines represent the control climate, dashed lines the scenario A.
Effects of scenario B: increased storm volume – same annual volume
The average rainfall volume is increased from 11.5 mm to 13.8 mm, and the number of events per year is decreased from 80 to 66. Lower values of probability correspond to fixed values of storm volumes (Figure 4a), this induces a significant increase in the volume retention storage corresponding to a fixed return period (Figure 4b).
Figure 4. a) Probability distribution of storm volume v per event, b) design water retention storage Sq as a function of the return period. Continuous lines represent the control climate, dashed lines the scenario B.
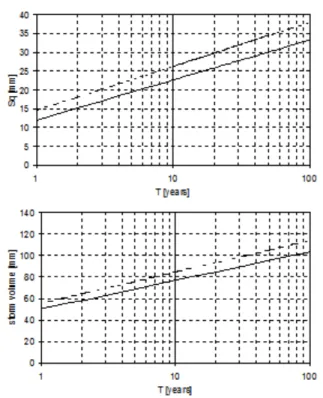
Effects of scenario C: increased annual volume – decreased storm duration
The average storm duration is decreased from 9.70 h to 7.76 h and the average rainfall volume is increased from 11.5 to 12.65 mm. Higher values of the return period correspond to fixed values of storm durations, the opposite occurs for the event volume (Figure 5a). The slight increase in the volume retention storage of a fixed return period resulting from scenario A is now significant (Figure 5b).
Effects of scenario D: decreased annual volume - decreased storm duration
The average storm duration is decreased from 9.70 h to 7.76 h and the number of events per year is decreased from 80 to 73. Higher values of the return period correspond to fixed values of storm durations (Figure 6a). This effect is practically not affecting the probability distribution of the volume retention storage (Figure 6b).
Figure 5. a) Storm volume v and b) design water retention storage as a function of the return period. Continuous lines represent the control climate, dashed lines the scenario C.
Figure 6 a) Storm duration t and b) design water retention storage as a function of the return period. Continuous lines represent the control climate, dashed lines the scenario D.
5. CONCLUSIONS
In order to investigate the effects of potential climate change on the efficiency of urban drainage system, a procedure based on a simplified semi-probabilistic approach has been defined and used to analyze the potential effects on some fictitious basins located in
Brescia (North Italy). As a matter of fact, traditional design procedures used in the Italian engineering practice might be based on DDF curves, a not reliable representation of the rainfall process. This may render the verification of the drainage system behavior in future climate scenarios a hard task.
On the other hand the semi-probabilistic approach suggests an appealing analysis framework for two main reasons: first, the deterministic representation of the R-R transformation can be modified according to the most common modeling schemes, second the rainfall process is described through more than one random variable, the statistics of which can be modified according to some predicted future climate scenario.
The semi-probabilistic approach was then applied in this study in order to assess the potential effects of climate change on fictitious urban basins affected by meteorological forcing defined through a stochastic model calibrated on the basis of long series observations recorded in Brescia (North Italy). The efficiency of the urban drainage system is here evaluated with respect to the design volume of a water retention tank, with an assigned return period. Four climate change scenarios were defined on the basis of both international climate studies report (IPCC, 2008) and local meteorological observation analysis:
• Scenario A: increased storm intensity – same annual volume
• Scenario B: increased storm volume – same annual volume
• Scenario C: increased annual volume – decreased storm duration
• Scenario D: decreased annual volume – decreased storm duration
In summary the effects of the four climate change scenarios on the water retention storage are listed in Table 2.
Table 2. Water retention storage [mm] for a fictitious drainage basin located in Brescia (A=100 ha, tc=0.4 h, qo=1 m3/s, f =0.4, Ia=0); ‘control’ means ‘present climate scenario’.
return period control scenario A scenario B scenario C scenario D 10 years 22615 23407 27092 26197 22381 50 years 30018 30811 35976 34340 29784 With respect to the scenarios defined in this analysis, the design volume of the water retention facility with an assigned return period and the parameterization of the rainfall process according to the present climate is definitely underestimated for scenarios B and C, i.e. when either the mean storm intensity increases, either because the storm duration decreases or the storm volume increases. For scenario A the underestimation of the design water storage volume is very low and finally it can be stated that scenario D is not producing any significant effect on the design of the water retention facility. In the latter case the mean storm volume does not change, with respect to the present climate, and the effects of the reduced storm duration is smoothed by the reduced
number of events per year, that increases the value of the return period corresponding to a fixed probability value. The same procedure can be used to verify the effects of potential changes in the rainfall process characteristics, as well as in the R-R transformation model parameters, on other urban drainage devices, but also in other climate areas.
REFERENCES
Bacchi B. and Rosso R. (1988). Analisi geomorfoclimatica dei modelli di regionalizzazione delle piene, Atti del XXI Convegno di Idraulica e Costruzioni Idrauliche, Vol. I, pp.15-27, L'Aquila 5-8 Settembre.
Bacchi B., Balistrocchi M., and Grossi G. (2008). Proposal of a semiprobabilistic approach for storage facility design, Urban Water Journal, 5(3), 195-208.
Balistrocchi M, Grossi G., Bacchi B. (2009). An analytical probabilistic model of the quality efficiency of a sewer tank, Water Resources Research, 45, W12420, doi:10.1029/2009WR007822.
Balistrocchi, M., G. Grossi, B. Bacchi (2013). Deriving a practical analytical-probabilistic method to size flood routing reservoirs, Advances in Water Resources, 62, 37-46.
Diaz-Granados M.A., Valdes J.B. and Bras R.L. (1984). A physically based flood frequency distribution, Water Resources Research, 20(7), pp. 995-1002.
Eagleson, P.S. (1972). Dynamics of flood frequency, Water Resources Research, 8(4), pp. 878-898.
Guo Y. and Adams B.J. (1998a) Hydrologic analysis of urban catchments with event-based probabilistic models. 1.Runoff volume, Water Resources Research, vol. 34 (12) 3421-3443.
Guo Y. and Adams B.J. (1998b). Hydrologic analysis of urban catchments with event-based probabilistic models. 2.Peak discharge rate, Water Resources Research, vol. 34 (12) 3421-3443.
Guo Y. and Adams B.J. (1999). An analytical probabilistic approach to sizing flood control detention facilities, Water Resources Research, vol. 53 (8) 2457-2468.
IPCC (Intergovernmental Panel on Climate Change) (2008). Climate change 2007: Summary for Policymakers, An assessment of the IPCC, released 17 November 2007, Valencia, Spain, published by IPCC.
IPCC (2013). Climate Change 2013: The Physical Science Basis. Contribution of Working Group I to the Fifth Assessment Report of the Intergovernmental Panel on Climate Change [Stocker T.F., D. Qin, G.-K. Plattner, M. Tignor, S. K. Allen, J. Boschung, A. Nauels, Y. Xia, V. Bex and P.M. Midgley (eds.)]. Cambridge University Press, Cambridge, United Kingdom and New York, NY, USA, 1535 pp.
Nguyen, V-T-V., Desramaut, N., and Nguyen, T-D. (2010). Optimal rainfall temporal patterns for urban drainage design in the context of climate change, Water Science and Technology, Vol. 62, No. 5, pp. 1170-1176.
West M.J.H. (1974). Flood control in reservoirs and storage pounds: A discussion, Journal of Hydrology, 23, 67-71. Wycoff R.L. and Singh U.P. (1976). Preliminary hydrologic
design of small flood detention reservoirs, Water Resour. Bull., 12, 337-349.