O R I G I N A L P A P E R
Evolutionary Foraging Models in Zooarchaeological
Analysis: Recent Applications and Future Challenges
Karen D. Lupo
Published online: 24 May 2007
ÓSpringer Science+Business Media, LLC 2007
Abstract The last few decades have witnessed a rapid rise in the use of foraging models derived from behavioral ecology to explain and predict temporal and spatial differences in faunal assemblages. Although these models build on conventional ideas about utility firmly embedded in zooarchaeological analyses, when cast in an evolutionary framework these ideas produce some of the most sophisticated and elegant interpretations of archaeofaunas to date. In this article I review the meth-odological and practical strengths and weaknesses of current zooarchaeological applications of foraging models. Recent applications of foraging models to the zooarchaeological record reveal important variability in human-prey interactions across time and space. Case-specific applications generate theoretical and meth-odological advances that augment and are complementary to model building in allied fields. Recent applications also identify shortcomings in the underlying assumptions and rationale of some foraging models that mirror past and on-going discussions in anthropology and biology. I discuss how these shortcomings can fruitfully direct future applications and research in foraging economics.
Keywords ZooarchaeologyForaging models Behavioral ecology Introduction
The last three decades have witnessed a rapid increase in the use of foraging models and rationale grounded in Neodarwinian theory to interpret zooarchaeological assemblages (e.g., Bayham 1979, 1982; Broughton 1994a; Butler 2000; Cannon
2000; Byers and Broughton 2004; Lupo 1998, 2006; McGuire and Hildebrant
2005; Munro 2004; Nagaoka2002a; Stiner et al.2000; Szuter and Bayham1989;
K. D. Lupo (&)
Department of Anthropology, Washington State University, P.O. Box 644910, Pullman, WA 99164-4910, USA
e-mail: [email protected] DOI 10.1007/s10814-007-9011-1
Ugan 2005a). The use of foraging economics in zooarchaeology has generated a number of very sophisticated models to explain and predict patterning in archaeofaunal assemblages on several different analytical scales from specimen to regional levels. The results of some analyses identify important changes in foraging efficiency and have wide-ranging implications for a number of prehistoric and contemporary issues. Overexploitation of prey accompanied by declining foraging efficiency and resource intensification, for example, is often identified as one of a constellation of conditions associated with the rise of social, political, and technological complexity among hunter-gatherers (e.g., Cohen 1979; Hildebrandt and Jones 1992; Sassaman 2004) and experimentation with domesticatable resources (Munro 2004). Resource stress, marked by overexploitation, is widely viewed as a catalyst for declining health and fertility, increased interpersonal violence, and major changes in life history (e.g., Broughton and O’Connell1999; Yesner1994). Although quite controversial, the identification of prey overexploi-tation by prehistoric hunters has implications for human and prey interactions (Barnosky et al.2004; Fiedel and Haynes2004; Grayson and Meltzer2003,2004), contemporary wildlife conservation efforts, and the retention of indigenous hunting rights among contemporary foraging populations (e.g., Stearman1994).
The use of foraging models derived from human behavioral ecology to interpret zooarchaeological assemblages is not surprising. Animal bones are often recovered in archaeological contexts and can provide one tangible, though not unambiguous, reflection of human dietary choice. The use of foraging theory is, in many ways, an outgrowth of preexisting rationales embedded in zooarchaeological analysis. The focus on quantitative measurements in optimality models such as costs and benefits builds on long-standing principles of food value and utility that guide traditional zooarchaeological analyses (e.g., Binford1978; White 1952,1953,1954). Nearly two decades ago, Grayson (1988,1989; Grayson and Cannon1999, pp. 142-143) noted the close parallels between the rationale underlying Binford’s (1978) utility analysis and foraging economics. In discussing the popularity and value of utility curves, for example, Grayson (1988, p. 123) noted: ‘‘These curves assume that people optimally forage across the body of an animal, as some believe people optimally foraged across larger landscapes.’’
While a variety of models explain prehistoric changes in subsistence and behavior using logic derived from foraging theory (e.g., Beck et al.2002; Surovell
2000; Zeanah 2004), my focus is on recent applications that directly address the interpretation of zooarchaeological assemblages.
My purposes in this review are threefold. First, to explain and understand why human behavior varies, we need to know something about the full range of behavioral variation. The zooarchaeological record is eminently designed to provide information about variability in human foraging behavior across time and space, and it potentially records behavior not recapitulated in contemporary or historic populations.
Second, case-specific examples in zooarchaeology are complementary to developments in foraging theory led by biologists and anthropologists and can enhance current methods in human behavior ecology (also see Grayson and Delpech1998, p. 1128). Foraging models were originally developed in biology and
anthropology and applied to the archaeological record. However, a number of recent zooarchaeological analyses have already identified and implemented important theoretical modifications that can direct future model building in allied disciplines (e.g., Burger et al. 2005; Metcalfe and Barlow 1992). A number of analyses use rigorous methodologies for testing among causal agents and particular hypotheses that can be more widely applied to other aspects of the archaeological record.
Finally, despite the overall success of these applications, a growing number of analyses highlight shortcomings in some of the assumptions underlying classic foraging models. Several analyses point to the lack of agreement between predictions derived from specific models and the archaeological evidence, while others question the standards used to evaluate resource profitability (e.g., Egeland and Byerly2005; Lupo and Schmitt2005; Stiner et al.2000). The recognition of these shortcomings should come as no surprise to analysts; classic foraging models were designed to be simple and have few assumptions for widespread applicability to nonhuman foragers. Many of the current controversies involving applications of foraging models in zooarchaeology mirror past and on-going discussions in biology and anthropology (e.g., Kacelnik and Krebs1997; Ydenberg1998; Ydenberg and Hurd1998; Ydenberg et al.1992). My intention is to draw attention to concepts and processes that are still poorly or incompletely understood. Recognition of these shortcomings does not diminish the value of foraging models but provides important avenues of future research.
Because most zooarchaeological applications of foraging theory use extended rationales or predictions derived from the specific models, I begin this review by briefly discussing the use of human behavioral ecology and the underlying rationale of the classic foraging models most often used in zooarchaeological analysis. Recent developments in risk theory and social foraging have applications to the archaeological record (e.g., Caraco et al. 1980; Kacelnick and Bateson 1996; Winterhalder1986; especially Winterhalder et al.1999) but thus far have not been applied directly to archaeofaunal analysis (but see Pinson 1990). I then discuss current difficulties linking foraging theory to the common units of analysis used in zooarchaeology. This is followed by a discussion of current applications of foraging models used to explain and predict patterning of different characteristics of archaeofaunal assemblages. Although these two uses are not necessarily mutually exclusive, I partition current applications into one of these two frameworks solely as an organizing device. I conclude by summarizing potential future areas of analyses that can strengthen the use of foraging economics in zooarchaeological analysis.
Human behavioral ecology and foraging models
Human behavioral ecology is a style of evolutionary thought that examines how environmental and ecological factors influence variability in human behavior (e.g., Cronk1991; Kelly 1995,2000; Smith and Winterhalder 1992; Smith et al.2001; Winterhalder and Smith 2000). This line of reasoning builds on concepts from evolutionary ecology, which examines the interaction between evolutionary forces and ecological variables by focusing on behavior (Broughton and O’Connell1999;
Winterhalder and Smith 2000). Application of human behavioral ecology to contemporary and prehistoric human populations began some three decades ago (Chagnon and Irons1979; Cronk et al.2000; Winterhalder and Smith1981). One of the most prominent and active research themes has been and continues to be the analysis of foraging behavior (e.g., Bliege Bird and Bird 1997; Hawkes and O’Connell 1981, 1985; Hawkes et al. 1982; Hames and Vickers 1982; Hill and Hawkes 1983; Smith 1991; Winterhalder 1981; Yesner 1981), but a number of recent applications of human behavioral ecology focus on a wide range of questions about life histories, parental investment, cooperation, and reproduction patterns (e.g., Alvard and Gillespie 2004; Bock 2005; Borgerhoff Mulder 2000; Hill and Hurtado1996; Mace and Eardley2004; Marlowe2004,2005; Smith2004; Voland
1998; Walker et al. 2002).
The basic premise of behavioral ecology is that organisms are designed by natural selection to optimize lifetime reproductive success and are capable of rapid adaptive shifts in behavior to contemporary environmental conditions, which can be broadly defined to include ecological, social, and political dimensions (e.g., Bliege Bird and Smith 2005; Giraldeau and Caraco 2000). Within behavioral ecology, foraging models or foraging economics consist of a set of models that purport to explain different aspects of an organism’s foraging behavior such as what to eat and where to forage (prey and patch choice models), when to leave a patch (patch choice and marginal value theorem), how far to transport resources and when and where to process a resource (central-place foraging models) (see Stephens and Krebs1986). Under certain circumstances, some of these questions, such as what to eat and where to forage, are interrelated and analysts often make use of several models to explore different dimensions of a foraging strategy.
An important feature of behavioral ecology is the use of quantitative tools such as optimization models to evaluate different strategies available to an organism (Emlen
1966; MacArthur1972; MacArthur and Pianka1966; also see Stephens and Krebs
1986). An optimization model is a quantitative tool used to assess the costs and benefits of different foraging strategies that defines (1) the range of available choices, (2) the currency used to evaluate those choices, (3) the presumed goal(s) of the organism, and (4) the constraints that limit the payoffs of different choices (Krebs and Davies1997; Smith 1983; Stephens and Krebs 1986). Two important and interrelated concepts underlie optimization analysis: the idea of trade-offs and the principle of lost opportunities. Trade-offs are the consequences to reproductive fitness resulting from pursuing one strategy over another (Smith1991, p. 35). The basic premise is that organisms unconsciously make trade-offs between strategies by comparing potential gains from exploiting a particular resource against the lost opportunity to do better by pursuing an alternate resource (Stephens and Krebs
1986, p. 11).
Currency refers to the units used to measure the costs and benefits of different decisions aimed at fulfilling the forager’s goal. The general assumption is that foragers maximize a goal function that is indirectly linked to reproductive fitness (Stephens and Krebs 1986). Thus, the currency used to assess the proficiency of different strategies depends on the foragers proximate goal and is assumed to be a good proxy measure of reproductive fitness (but see Salant et al.1995; Ydenberg
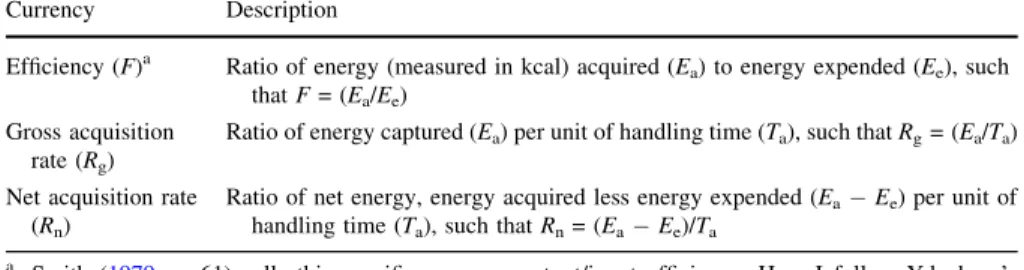
1998). Many simple and complex currencies can be used to assess the productivity of different resources, but rate maximization (as reflected by gross or net acquisition rates) and efficiency are the most common general currencies used in analyses (Table 1). Constraints include intrinsic and extrinsic factors that may limit the payoff derived from a strategy. Intrinsic constraints are those particular to the organism such as physiological limitations (i.e., gullet size, rate of digestion), nutritional requirements, and cognitive abilities (Dukas1998). Extrinsic constraints are those placed on the organism by the environment such as encounter rates with prey, daily or seasonal variation in resource availability and distributions, predator defense mechanisms of prey, and other ecological circumstances. Importantly, deviations between the predictions derived from any model and the observed patterns invite a reconsideration of currency, goal, and constraints.
Prey choice or diet breadth model
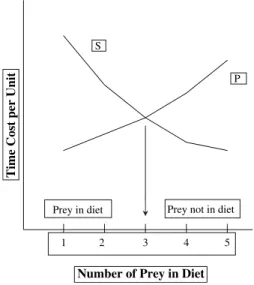
Probably the most widely used of all the foraging models is the prey choice or diet breadth model. The prey choice model assumes that a forager searches for all prey simultaneously and encounters them randomly and sequentially within the environment (the fine-grained environment assumption). Foraging time is parti-tioned into two mutually exclusive categories: search and handling (Fig.1). Because search is assumed to be randomized, the time devoted to searching for a resource is generalized across all of the resources. Handling time includes the time spent pursuing, processing, and consuming the prey after it has been encountered. Foragers rank resources on a single scale of profitability, usually kcals (kilocalories) obtained per unit of handling time (i.e., postencounter return rate). The basic assumption is that foragers attempt to maximize the long-term net rate of energy acquisition by adding resources into their diet in rank order from highest to lowest until the return rate per unit of time is maximized (e.g., MacArthur and Pianka1966; Pullam1974; Smith 1983). Three predictions follow from the prey choice model: (1) Foragers should always pursue high-ranked resources whenever they are encountered. (2) The inclusion of lower-ranked resources in the diet depends on the chance of encountering higher-ranked resources; lower-ranked resources are added into the diet as a function of the abundance of high-ranked resources and not as a function of their own abundances. (3) Resources are added to and deleted from the
Table 1 Examples of different common currencies used in optimality models (after Smith1979) Currency Description
Efficiency (F)a Ratio of energy (measured in kcal) acquired (Ea) to energy expended (Ee), such thatF= (Ea/Ee)
Gross acquisition rate (Rg)
Ratio of energy captured (Ea) per unit of handling time (Ta), such thatRg= (Ea/Ta) Net acquisition rate
(Rn)
Ratio of net energy, energy acquired less energy expended (Ea Ee) per unit of handling time (Ta), such thatRn= (Ea Ee)/Ta
a Smith (1979, p. 61) calls this specific currency output/input efficiency. Here I follow Ydenberg’s (1998) definition and designate this currency as efficiency
diet in rank order. A number of recent modifications to the classic prey choice model continue to expand and improve applications to accommodate circumstances that violate the assumptions of the original model, such as simultaneous prey encounters (e.g., Berec2000; Kacelnik and Krebs1997; Pyke1984; Schmidt1998; also see Stephens and Krebs1986).
The prey choice model generally predicts overall resource selection for combined samples of adult foragers in several well-known ethnographic contexts (e.g., Hames and Vickers1982; Hawkes and O’Connell1981,1985; Hawkes et al.1982; Hill and Hawkes1983; Hill et al.1987; Smith 1991). Some of the earliest anthropological applications of the prey choice model present data supporting some of the model’s predictions. Hill and Hawkes (1983) present data showing that some low-ranking prey (monkeys and small birds) drop out of the diet when Ache hunters use shotguns, which raise overall foraging returns, rather than the bow and arrow. Winterhalder’s (1981) analysis of hunting as practiced by the Cree in Ontario shows how the advent of high-velocity motorized search technology in recent times (snowmobiles and motorized boats) lowers the search costs of high-ranking prey and narrows the diet.
Yet some of the most rigorous studies suggest significant modifications to the prey choice model. Hill et al. (1987), for example, present data showing that resource selection among contemporary foragers does not always appear to maximize energetic gain (also see Bird and Bliege Bird1997; Hames 1989). Hill et al. (1987, pp. 11-12) found that Ache men could reap larger energetic rewards from exploiting palm (2,630 kcal/h) than by hunting (1,340 kcal/h). They attribute Ache men’s preference for hunting to differences between meat and carbohydrates
e mi Tt s o Cr e pU ti n P S
Number of Prey in Diet
Prey in diet Preynotin diet
1 2 3 4 5
Fig. 1 The diet breadth model after MacArthur and Pianka (1966) showing the two costs curves: search (S) and handling (P). The point at which the two cost curves intersect (here shown with an arrow) defines the optimal diet. Resources right of the arrow are out of the diet and those to the left are in the diet. Changes in where the two costs curves intersect changes the diet breadth. If, for example, search costs increase, the S curve will shift upward and increase the breadth of the diet
in the macronutritional content (also see Hill1988). Meat, and especially animal fat, may be highly valued because those products contain important amino acids, vitamins, and lipids not found in carbohydrates. They also suggest that possible nonconsumptive benefits such as access to more mates or better treatment of children associated with meat sharing might also shape resource choice. Hawkes (1990,1991; Hawkes et al.1991) identifies potential nonconsumptive goals such as social, political, or reproductive advantages gained by sharing meat a highly valued resource among Hadza big-game hunters. In a recent review, Smith (2004) outlines qualitative and quantitative evidence from five different ethnographic cases suggesting that hunting prey that are high risk, costly, or inefficient relative to other resources can signal specific qualities and confer a variety of nonconsumptive benefits such as enhanced reproductive success, social or political status, and increased economic advantages (e.g., Bliege Bird and Smith 2005; Smith 2004; Smith and Bliege Bird2000; Sosis2000; Weissner2002).
A second modification, suggested by Hill et al. (1987), closely parallels the findings in biology that state and context influence human foraging strategies (e.g., Bateson et al.2003; Houston1997; Houston and McNamara1999). Resource choice often varies as a function of the sex, age, composition of the task group, and other factors (e.g., Bird and Bliege Bird1997; Hurtado et al.1985; Jochim1988; Lupo and Schmitt2002,2005; Sosis2000; Weissner 2002). Women foraging with their offspring, for example, target resources that are easily handled by children or that can be efficiently taken in tandem (Hawkes et al. 1995). Children foraging by themselves focus on low-ranking but easily handled resources because physical constraints limit their ability to efficiently collect and process some foods (Bird and Bliege Bird 2000). These modifications, and others, do not invalidate the use of predictive value of the prey choice model but clearly show a higher degree of complexity underlies human resource choice than once imagined.
Patch choice model
The assumption of a fine-grained environment is not universally applicable to all types of prey taken by human hunters. Some resources occur in patches, clumps, or cluster in specific microhabitats. Ethnographic studies show that human hunters often choose to exploit specific microhabitats for particular prey and arm themselves with the most appropriate hunting technology in anticipation of encountering those resources. Whenever resources are distributed in patches, foragers face the problem of deciding which set of patches to include in their foraging regime. The patch choice model was developed to predict which patches a forager will exploit (MacArthur and Pianka 1966). As discussed by Smith (1991, p. 249), resource patches can be defined as ‘‘spatially bounded entities characterized by the set of prey (of one or more types) contained within it and by the predictable (expected) return rate curve or gain function.’’ However, patches do not need to be so strictly defined and can refer to any entity with a predictable gain function. Thus, a patch can be an individual prey item, a foraging strategy (i.e., hunting or gathering), or a specific habitat type or a type of hunt, which can be defined by habitat, technology,
and/or prey type. Smith (1991), for example, made use of the patch choice model by dividing Inujjuamiut resources into hunt and habitat types and evaluating their productivity at different temporal scales (seasonal vs. monthly).
Some of the same assumptions underlying the prey choice model apply to the patch choice model. Travel (called search in the prey choice model) and handling time are partitioned into two cost curves; resource patches are encountered randomly and sequentially in the environment and are ranked on single scale of profitability (the expected return rate). The model assumes that foragers evaluate the average return rate from different patches (including the travel time) and add patches into the diet in rank order until the average foraging returns per unit (including travel time) declines.
When used in concert with the marginal-value theorem (MVT), the patch choice model can be used to predict when a forager should leave a patch for another in circumstances where the foraging process gradually depletes the patch (Charnov
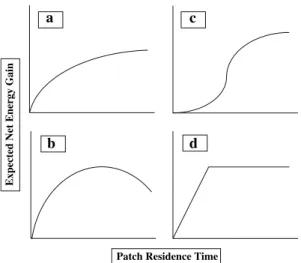
1976; Charnov et al.1976). This depletion scenario is probably very common for a variety of resources, but not all (Fig.2; for alternate depletion scenarios see Smith
1991, p. 252; Stephens and Krebs 1986, p. 26). The MVT makes the following assumptions: Resource patches have a gain function that negatively accelerates as a function of patch time (Stephens and Krebs1986, p. 26), foraging time in the patch is limited, and resource regeneration time is high. The optimal time to leave the patch is when the marginal capture rate (defined as the instantaneous capture rate at the end of a foraging period within the patch) is equal to the overall mean capture rate (including travel times between patches) for all resource patches in the habitat.
a
b d
c
Expected Net Energy Gain
Patch Residence Time
Fig. 2 Examples of different hypothetical gain functions (after Stephens and Krebs1986, pp. 25-26). (a) An exponential gain function that increases asymptotically to some maximum value and generally describes within-patch gains. (b) A humped gain function that shows net gains as the patch becomes depleted. In this case eventually as more time is spent in the patch, more energy is spent searching for prey than can be gained from the patch. (c) A sigmoid gain function that defines circumstances where mobile resources are able to avoid a predator but are eventually discovered in clusters. (d) An example of a gain function that depletes but does not show patch depression
Several predictions follow from the model: (1) A forager should leave the patch when it is depleted to the point where foraging in another patch will yield higher returns per unit of time (including travel costs). (2) Because the optimal time allocation in any patch is a function of the average yields for all patches in the habitat, as the overall productivity of the habitat increases, less time should be spent in any one patch and conversely. (3) With changes in travel costs, the lower the travel costs between patches the less time should be spent in any one patch and conversely. (4) Any patch not in the utilized set will not be added unless it can yield a marginal rate of return equal to or greater than the average rate for all utilized sets. As pointed out by Smith (1991), the use of the patch choice model and MVT is most appropriate for answering questions about time allocation. The use of this model requires that the analyst know something about the gain functions and availability of other resource patches in the habitat (also see Sosis 2002). It is possible, for example, that the return rate from some other patch(es) may increase and alter the utilization of a patch originally exploited by a forager, even though the profitability of that patch remains unchanged. This important requirement makes the patch choice model difficult to test in anthropological and archaeological contexts because the researcher may not know all patches or their gain functions. Furthermore, not all patches deplete in exactly the same manner, and some may be nondepleting (Fig.2; see Smith1991).
Ethnographic applications of the patch choice model show that hunters often allocate more time to the most profitable patches but do not necessarily forage exclusively in the most highly profitable patches because of variability in returns as a function of seasonal and daily fluctuations, as well as individuals goals (e.g., Hames1989; O’Connell and Hawkes 1984; Smith 1991; Sosis 2002). The patch choice model has been especially useful for explaining apparent cases of conservation among aboriginal hunter-gatherers, such as patch switching, when game becomes depleted in localized areas (e.g., Dwyer 1982). Studies show that when return rates from patches close to a permanent settlement become depleted, hunters venture to more productive patches that are further away (Alvard 1993,
1994; Hames1987,1991; Vickers1988), resulting in epiphenomenal conservation. Alvard (1993, 1994), for example, found that Piro hunters in Peru focused on hunting areas more distant from residential bases where returns were higher but still opportunistically exploited prey encountered as they passed though depleted zones in close proximity to their village. In this particular case, patch switching cannot be viewed as intentional conservation and is more consistent with behavior anticipated by the patch choice model (Smith and Wishnie2000).
Central place foraging models
Central place foraging (CPF) is an umbrella term that refers to several different models that examine the behavior of nonhuman foragers who transport resources to a central place to consume and/or provision offspring (Orians and Pearson1979; Schoener1979; Stephens and Krebs 1986), store (Elliott1988) or engage in other activities (Guerra and Ades 2002). CPF models were originally developed by Schoener (1979) and Orians and Pearson (1979) to model resource choice for
predators transporting prey to consume or provision. CPF models consider how the costs of transporting a resource influences resource choice, load size, distances between foraging patches, the placement of central places, and the degree to which prey are processed (Kaspari1991). Cumulatively, applications of CPF models show that at greater distances from central places, organisms become more selective by transporting loads/prey that are larger sized (Cuthill and Kacelnik 1990; Elliott
1988; Fryxell et al. 1991; Jackson 2001; Stephens and Krebs 1986, pp. 187-194) and/or have a higher nutritional value (Sodhi1992).
In an anthropological context, CPF rationale has been applied to the selective transport of different large-prey skeletal parts (e.g., O’Connell et al.1988,1990). Based on observations of contemporary East African Hadza big-game hunters, O’Connell et al. (1988, 1990) found that (1) the number of transported bones decreased with increasing distances between kill to residential sites; (2) carcasses were often field processed by filleting meat from high-value parts such as upper limbs, and the stripped bone was discarded in the field; and (3) there was a high degree of taxonomic variation in transport decisions even among prey that were similar in body size. They argue that skeletal transport decisions are based on the trade-offs between the costs and benefits of field processing and transporting different parts with the overall goal of maximizing the amount of nutrients returned to camp within a limited time frame (e.g., Metcalfe and Barlow1992). They suggest that parts with high processing costs and a large amount of edible nutrients relative to part weight have a higher probability of being field processed and discarded than parts with low field processing costs and low ratios of edible to tissue to part weight (O’Connell et al.1990).
A formal model proposed by Metcalfe and Barlow (1992) builds on the classic CPF theory developed by Orians and Pearson (1979). This model assesses how human foragers trade off the time spent field processing a resource against the costs of transporting an unprocessed load of that resource with the goal of maximizing the rate at which nutrients are returned to a central location. Key elements in their model include the time it takes to process a load and increases in load utility and decreases in transport costs resulting from field processing. They propose an inverse relationship between improvements in load utility and the minimum distance at which it becomes efficient to process a load. Processing that realizes a large gain in load utility will decrease the maximum distances from central locations at which field processing becomes efficient and conversely. The model further assumes that processing resources at central places has no costs or that the costs are incurred by someone other than the person who transported the load. This assumption may be warranted because some (but not all) food processing at residential camps can often be conducted in tandem with other activities such as child care or can take place at night when foraging is not possible. In these cases, food processing at base camps may have few, if any, opportunity costs. Metcalfe and Barlow (1992) demonstrate the usefulness of this model for understanding the field processing and transport decisions of simple, sessile resources that consist of high- and low-value components such as nuts and shellfish (see also Bird and Bliege Bird 1997). For some simple resources, field processing can increase load utility because low-value parts with no consumptive value are discarded and more useful products can be transported in fewer trips.
The model requires modification when applied to more complex resources, such as animal carcasses, that are composed of several different products with different caloric and nutritional values and that require sequenced processing to exploit (i.e., meat must be removed before bone marrow can be extracted). Unlike some renewable resources found in patches, carcasses are nonrenewable and time-limited and must be consumed and/or transported or stored within a relatively short time frame. For most (but not all) carcasses, forager processing and transport decisions are made within the context of each discrete event and are usually not linked to anticipated future repeated visits to the resource. Further modification to the model is required if field processing can result in the discard of edible product (see Lupo
2006). Even if the meat and marrow are removed from a body part, stripped bone may still retain grease, remnant marrow, and bits of adhering meat that will be unrealized if the bone is discarded at field locations without further processing. Under these circumstances, any potential increase in load utility resulting from culling low-value inedible bone can be greatly devalued if large amounts high-value remnant edible product are discarded (for a solution see Lupo2006).
Using ethnographic transport data derived from contemporary Meriam Islanders on the Torres Strait, Bird and Bliege Bird (1997) demonstrate the value of this model for predicting the maximum terminal foraging distance (MTFD) for processing shellfish loads. The Meriam processed shellfish in such a way as to maximize the rate that edible flesh is delivered to a central place. Shellfish species that are difficult to field process and that will not significantly increase the proportion of edible flesh transported if they are processed are transported whole and generally collected from areas in close proximity to camps. Those that are easily field processed and increase the proportions of transported edible flesh when processed are taken at greater distances from camps and are processed at field acquisition locations. Thomas (2002) uses a similar approach to evaluate shellfish processing among the Western Kiribati in Micronesia.
Jones and Madsen (1989) propose another model that assumes a resource load will not be transported beyond the maximum transport distance (MTD) or the point where the energetic expenditure for carrying the load exceeds its caloric value (but see Hitchcock and Houston1993; Ydenberg1998, pp. 348-349, 355). This approach is best used to rank the relative transport distances of resources from their place of procurement, rather than to calculate absolute MTD (Madsen et al.2000), because transport costs are difficult to measure accurately and can vary as a function of terrain, grade, body mass, mass of burden, shape of package, ambient temperature, and ontogenic factors (see Brannan1992; Burstein et al.1996; Heglund et al.1995; Knapik et al.1996; Kramer 2004; Legg and Mahanty 1984; Maloiy et al. 1986; Mudambo et al.1997; Rhode1990; Spinney1995).
Zooarchaeological quantification units and foraging theory
One central difficulty of applying foraging theory to archaeofaunal analysis concerns how zooarchaeological quantification units are linked to the currencies used in the models. As discussed by Grayson and Delpech (1998), the units used to
quantify zooarchaeological remains are not the same as those used to test optimality models in biological or ethnographic contexts. Furthermore, the questions about behavior addressed by some of the models are not the same as those often asked of the archaeological record (i.e., patch time allocation). Archaeological and ethno-archaeological research identify several significant issues surrounding the applica-tion of foraging models to zooarchaeological analysis concerning (1) how prey is ranked, (2) how standard zooarchaeological quantification units correlate with proxy measures of rank, and (3) what dimensions of diet breadth zooarchaeological units actually reflect.
Resource rank in zooarchaeological analysis
Few zooarchaeological analyses rely on actual return rates derived from experi-mental, historical, or ethnographic sources (e.g., Egeland and Byerly2005; Lupo
1998; Madrigal and Holt 2002; Raab 1992). The problems with ethnographically and experimentally generated return rates are discussed elsewhere (see Bettinger
1991, 1993; Bettinger and Baumhoff 1982, 1983; Broughton and Grayson 1993; Grayson and Cannon1999; Simms 1987; Zeanah and Simms1999) and are only summarized here. One of the main problems is that the current range of published return rates are derived from a limited number of sources (e.g., Hawkes et al.1982; Hill and Hawkes1983; Kelly1995; Lindstro¨m1996; Lupo1998,2006; Lupo and Schmitt1997b,2002,2005; Raymond and Sobel1990; Simms1987; Smith1991; Winterhalder1981). Even as these sources grow, the range of variation reflected in these data may not sufficiently represent the past.
Replicative experiments with aboriginal technologies can fill the gaps left by ethnographic and historical sources (e.g., Egeland and Byerly2005; Madrigal and Holt2002; Madsen and Kirkman 1988; Madsen and Schmitt1998; Simms 1987), but modern experiments generated by novices can significantly misrepresent the potential gains from specific resources (Bettinger 1991, 1993; Bettinger and Baumhoff1983; Grayson and Cannon1999). Because return rates vary as a function of acquisition technology and context (see Bettinger and Baumhoff1983), analysts may be unaware of all potential acquisition contexts and technologies available to prehistoric populations (Bettinger 1991) and are limited to those circumstances described in the ethnographic and historic records.
Recent archaeological investigations further question the ordering of resources based on energetic returns (e.g., Perry 2004; Wohlgemuth 2004). Wohlgemuth (2004), for example, found incongruencies between the frequencies of low- and high-ranked plant resources at Pie Creek Shelter, Nevada, given the assumption that resources are added into the diet in rank order based on postencounter return rates. Deviations between resource rank and the order in which it is incorporated into the diet were originally discussed by Simms (1987) in his seminal application of the diet breadth model. Using ethnographic, historic, and experimental data, Simms (1987) calculated return rates for common plant and animal resources exploited by ethnographic populations in the Great Basin to evaluate questions about when certain resources should enter the diet. He found that some small prey and plant seeds exploited in the ethnographic record are not predicted by the optimal diet. He
accounted for this discrepancy by the failure of the model to adequately account for the storage value of seeds. The storage value of many resources may make them more valuable than might be anticipated solely by their energetic return rate (see Hitchcock and Houston 1993), including some specific prey or body parts (e.g., Speth 1983). Animals that seasonally store large quantities of body fat for hibernation could be preferentially ranked higher than other similarly sized prey that do not store large quantities of body fat (e.g., Speth1983; Speth and Spielmann
1983). Foraging human populations may selectively process fat-rich bones even though the caloric returns from bone grease are quite low when compared to other resources. Bone grease, albeit time intensive to exploit and with low yield, is composed largely of fat, which is nutritionally important to human populations (e.g., Lupo 2006; Lupo and Schmitt 1997b; Saint-Germain 1997; Speth 1983). More importantly, some types of animal fats are highly storable and, when combined with other resources, can provide a crucial food source in times of scarcity.
Proxy measures of rank and prey body size
One solution to the problems generated by the use of return rates is to rely on proxy measures of resource rank. Zooarchaeologists often make use of the strong generalization from the existing data, which show a positive relationship between prey body size and return rate (see Hawkes et al.1982; Simms1987). A corollary idea is that prey of similar body size and overall anatomical proportions have similar relative ranks and may be considered as a group (e.g., Grayson and Cannon
1999; Simms 1987; but see Jones2004; Smith1983). Groups of larger-sized prey such as artiodactyls are ranked higher than those of smaller size such as rabbits and hares. This assumption allows zooarchaeologists to make use of fragmentary remains that can be identified only to genera or size class and quantify aggregate specimen counts with indices of prey abundance based on body size or prey type (i.e., large mammals, small mammals, aquatic animals, etc.). Empirical ethno-graphic and experimental studies show that when animals are acquired individually, larger prey are usually ranked higher than smaller animals (e.g., Hawkes et al.1982; Kelly 1995; Simms 1987; Winterhalder 1981). There are, however, important exceptions to this generalization. Extremely large-bodied prey such as whales or some pinnipeds often have excessive handling costs that depress their rank relative to overall body size (e.g., Byers and Ugan2005; Jones 2004; Smith1991). Mass collecting dense patches of some small and low-ranked prey can be more profitable than might be predicted based solely on body size (Madsen and Kirkman 1988; Madsen and Schmitt1998; Schmitt et al. 2004).
Recognition that prey profitability varies as a function of circumstances of capture and hunting technology has led some to suggest modifications to current prey ranking systems (Grayson and Cannon 1999, p. 150; Jones 2004, 2006). Grayson and Cannon (1999) suggest that prey that can be acquired by mass-collecting technology should be considered separately from animals that are individually acquired. Using collated data from a variety of sources, Ugan (2005a) argues that the increase in return rates from mass collecting are significant only for smaller fish and insects. He argues that there is no substantial increase in return rate
from mass collecting smaller terrestrial prey such as small mammals and birds over the individual acquisition of these same resources. In fact, for some (but probably not all) smaller mammals, encounter hunting of single animals provides a higher return rate than mass collecting (also see Lupo and Schmitt2005).
Ugan suggests that low returns from mass collecting small mammals and birds result primarily from the higher processing costs of these prey in comparison to insects and small fish, which have low processing costs. These results challenge the problem of ranking prey by body size raised by mass-collecting technology; they do not completely vindicate the technique. Although Ugan admirably assembles all available data, the current database is small and does not cover a wide range of ecological and cultural contexts. Ethnographic and ethnoarchaeological studies of hunters using mass collecting show that while individual returns from mass collecting can be lower than those that can be achieved by encounter hunting, other foraging benefits not solely measurable in energy often accrue to the participants (Lupo and Schmitt 2002, 2004). These additional benefits can take the form of increased encounters with other types of resources and potential social benefits associated with mass collecting (see Lupo and Schmitt 2002, 2004, 2005; Noss,
1995). Furthermore, the lack of correlation between prey rank and body size remains a problem for some larger prey with excessive handling costs (see Jones
2004; Smith 1991).
As discussed by Lyman (2003), ranking prey by body size is also problematic for highly sexually dimorphic species such as some pinniped species, in which males can be more than twice as large as females. Ranking these prey by body size can create dubious distinctions in prey value and obscure important differences in predatory defense mechanisms that may change the costs of pursuing different animals. This potential problem is not necessarily fatal, however, and can be easily controlled by the analyst’s awareness of the range of species, including the degree of sexual dimorphism and predator avoidance behavior, within a specific assemblage.
Stiner (2001; Stiner and Munro2002; Stiner et al. 1999,2000; see also Munro
2004) found that measures of faunal diversity based on Linnean divisions or body size are not sensitive enough to show subsistence changes that were known to have occurred in the Paleolithic record of Europe and Eurasia. Standard taxonomic measures and abundance indices do not show an expansion of the diet supported by other classes of material evidence such as botanical remains, the frequency of milling stones, storage facilities, and human skeletal evidence (Richards et al.
2001). Stiner argues that the differences in the costs of capture may be more significant in the ranking of smaller prey and that these differences will not be reflected in rankings based on body size. By focusing on locomotor habits, predator defense mechanisms, and resilience to predation of the smaller-sized faunal component, she demonstrates a shift from slow-moving and sessile resources such as tortoises and shellfish during the Middle Paleolithic to a greater reliance on fast-moving but small prey (i.e., rabbits and birds) in the Upper Paleolithic. She argues that prey ranking schemes should consider physiologic and behavioral character-istics that limit a hunter’s access to prey (also see Lyman2003). A consideration of these characteristics is likely to be most useful and potentially provide a greater degree of resolution for ranking prey that are similar in body size.
Units of measurement and diet
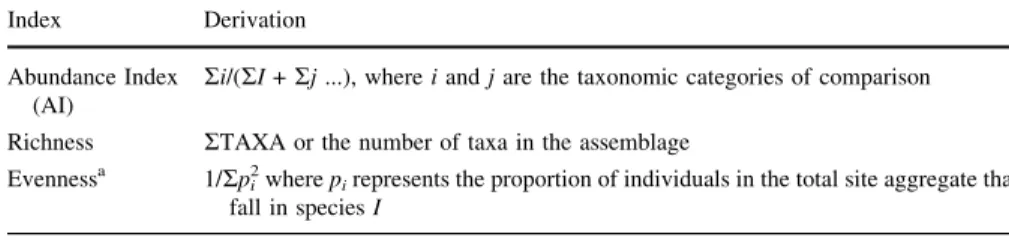
A variety of complex and simple measurements are used to monitor changes in zooarchaeological assemblages, such as abundance indices (AIs) and measures of taxonomic diversity (Table2). Abundance indices combine groups of taxa into a single measurement usually based on body size. Diversity measurements have a long history of use in archaeological analyses (see Grayson 1984, 1991) and are often measured in zooarchaeological assemblages by RTAXA and evenness.
RTAXA (the number of different taxa in an assemblage) is often used to characterize assemblage richness. Evenness reflects the distribution of bone specimens among different taxonomic categories and can be measured by several different indices (see Jones2004). Regardless of which measurement is used, most zooarchaeological applications assume a positive relationship between archaeolog-ical abundances and the encounter rate with high-ranking prey on the landscape (but see Simms1987, p. 24; Waguespack and Surovell2003, p. 337). Higher encounter rates with high-ranked prey result in increased abundances of those animal remains in zooarchaeological assemblages (but see Waguespack and Surovell2003, p. 337). Obviously, any assumption about the meaning of archaeological abundances must be very carefully evaluated. Well-known issues arising from the use of zooarchaeological data in general, such as preservational bias, taphonomic history, sample size, excavation techniques, analyst methodology, and space and time compression, can significantly and selectively impact faunal abundances and the resulting interpretation (e.g., Cannon1999,2001; Cruz-Uribe1988; Grayson1984; Grayson et al. 2001; Schmitt and Lupo 1995, 2005). Analysts need to carefully evaluate the differential impact of these potential biases before making inferences, but even in the face of careful analysis, zooarchaeologists are beginning to explore what dimensions of the diet these units actually measure (e.g., Broughton and Grayson1993; Jones 2004; Lupo and Schmitt 2005; Ugan and Bright2001).
RTAXA is believed to be a gross measure of expansion of the faunal component of diet breadth (i.e., broader diet = more taxa). The assumption is that decreases in the encounter rate with high-ranking prey can result in a broader or more diverse diet, but as several analysts have shown, this is not always true (see Grayson and Cannon1999, p. 149; Stiner2001; Stiner et al.2000). Given the aggregated nature of the archaeological record and possible effects of time compression and variability in human foraging strategies,RTAXA likely reflects the maximum range rather than
Table 2 Examples of some common simple and complex indexes used to monitor dietary changes in
zooarchaeological assemblages Index Derivation Abundance Index
(AI)
Ri/(RI+Rj...), whereiandjare the taxonomic categories of comparison Richness RTAXA or the number of taxa in the assemblage
Evennessa 1/Rpi 2
wherepirepresents the proportion of individuals in the total site aggregate that
fall in speciesI
a
an average diet breadth for a prehistoric population (also see Broughton and Grayson1993; Grayson and Delpech1998).
Evenness is often assumed to reflect decreased encounter rates with high-ranked prey as the diet expands. As discussed by Jones (2004, p. 308), because low-ranked resources are added into the diet as a function of the encounter rate with high-ranking prey, the total numbers of low-high-ranking resources will not reflect the encounter rate of those resources. She found that evenness values vary as a function of the encounter rate with high-ranking prey, the total number of prey items in the diet, and the degree to which high-ranking prey are similar in return rate. The latter two factors can be controlled by complementing the use of evenness with other analyses (such as richness) and examining the kinds of prey in the diet. Using ethnographic data on Inujjuamiut hunting collected by Smith (1991), she found that evenness values tracked encounter rates with high-ranking prey but noted the potential problems with using evenness in archaeological assemblages arising from mass collection and the presence of multiple high-ranking prey. When two (or more) high-ranking resources with similar return and encounter rates are exploited, evenness values will increase if archaeologists treat them as different prey types even if the encounter rates with the highest-ranked prey do not change (also see Kimball2004, for the effects of multiple high-ranking prey on evenness).
Explanatory frameworks in zooarchaeology
A large number of analysts view different characteristics of archaeofaunal assemblages as reflecting changes in foraging efficiency resulting from anthropo-genic or natural processes (e.g., Broughton1994a,b,1997,1999,2002; Butler2000,
2001; Byers and Broughton2004; Byers et al.2005; Grayson1991,2001; Grayson et al. 2001; Munro 2004; Wolverton 2005). Increases or decreases in foraging efficiency can be linked to many different anthropogenic and natural phenomena. Anthropogenic phenomenon can include changes in technology that alter the costs of searching for and/or handling prey (e.g., Hawkes and O’Connell1992; Hill and Hawkes 1983; Winterhalder 1981), changes in how populations organize them-selves on the landscape (e.g., Binford 1980), and changes in the value of nonconsumptive benefits derived from pursuing high-ranked prey (e.g., Hildebrant and McGuire 2003). Modifications to local habitats such as environmental degradation due to agricultural activities can attract some types of small mammals (e.g., Quirt-Booth and Cruz-Urube1997) and depress the abundances of others (e.g., Peacock et al.2004; Redford and Robinson1987; also see Stahl1996). Intentional burning of vegetation serves many different functions, including possibly increasing the encounter rates with some types of prey. Recent ethnographic research among the Martu aborigines in western Australia shows that intentional burning of vegetation has the short-term benefit of increasing the efficiency of women’s hunting of small prey in some habitats (Bird et al.2005). The long-term benefits to the hunting efficiency of large prey are not clear, but anecdotal evidence suggests that larger game might be attracted to new growth (e.g., Bird et al.2005; Bowman
degradation from agricultural practices, deforestation, and intentional fire setting can create new habitats and destroy old ones. They are not always detrimental to wildlife and can actually improve habitats for some herbivores.
Probably the most widely recognized anthropogenic influence on prey encounter rates is exploitation depression resulting from overhunting (e.g., Broughton1994a,
b,1997,1999; Butler2000; Kay1994; Smith and Wishnie2000). Overhunting has particularly strong and predictable implications for changes in human foraging efficiency because the prey choice model predicts that foragers will target high-ranking prey and pursue them whenever these animals are encountered (Grayson
2001; Penn 2003; Winterhalder and Lu 1997). Consequently, overhunting should preferentially influence encounter rates with high-ranking prey. Prey overhunting is documented by a number of contemporary ethnographic, historical, and wildlife conservation sources, and there is good reason to believe this process also operated in some places and times in the past (e.g., Alvard1993,1994,1995; Aswani1998; Hames1987; Jerozolinski and Peres2003; Kay1994; Laliberte and Ripple2003; Penn2003; Simenstad et al. 1978; Steadman1995; Vickers1994).
In contemporary contexts, the degree to which harvesting pressure is manifested by declining abundances of particular species depends on a number of factors related to human populations; most significant among these are the population density and the age of the settlement (Redford and Robinson1987; Vickers1988). Physiologic aspects of the prey and threat type also influence susceptibility to harvesting pressure (Cowlishaw et al. 2005; Isaac and Cowlishaw 2004). Larger-bodied prey generally reproduce more slowly and are found in lower densities on the landscape than smaller prey and thus are less likely to rebound from hunting pressure (Mittermeier 1987; Vickers 1991; Winterhalder and Lu 1997). Citing several different studies, Mannino and Thomas (2002, p. 456) note that the resilience of different shellfish species to overexploitation depends, in part, on species habitat, geographic distribution, and life history characteristics (also see Pimm 1991). Although the role of human hunters in animal extinctions on a continental scale is controversial (e.g., Barnosky et al.2004; Grayson and Meltzer
2002,2003,2004; Haynes2002; Haynes and Eiselt1999; Martin1967,1984,1990), there are recent and historical examples from island habitats where overhunting likely played an important contributory role in the extinction of a species (e.g., Anderson 2002; Burney et al. 2003; Duncan et al. 2002; Kirch 1996; Steadman
1995; see especially Grayson 2001).
Even so, studies also show that hunting does not always lead to exploitation depression and can be sustained under a variety of conditions, especially when population densities are low, settlements dispersed, and traditional hunting technologies prevail (see Hill et al. 1997, 2003; Leach and Davidson 2001; Mannino and Thomas2002; Penn2003, p. 278; Vickers1988,1991). Winterhalder and Lu (1997) model how adding a species to the diet or prey switching could temporarily allow high-ranking prey to rebound after being depleted. Importantly, they demonstrate that ‘‘ a resource species’ vulnerability to a predator sometimes will depend on the suite of resources that are harvested along with it’’ (Winterhalder and Lu1997, p. 1363). Butler and Campbell (2004) recently found no evidence of resource depression in their analysis of 63 archaeological sites spanning
10,000 years from the Northwest Pacific Coast and the northern Columbia Plateau despite evidence of sustained hunting, increasing population densities, and the development of complex hunter-gatherer social organization in coastal areas (also see Etnier2002; Lyman2003).
Natural phenomena can include processes that temporarily influence prey encounter rates and those that can change the absolute abundances of different prey. Behavioral depression can result when prey seasonally change their spatial location or avoid areas in response to predation (Charnov et al. 1976). Microhabitat depression occurs when prey relocate to another area to avoid predation. These changes do not result in an absolute decline in prey abundances and may only temporarily change the encounter rates with prey. Changes in the absolute abundances of prey or exploitation depression from overhunting also can be associated with nonhuman predators, especially the introduction of new predatory species by humans or via migration and colonization (e.g., Grayson2001; Johnson and Wroe 2003). Less well recognized are changes in the density of nonhuman predators, which also can have a systematic effect of ecological communities (Mannino and Thomas2002; Simenstad et al.1978). Geological phenomena such as earthquakes, tsunamis, and volcanic activity can change prey (and human) population densities and distributions (e.g., Losey 2005; also see Stahl 1996), as can disease (e.g., Gifford-Gonzalez1998; Macphee and Marx1997). Probably the most widely recognized natural influences on prey encounter rates are climatic changes that can diminish or expand favorable habitats or conditions (Byers and Broughton 2004; Byers et al. 2005; Grayson 2006; Grayson and Delpech 1998,
2005; Grayson et al. 2001; Lupo and Schmitt 1997a; Schmitt and Lupo 2005; Schmitt et al.2004; Ugan2005b; Wolverton2005).
Clearly, both anthropogenic and natural phenomena can simultaneously influence prey abundances and distributions and assessing the relative importance of either of these factors can be difficult (see Butler and Campbell2004; Leach and Davidson
2001; Ugan 2005b). The dynamic link between dietary change and resources availability is quite complex. Resource depression, for example, can result from complex interactions among a variety of anthropogenic and natural phenomena (see Stahl 1996). The reduction in one species, regardless of the cause, can have a cascading effect on larger ecological communities and the availability of many other resources (e.g., Simenstad et al.1978).
Anthropogenic exploitation depression models
Probably the most widely used and elaborately developed zooarchaeological applications of foraging theory identify declining foraging efficiency resulting in resource intensification associated with anthropogenic exploitation. Resource intensification refers to the process whereby total productivity per unit of land is increased, but at increasing costs to the individual resulting in a decline in foraging efficiency. The definition of resource intensification has multiple meanings in current anthropological literature. As noted by Butler and Campbell (2004, p. 336), intensification as used in models of resource depression refers to decreases in
foraging efficiency ‘‘wherein the total productivity of a unit of land is increased but individuals work harder (spend more energy, per unit time) in the process.’’
In most archaeological analyses, resource depression refers to decreases in the absolute abundance of prey from aboriginal overhunting resulting from increases in local human population densities (in situ growth or packing) (e.g., Broughton
1994a,b,1997,1999; Butler2000,2001; Grayson1991,2001; Nagaoka2002a,b; Stiner et al. 2000). In general, foragers are predicted to pursue high-ranking prey within a patch whenever it is encountered. As the local abundance of high-ranking prey becomes depleted, foragers may respond to declining foraging efficiency in several different ways depending on their circumstances. Central place foragers can travel to distant resource patches (or buffer zones) to acquire high-ranking prey but will incur additional costs by traveling to and transporting prey from distant patches to residential camps. Mobile foragers may move their residential camp closer to distant patches but will incur relocation costs (see Grayson and Cannon1999; Kelly
1995) or may meet resistance and/or competition from entrenched neighboring groups (see Hickerson1965; Martin and Szuter1999; but see Lyman and Wolverton
2002). As high-ranking resources decrease in abundance, foragers may respond by incorporating lower-ranking but locally available prey (or patches) into the diet, increasing the number of patches used and/or intensifying how prey (or patches) are exploited (Broughton1994a,b, 1997, 1999; Cannon 2000; Nagaoka2001,2002a,
b).
However, and as pointed out by Grayson and Cannon (1999, p. 148; see also Butler and Campbell2004, p. 338), declining abundances of high-ranking prey in concert with increasing abundances of low-ranking prey is not unequivocal evidence of exploitation depression. A similar pattern might be expected if smaller and lower-ranking prey use increases and the encounter rate and use of larger prey remains the same or increases at a slower pace than the use of smaller animals (Grayson and Cannon1999). The advent of mass-collecting technology can increase the abundance of certain small prey relative to larger prey without changes in the encounter rate with high-ranking prey. Larger human population sizes also could result in a per capita decline in large prey but not change the absolute abundance of high-ranking prey (Broughton1994a,b; Butler and Campbell2004).
Models of resource depression have strong appeal because they often combine rationale from several different foraging models and rely on multiple (albeit intersecting) classes of faunal evidence and levels of analysis. The use of multiple threads of foraging rationale to link different lines of archaeofaunal evidence is nowhere more well developed than in the analysis of the Emeryville Shellmound in California (Broughton1994a,b,1997,1999,2002). This single case study of a site spanning from 2620 to 720 B.P. stands as the model for subsequent studies in exploitation depression and comprises a large piece of evidence used to infer localized resource depression in the Sacramento Valley, California. This study and a number of subsequent analyses rely on abundance indices that combine similarly sized or types of prey. Where appropriate, analysts partition and analyze prey resources by habitat, hunt type, or patch (i.e., coastal vs. inland, upland vs. valley). This allows analysts to control for the patchy distribution of prey within different habitats and maintain the fine-grained search assumption that underlies the prey
choice model (Broughton1997). Independent evidence of resource intensification and harvesting pressure is crucial to support the inference of overhunting (see Grayson and Cannon1999, p. 146). As outlined by Broughton (1999,2002), several different lines of zooarchaeological evidence can be used to further support an inference of resource depression, including mortality profiles, taphonomic damage, and skeletal part profiles.
Changes in prey mortality profiles are one line of evidence often used to infer harvesting pressure. Differences in animal physiology, behavior, and spatial characteristics influence how harvest pressure is manifested, thus the evidence for overexploitation tends to be prey-specific. For example, Broughton (2002) summarizes evidence for terrestrial and aquatic resources that can be used to support inferences of resource depression, and Mannino and Thomas (2002) review evidence that might indicate the overexploitation of shellfish. Harvesting pressure can be manifested in animals not susceptible to behavioral depression and characterized by discrete breeding areas by a decrease in the mean and maximum ages of exploited specimens (Broughton2002). Harvesting pressure can decrease the mean and maximum ages of exploited specimens because (1) larger and older individuals that have a higher return than smaller and younger individuals will be preferentially targeted by hunters; (2) as mortality increases, even if it is unbiased, intraspecific competition will decrease and increase the recruitment of juvenile specimens; and (3) increased mortality leads to a decreased probability of surviving into adulthood as the average lifespan decreases (Broughton2002). For species that grow throughout their lifetime, such as shellfish, reptiles, and fish, size is correlated with age, so evidence of harvesting pressure can be manifested by a decrease in overall prey size. As the frequency of preferred larger individuals declines, smaller individuals are targeted. Archaeological evidence of harvesting pressure has been documented in fish through decreasing sizes of dentary width (Broughton 1997,
2002; Butler2001), the humeral shaft diameter of tortoises (Stiner et al.2000), and size of molluscan shell (e.g., Anderson1981; Botkin1980; Stiner et al.2000; also see Thomas2002).
Decreasing mean age at capture also can reflect harvesting pressure on some gregarious herd animals with restricted growth, such as gazelles. As discussed by Munro (2004), hunters should target adult gazelles with the greatest body weight and highest percentage of body fat to lean meat compared with younger animals. Mortality profiles dominated by prime age adult animals indicate low harvesting pressure, but as adult mortality increases, the population falls below carrying capacity, reducing intraspecific competition and the population undergoes growth. High proportions of juvenile animals are expected in a population undergoing growth because of the high turnover. Munro (2004) documents an increase in juvenile gazelle remains based on tooth wear and eruption sequences and the abundance of unfused elements during the Natufian period from several sites in the Levant, in concert with other evidence of resource depression and intensification.
In other species, hunting pressure may be manifested by an increase in the mean age of exploited specimens. This is particularly true of species that are sensitive to predation and form discrete breeding areas, such as some pinnipeds, or animals that seasonally form spatially and sexually segregated herds, such as deer (Broughton
2002; but see Lyman 2003). Localized breeding areas or rookeries containing females and vulnerable offspring can represent a huge bounty for human hunters, but they can very quickly lead to behavioral/microhabitat depression as these species respond to predation. Hildebrandt and Jones (1992; Jones and Hildebrandt
1995; Jones et al.2004; Porcasi et al.2000; but see Colten and Arnold1998; Lyman
1995,2003) argue that predation on mainland rookeries of migrating populations of seal and sea lion along the Oregon and California coasts resulted in these species shifting to offshore rocks and islands and a decline in the abundance of these populations. Evidence from Middle Holocene archaeological sites containing females and pups indicate the existence of and predation on mainland rookeries for some migratory species such as the northern fur seal (Callorhinus ursinus) in central and northern California (Burton et al.2001,2002; Burton and Koch1999; Porcasi et al.2000; also see Etnier 2002). Isotope composition of these skeletal remains shows that the pups were not weaned when they were dispatched and the adults and subadults were consuming local fish, further indicating that these were resident and not migrating populations. However, Lyman (2003) argues that the predatory defense behavior of some otariids such as California (Zalophus californianus) and Steller (Eumetopias jubatus) sea lions could lead to higher levels of predation on adult males at rookery locations. California and Stellar sea lions practice resource defense polygyny, whereby the males establish and protect a breeding territory and often fail to abandon the territory even when threatened by predators. Data from Seal Rock in Oregon, a near offshore rookery, shows evidence of 600 years of human predation, and the assemblages are dominated by adult males. Lyman (2003) asserts that selective hunting of adult males would not depress local populations and would result in epiphenomenal conservation (sensuHunn1982).
Several analyses of exploitation depression and intensification draw on additional evidence representing resource intensification in the form of cutmark frequencies and bone fragmentation patterns (e.g., Broughton1999; Munro and Bar-Oz2005; Potter1995). The underlying assumption is based on logic derived from the patch choice model, which suggests that as overall foraging efficiency declines, foragers should spend more time in a patch and/or processing a prey item, and cutmark and bone fragmentation frequencies (and patterns) are assumed to be proxy measures of increased processing effort (also see Burger et al.2005). This assumption parallels an argument originally advanced by Binford (1978,1984,1988), who also asserted that cutmark frequencies should reflect butchering intensity and that marrow removal from specific low-yielding skeletal parts such as the mandible, metapodials, and phalanges represents an index of resource stress. Another purported index of animal resource intensification is specific bone fragmentation patterns that are believed to reflect evidence of processing bones for grease, a time-intensive yet low-yielding activity (Binford1978; Lupo and Schmitt1997b; Saint-Germain1997).
Finally, a number of analyses of exploitation depression use rationale derived from central place foraging theory to explain changes in the patterning of skeletal part representation. As foragers use resource patches farther from their residential base, they are expected to show greater selectivity in transport decisions (see Speth
1991; Speth and Scott 1989). Greater selectivity should be manifested in spending more time field processing prey at kill sites and transporting fewer but more highly
valued skeletal parts of larger prey to residential locations (see Broughton1999; Cannon2003; Nagaoka 2005).
Some of the best applications of models of resource depression make use of some or all of the different lines of evidence discussed above. Demonstration of multiple supporting lines of evidence is crucial for supporting exploitation depression as the causal agent of change in foraging efficiency, because, taken individually, some evidentiary sources can be ambiguous. For example, harvesting pressure in ever-growing species can be potentially confounded by the effects of climatic change, which has a well-known influence on the body size of different animals (e.g., Ashton et al.2000; Lyman2004). Size diminution in some ever-growing prey can be attributable to small-scale environmental shifts that might be difficult to detect in the archaeological record. As discussed by Mannino and Thomas (2002), the size of some molluscan species can reflect a short-term natural phenomenon such as poor recruitment and high mortality of older individuals, which can change the age structure available to predators. Leach and Davidson (2001) note that age structure in fish also can be influenced by environmental short-term phenomena such as changes in juvenile recruitment rates as a function of surface seawater temperature. Similarly, changes in age profiles can be potentially misleading and be produced by the use of certain hunting technology. For example, in an ethnoarchaeological study among Bofi and Aka, central African foragers, Lupo and Schmitt (2002; also see Noss 1995) found that mortality profiles of small duikers obtained by mass collecting with nets contained higher proportions of juvenile and immature individuals than those generated by hunting with snares. Net-generated assemblages contained a higher proportion of immature and juvenile specimens because these animals are likely to follow their mothers into nets, and they lack the body size and weight to spring snares. Consequently, depending on the prey, changes in age composition could reflect shifts from individual hunting techniques to the use of mass capture technology (see also Jones2006).
Perhaps the least strongly developed line of evidence in these models concerns the link between resource intensification and taphonomic damage. At present, the data supporting a link between intensification and specific taphonomic damage are limited (see Fancher et al.2003; Gould1996; Potter, 1995). Fancher et al. (2003), for example, found higher frequencies of bone fragmentation in central African ethnoarchaeological assemblages created in prey-impoverished regions compared with those produced in prey-rich regions. But their analysis did not show a similar difference in the frequencies of cutmarks between these two areas. Although resource intensification is supported by theoretical rationale, it is not yet clear if (1) variability in different types of bone damage (e.g., cutmarks and fragmentation) actually reflects intensification, and (2) the different evidence of intensification vary concurrently in response to one process such as overhunting. Do increases in cutmark frequencies and bone fragmentation reflect the same intensification process? It is possible that bone fragmentation resulting from grease rendering may mark the exploitation of a storable, over-wintering resource in circumstances unrelated to the declining abundances of high-ranking prey. Similarly, increases in the number of cutmarks on bones may be intercorrelated with the types of skeletal parts that are transported. For example, increases in the transport of high-value body
parts might be associated with increases in cutmark frequencies because high-value parts with large amounts of attached meat generally require more butchering effort and may display more cutmarks (see Lyman2005). In this case, the two lines of evidence may well be intercorrelated but not necessarily reflect intensification. Given the current ambiguity surrounding the factors that shape cutmark frequency and distribution (see Lupo and O’Connell 2002; Lyman 2005), these lines of evidence need to be clarified and strengthened with future research.
Environmental models
An alternate set of models proposes changes in foraging efficiency in response to environmental change (e.g., Byers and Broughton2004; Byers et al.2005; Grayson et al.2001; Lupo and Schmitt1997a; Ugan2005b; Wolverton2005). These models often rely on patterned changes in zooarchaeological assemblages in concert with paleoclimatic indicators of climate change. The change in taxonomic composition resulting from climatic change can be quite different from those arising from exploitation depression. Continent-scale changes in climate may result in decreases in the abundances of large prey (i.e., megafauna), and changes in the distribution of smaller prey on the landscape (Cardillo et al.2005; Guilday1967,1984). Climatic changes also can have a far more selective effect by increasing or decreasing the abundances of particular prey in response to habitat expansion or decline (Byers and Broughton 2004; Byers et al. 2005; Grayson 2000, 2006; Grayson and Delpech
1998,2005; Grayson et al. 2001; Lupo and Schmitt1997a; Schmitt et al. 2004). For example, Grayson et al. (2001; also see Grayson and Delpech 2005) document declining evenness values in the Upper Paleolithic faunas of Grotte XVI in the Dordogne France culminating in the Magdalenian. Using several different techniques, they show how Upper Paleolithic evenness is unrelated to differential fragmentation, differential bone transport, or sample size. Paleotemperature data from southwestern France show that decreasing evenness values for reindeer are associated with decreasing July temperatures and increasing June precipitation, creating a favorable environment for reindeer and resulting in increased encounter rates with these prey.
On a regional scale, Byers and Broughton (2004; Byers et al. 2005; see also Broughton and Bayham2003) use a suite of data from Homestead Cave in Utah, in concert with paleoclimatic indicators from California and other parts of the Great Basin, to track environmental changes that led to changes in artiodactyl abundances during the Holocene. In Homestead Cave, abundances of Utah chub remains track changing lake levels and monitor moisture levels in the Bonneville Basin throughout the Holocene. Frequencies of artiodactyls feces in the cave serve as a proxy measure for artiodactyl abundances. Overall these data are in good agreement with more conventional paleoclimatic records for the region that show a well-established pattern of droughtlike and arid conditions during the middle Holocene (8000-4000 B.P.), which depressed artiodactyl populations. More favorable mesic conditions in the Late Holocene increased the abundances and encounter rates with artiodactyls, resulting in higher proportions of artiodactyl relative to small-mammal