Cooking Oil Quality Analysis Using Digital Image Processing
1
Prof. Mr. Sangareddy B.K, 2Soumya H.R, 3Shalini R.Y, 4Namratha H.N, 5Manavi H.V 1
Assistant Professor
Department of Computer Science and Engineering Adichunchanagiri Institute of Technology
Chikmagalur, Karnataka, India Abstract
The quality of the cooking oil we consume is of more importance, as people are becoming educated their demand for quality of cooking oil is increasing. There is possibility of adulteration of cooking oil by the traders. Generally the quality assessment is carried by visual inspection which is manual process. Cooking oil is one of the liquid which plays important role in food. It is important on human health; it is cumbersome and time sensitive to find out the quality content in cooking oil using chemical test method. There are some methods reported in literature to find quality level in cooking oil using images of oil. Developing easy and effective automatic quality analysis in an image based on oil color would be helpful for society hence seems to be good research work. In this paper, we are going to address this problem and explore methods to identify quality analysis in cooking oil using image processing techniques. Here we are considering images of sun pure, Sun flower and groundnut to identify percentage of quality level in it. Applications include prevention of diseases of human in advance, quality analysis for health etc.
Keyword: Color, RGB, HSV, Image INTRODUCTION
The production of original cooking oil is an important economic activity carried out in number of countries. Currently, the main use of Sun flower and groundnut oil a worldwide is to produce the strength and quality of oil like (about 88% of the total Sun flower and groundnut oil production). The main factor that affects the Sun flower and groundnut oil quality is the raw material: the sun flower and groundnut seeds. As a result, quality is related to agronomic conditions and harvesting conditions. In [1], the oil reception is classified as one of the most important steps in the oil feature extraction process.
Oil testing is based on seeds and chemical, testing is used for control of quality parameters and test results are submitted to customers as documentation on oil quality. It is the means by which the quality of oil can be measured and viability of color is ensured. Oil testing is determining the
standards of an oil lot namely physical purity, moisture, color, healthy issue and thereby enabling the consumer to get quality oil [2].
A quality free oil lot is the most efficient strategy to achieve established market standard. Separation of good quality oil, if done with right equipment and appropriate methods, can increase purity test [3].
Oil quality is characteristics may offer an insight on chemical analysis levels. Physical purity analysis tells us the proportion of pure oil component in the oil lot as well as the proportion of other chemical.
Images have been collected to predict the Sun flower and groundnut oil images by using 13MP pixel camera for identify the quality of analysis [3]. The system of this research aimed to allow users to load an unknown whole Sun flower and groundnut oil image into image processing software.
Feature extraction model is a statistical technique to determine the sopesticated variable value. Feature extraction method is primarily used for quality analysis based on saturated values.
In this work, we propose an automatic classification methodology of based on computer vision. The structure of the paper is as follows. Firstly, the materials and the methods used for our experimentation are exposed. Secondly, some experimental results are shown. Finally, conclusions and future work are presented.
OVERVIEW
Presently, the identification of Sun flower and groundnut oil variety mainly depends on chemical method. This method can give more exact results but they have many limitations. Application of the chemical method is very high expense for inspection. The inspection of oil using the chemical method is too long to satisfy the demand of oil circulation. The nondestructive identification of Sun flower and groundnut oil on a large scale cannot be achieved by using this method. So, nondestructive, nonexpensive inspection using machine vision based on digital image processing technology is much faster [4].
PROBLEM STATEMENT
To design and implement an efficient method for “Cooking oil Quality analysis using Digital Image Processing”. Here, the input is oil images and output is percentage of quality in the oil. Estimation of quality analysis in oil image by extracting the features like entropy, mean, average energy and variance using image processing techniques and feature extracting modelling.
SCOPE OF THE PROJECT
The proposed approach can be used in several situations:
Feature extraction is based on colour and texture. The quality would be helpful for homemaker, food industries and consumer.
Explore the possibility of determining the quality of oil by using histogram feature.
OBJECTIVES OF THE PROJECT
The main objectives of the proposed system are:
To identify the quality problem and their probable cause.
To determine if oil meets established quality standards or labelling specifications.
This technique is easy and inexpensive.
Proposed System
The proposed system framework contains the procedures to collect the sample images of different oil using camera under different angles, image pre-processing, prediction of oil quality analysis is using feature extraction methods.
Sample Collection
Collect the sample of Sun flower and groundnut. Capture the image of collected samples under the different angles with a light white background. To capture images a 13mega pixel Redmi camera is used. Saturated value which becomes the reference for development of proposed system.
Apply Pre-processing Techniques
Outside interference will cause a variety of noise in the process of image acquisition, which will significantly affect the quality of the image [1]. So it is needed to pre-process the image, such as removing noise and enhancing image.
The noise of captured image often shows as the mutation of the isolated pixel in the image which is called as grain noise. Grain
noise show high frequency characteristics and it has great gray difference. Also the spaces are not interrelated [5]. The commonly used methods of smoothing
were the median filter, neighbourhood mean, spatial low pass filter and frequency low pass filter. In this study, we use the median filter.
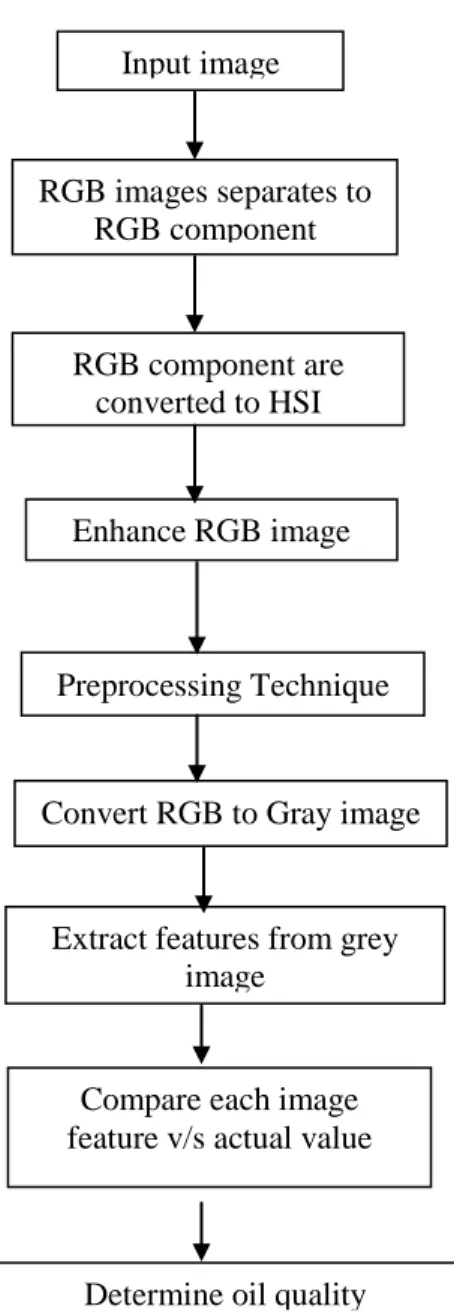
Fig 1: Flow diagram for oil quality analysis Grey Level Co-occurrence Matrix
A GLCM (Grey Level Co-occurrence Matrix) is a square matrix which contains of the same number of rows and columns as the number of grey levels in an image [1]. Each matrix element represents the relative frequency with which two pixels, separated by a pixel distance (Δx, Δy) occur within a given neighbourhood for the reliability of the statistical estimate [1],
the matrix must contain a reasonably high level. To achieve this either the number of grey level values is reduced or a larger window is used. A compromise of the two approaches is generally used. Properties of GLCM are used for texture feature extraction. Input image RGB images separates to RGB component RGB component are converted to HSI Enhance RGB image Preprocessing Technique
Convert RGB to Gray image
Extract features from grey image
Compare each image feature v/s actual value
Texture Analysis
Texture features like Entropy, Mean, Average energy and Variance are extracted along with color features.
Entropy
E, a scalar value representing the entropy of gray scale image I. Entropy is a statistical measure of randomness that can be used to characterize the texture of the input image.
E= (1) Where p is a pixel gray scale value.
Mean: The mean is the average of the numbers: a calculated "central" value of a set of numbers.
(2) Where:
is the mean of the image.
is the sum of the pixel values of an image.
N is the total number of pixel in the image.
Variance: It is an estimation of the spread between numbers in a data set. It measures how far each number in the set is from the mean. Variance is computed by taking the difference between each number in the set and the mean, squaring the differences and dividing the sum of the squares by the number of values in the set.
S2= (3)
Average Energy
Need to find the average energy, so i need to divide the sum by the number of pixels in an image or a window.
(4) Returns the sum of squared elements.
CORRELATION
Correlation is a statistical measure that indicates the extent to which two or more variables fluctuate together. A positive correlation indicates the extent to which those variables increase or decrease
in parallel; a negative correlation indicates the extent to which one variable increases as the other decreases.
Correlation is calculated using the formula below: (5) Where: is the mean is the variance is the pixel
is the pixel co-ordinate values
Returns a measure of how correlated a pixel is to its neighbor over the whole image. Range = [1 1], Correlation is 1 or -1 for a perfectly positively or negatively correlated image.
Color Features: Color features such as RGB and HSV are extracted.
RGB (Red Green Blue): RGB refers to a system for representing the colors to be used on a computer display. Red, green, and blue can be combined in various proportions to obtain most colors in the visible spectrum.
HSI(Hue Saturation Intensity)
HSI colour system directly describes the light colour by brightness (or lightness), tonality and saturation, which are suitable for color description by humans [1]. It is easy for human visual system to distinguish different tonalities, but it is difficult to distinguish different color through brightness and saturation. In this system, H is defined as hue or tonality; I and S are defined as light intensity and saturation respectively. For the above characteristics correlation model is
developed to analyse the dependency of nitrogen over the characteristics.
Estimation of Quality: The quality of an image can be estimated by using the following steps
Comparison of saturated value and image each feature value.
Estimate the quality analysis on Sun flower and groundnut using feature extracted method.
Implementation
Implementation is the phase where the system goes for actual functioning.
System Testing
Table 1: Different categories of sample images are considered for testing.
Sl no Categories type Number of images
1 Sun flower fresh oil 30 Images
2 Mixed oil 30 Images
3 Used oil 30 Images
Test procedures
Test cases are the key factors to the success of any system. Performance of a system is analyzed based on the cases written for functional performance of a system. Test cases are critical for the successful performance of the system. Test
procedures will be command procedures which in general will do the following:
Compile & link reference programs.
Execute reference program with test input data.
TEST RESULT
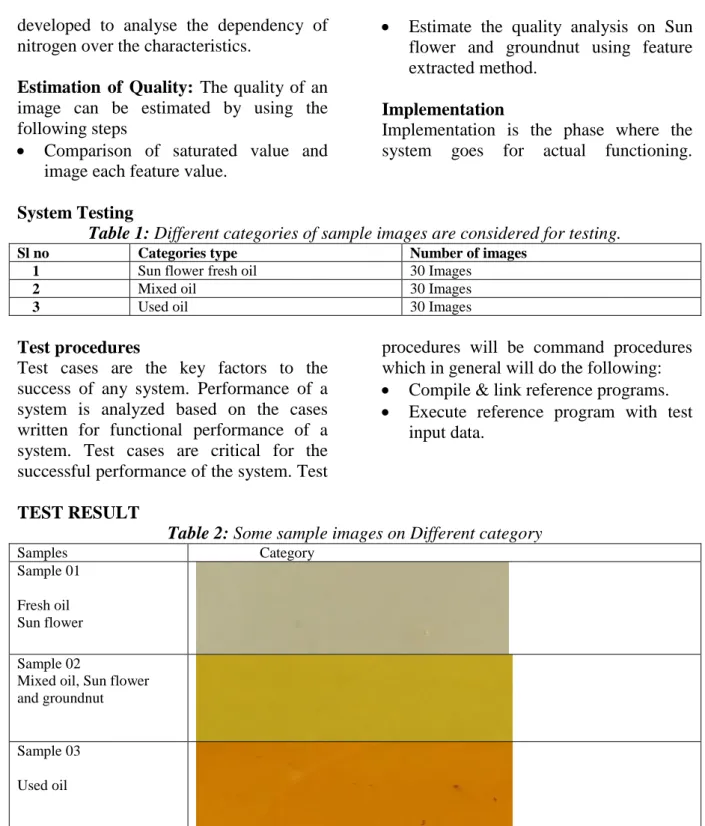
Table 2: Some sample images on Different category Samples Category
Sample 01 Fresh oil Sun flower Sample 02
Mixed oil, Sun flower and groundnut
Sample 03 Used oil
Results of Sun flower quality on feature method: Fig shows initially get the image from source. Then applied to pre-processing techniques because noise removed and smoothed purpose. After pre-processing we are extracting the image features in gray image and then analysis the quality on oil. Initially we are taken
different category images. After executing all four category images we got good result from mean feature. Finally we are concluding in mixed and used oil is not good, in Sun flower and groundnut fresh oil are gives better quality.
Maximum nearby actualvalue on features in under each category condition
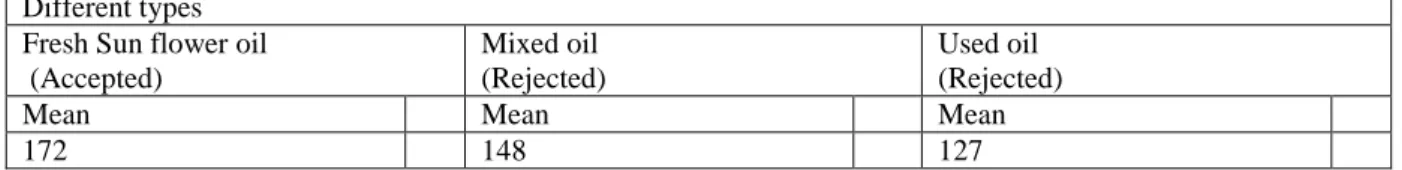
Table 3: Estimating maximum actualvalue on features in under each category condition Different types
Fresh Sun flower oil (Accepted)
Mixed oil (Rejected)
Used oil (Rejected)
Mean Mean Mean
172 148 127
Table 3 shows estimating maximum nearby actualvalues on features like mean. After estimating maximum actual values under each category condition we got maximum meanvalues on each category. In this proposed work we conclude mean is better for estimating the oil quality analysis.
CONCLUSION
In this work, the estimation of quality analysis in cooking oil is done based on texture features like entropy, mean, average energy, and variance. The literature review outlines several methods of estimation of quality analysis. The estimation methods like chemical test method, these are costly and time consuming. The image processing methods like feature extraction method may work well with commonly speedier for estimating quality in oil.
This work explored the possibility of using image processing techniques to estimate the quality analysis on cooking oil. To test the proposed method, three sample oil was taken from different cooking oil and their images were captured under various category sources. Then they were analyzed in the laboratory in the oil manufacturing industry get the actual value of fresh Sun flower oil. The three cooking oil samples to result in 150 digital images.
We carried out experiments by extracting various features from the images and correlated the features with the actual value and feature extracted value. The features that have maximum correlation
will have a higher value of the experiments; we can say that the images cooking oil like Sun flower, mixed oil and used oil in that category fresh Sun flower is given better perform, further mixed and used oil are not providing good results as an actual value. The image features like mean give, the better correlation result with the highest actual value.
FUTURE WORKS
Expansion of this work may target estimation of quality analysis based on more specific illumination like infrared light, florescent light and incandescent light. Also the use of other surface texture and color features can be explored for comparison between manual results. Further, there is a need to identify other features and explore the usage other illumination sources.
REFERENCES
1. Ariffin, A. A. (1991). Chemical Changes during Sterilisation Process Affecting Strippability and Oil Quality. Seminar on Developments in Palm Oil Milling Technology and Environmental Management. Palm Oil Institute of Malaysia (PORIM), Bangi. 2. Babatunde, O.O., Ige, M. T. &
Makanjoula, G.A. (1988). Effect of sterilisation on fruit recovery in oil palm fruit processing. Journal of Agriculture Engineering Research, 41, 75 – 79.
3. Pearson, Y. T. (1996). Machine vision system for automated detection of stained pistachio nuts. Journal of Food
Science & Technology, 19(3), 203-209.
4. Shariff, A. R., Nor, A. A., Mispan, R., Shattri, M., Rohaya, H. & Goyal, R. (2002). Correlation between oil content and DN values. MAP Asia conference, Geospatial Application Papers, India.
5. Heinemann, P. H., Hughes, R., Morrow, C. T., Sommer, H. J., Beelman, R.B. & Wuest, P.J. (1995). Grading of Mushrooms using a Machine Vision System. Trans. ASAE 37(5):1671-1677.