Chuuk State Census Report
2000 FSM Census of Population and Housing
December 2002
Chuuk Branch Statistics Office
Division of Statistics
Department of Economic Affairs
National Government
Weno, Chuuk 96942
Federated States Of Micronesia
2000 FSM Census
of Population
and
Housing
Chuuk State Census Report
December 2002
Chuuk Branch Statistcs Office
Division of Statistics
Department of Economic Affairs
National Government
Weno, Chuuk 96942
Federated States of Micronesia
Preface 2000 FSM Census of Chuuk
TABLE OF CONTENTS
CONTENTS Page
PRESIDENT’S MESSAGE ...iii
GOVERNOR’S MESSAGE...v
ACKNOWLEDGEMENT...vii
PREFACE ...ix
TABLE OF CONTENTS ...xi
LIST OF TEXT TABLES ...xiv
LIST OF FIGURES...xviii
LIST OF BASIC TABLES...xix
SYMBOLS ...xxi
MAPS ...xxii
EXECUTIVE SUMMARY ...xxiv
CHAPTER 1. INTRODUCTION...1
Geographical characteristics ...1
Climate ...1
Regional Sub-Division...2
A Brief History of Census Taking...2
Spanish Administration...2
German Administration ...4
Japanese Administration ...5
American Administration...11
The 2000 FSM Census of Chuuk ...14
Analysis of Data on Geographical Distribution ...15
Geographic Distribution Over Time ...15
Population Distribution...15
Population Density...17
Conclusion ...17
CHAPTER 2. AGE AND SEX STRUCTURE ...19
Introduction...19
Data Description...19
Analysis of Age and Sex Data...19
Population Change and Intercensal Growth...19
Age and Sex Distribution...20
Median Age...22
Sex Ratio...22
Dependency Ratio...23
Accuracy of Age and Sex Data ...24
Conclusion ...25
CHAPTER 3. HOUSEHOLDS, FAMILIES, AND MARITAL STATUS ...27
Introduction...27
Definitions...27
Analysis of Data on Households and Marital Status ...29
Households and Families ...29
Marital Status...31
Conclusion ...33
CHAPTER 4. FERTILITY...35
Introduction...35
Data Description...35
Analysis of Fertility Data ...35
Crude Birth Rate ...35
Table of contents 2000 FSM Census of Chuuk State
xii Chuuk Branch Statistics Office, Division of Statistics, FSM Department of Economic Affairs
Fertility of Population Subgroups ...39
Conclusions ...41
CHAPTER 5. MORTALITY...43
Introduction ...43
Data Description...43
Analysis of Mortality Data ...43
Crude Death Rate ...43
Infant and Child Mortality Rates, and Life Expectancy at Birth...44
Conclusions ...47
CHAPTER 6. MIGRATION ...49
Introduction ...49
Data Description...49
Analysis of Migration Data ...50
Birthplace ...50
Citizenship and Legal Residence ...52
Continuous Residence...53
Place of Residence Five Years Prior to the Census...54
Conclusions ...56
CHAPTER 7. RELIGION, ETHNICITY AND LANGUAGE...57
Introduction ...57
Definitions...57
Analysis of Data on Religion, Ethnicity and Language...58
Religion ...58
Ethnicity ...60
Language...60
Conclusions ...62
CHAPTER 8. EDUCATION AND LITERACY...63
Introduction ...63
Data Description...63
Analysis of Education Data ...64
School Enrollment...64
Educational Attainment...68
Literacy Status...71
Vocational Training ...72
Conclusions ...72
CHAPTER 9. ECONOMIC ACTIVITY ...75
Introduction ...75
Definitions...75
Analysis of Economic Activity Data ...76
Labor Force Participation...76
Unemployment...80
Underemployment...81
Labor Force Status by Citizenship ...81
Labor Force Status by English Language Ability ...82
Labor Force Status by Educational Attainment...83
Work Experience...83
Subsistence Activity...84
Market-Oriented Activities ...87
Other Labor Force Characteristics ...88
2000 FSM Census of Chuuk State Table of contents
CHAPTER 10. INDUSTRY AND OCCUPATION...89
Introduction...89
Data Description...89
Analysis of Industry and Occupation Data...92
Industry ...92 Occupation...94 Class of Worker ...98 Conclusion ... 100 CHAPTER 11. INCOME ... 101 Introduction... 101 Definitions... 101
Analysis of Income Data ... 102
Conclusions... 109
CHAPTER 12. HOUSING CHARACTERISTICS... 111
Introduction... 111
Data Description... 111
Analysis of Housing Data ... 115
General Housing Characteristics... 115
Structural Characteristics ... 116
Utilities ... 119
Equipment... 122
Conclusions... 128
BIBLIOGRAPHY ... 129
APPENDIX A. BASIC TABLES... 133
Chuuk Branch Statistics Office, Division of Statistics, FSM Department of Economic Affairs xiv LIST OF TEXT TABLES
TABLE Page
Chapter 1. Population
Table 1.1. Early Population Estimates for Major Island Units in Chuuk State: Selected Years...4
Table 1.2. Population of Japanese and Chuukese in Chuuk: 1920 to 1946 ...7
Table 1.3 Population of Chuuk: 1920 to 2000 ...7
Table 1.4. Population of Chuuk by Region: 1930 to 2000...8
Table 1.5. Proportional Distribution by Municipality, Chuuk State: Selected Census Years...8
Table 1.6. Population of Chuuk by Age and Region: 1930. ...9
Table 1.7. Population of Chuuk by Region of Registration and Region of Residence (horizontal): 1930 ...10
Table 1.8. Population of Chuuk by Region of Registration and Region of Residence (vertical): 1930...10
Table 1.9. Population of Chuuk by Age Group and Region: 1935 ...10
Table 1.10. Age by Region, Chuuk: 1967 ...12
Table 1.11. Population of Chuuk by Age and Region: 1973 ...12
Table 1.12. TTPI-born by Home Area and Region of Residence: 1973 ...13
Table 1.13. Population of Chuuk by Age and Region: 1980 ...13
Table 1.14. Residence in 1975 by Current Region of Residence, Chuuk: 1980 ...13
Table 1.15. Population Distribution by Municipality, Chuuk State: 1994 and 2000 ...16
Table 1.16. Population Density, Chuuk State: 2000 ...17
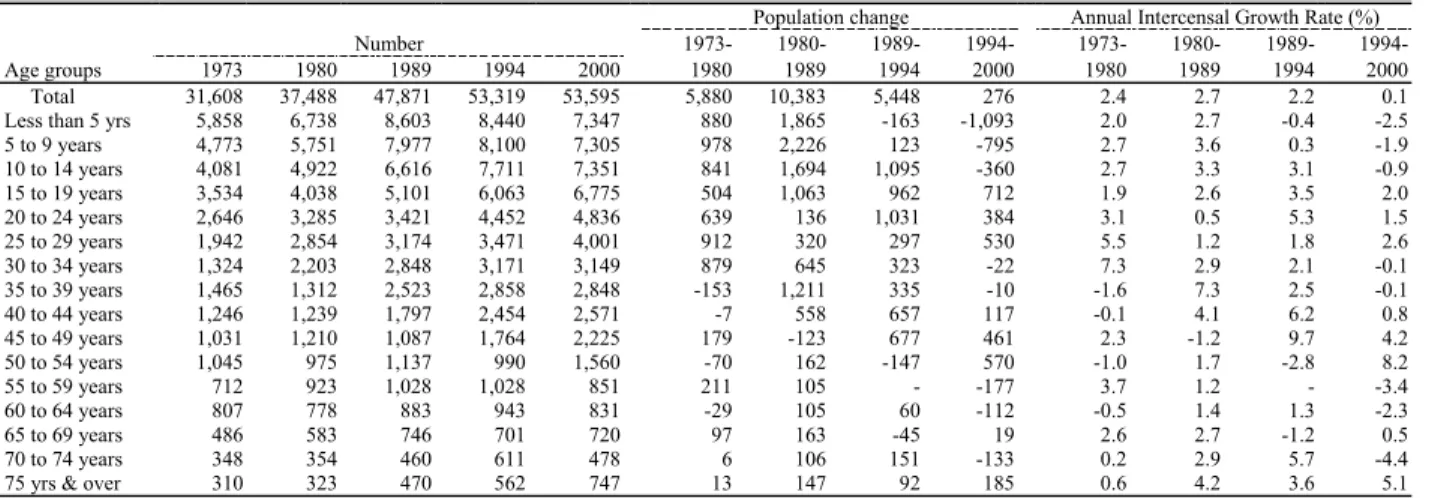
Chapter 2. Age Sex Structure Table 2.1: Population Change and Annual Growth Rate by Age Group, Chuuk State: 1973 to 2000...20
Table 2.2: Percent Distribution of Population by Five-Year Age Group and Sex, Chuuk State: 1973 to 2000...20
Table 2.3: Population by Age Group and Sex, Chuuk State: 1994 and 2000 ...22
Table 2.4: Median Age by Municipality and Sex, Chuuk State: 1973 to 2000...22
Table 2.5: Males per Females by Municipality, Chuuk State: 1973 to 2000 ...23
Table 2.6: Males per Females by Age Group and Municipality, Chuuk State: 1994 and 2000...23
Table 2.7. Dependency Ratio by Municipality, Chuuk State: 1973 to 2000...24
Table 2.8: Selected Demographic Indicators from FSM and Neighboring Pacific Countries: 2000 ...24
Table 2.9: Myers and Bachi Method of Measuring Digit Preference, Chuuk State: 1973 to 2000...24
Chapter 3 Households, Families, and Marital Status Table 3.1: Type of Living Quarters in Chuuk State: 1973 to 2000...29
Table 3.2: Household Composition, Chuuk State: 1973 to 2000...29
Table 3.3: Household Composition by Municipality of Usual Residence, Chuuk State: 1994 & 2000 ...30
Table 3.4: Person per Household by Municipality of Usual Residence, Chuuk State: 1994 and 2000...30
Table 3.5: Household Size for Chuuk Lagoon and Outer Islands, Chuuk State: 1989,1994 and 2000...31
Table 3.6: Marital Status for Aged 15 Years and Over by Sex, Chuuk State: 1973 to 2000 ...31
Table 3.7: Marital Status for Age 15 Years and Over by Municipality, Chuuk State: 1994 and 2000...32
Table 3.8: Singulate Mean Age at Marriage for Aged 15 Years and Over by Municipality and Sex, Chuuk State: 1989 to 2000...32
Chapter 4. Fertility Table 4.1: Crude Birth Rate, Chuuk State: 1994 and 2000...36
Table 4.2: Estimation of Crude Birth Rate, Chuuk State: 1985 to 2000...36
Table 4.3: Registered Births by Calendar Year and Implied Crude Birth Rate, Chuuk State: 1992 to 1999...37
Table 4.4: Adjustment of Births in Year Prior to the Census, Chuuk State: 1994 and 2000 ...37
Table 4.5: Calculation of Total Fertility Rate with P/F Ratio, Chuuk State: 1994 & 2000 ...38
Table 4.6: Age-specific Fertility Rate, Chuuk State: 1973 to 2000 ...39
Table 4.7: Children Ever Born per Woman and TFR by Mother's Educational Attainment, Chuuk State: 1994 and 2000...40
Table 4.8: Children Ever Born per Woman and TFR by Labor Force Participation, Chuuk State: 1994 and 2000 ...40
Table 4.9: Age-specific Fertility Rates by Region, Chuuk State: 1994 and 2000...40
2000 FSM Census of Chuuk State List of Text-tables Chapter 5. Mortality
Table 5.1: Average Age-specific Mortality Rates, Chuuk State: 1992 to 1995 and 1996 to 1999 ...44
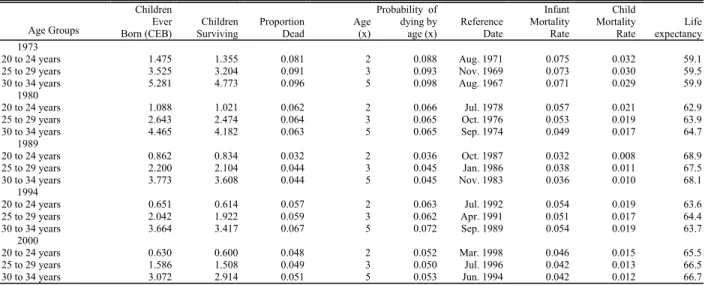
Table 5.2: Number of Children Ever Born (CEB) and Children Surviving (CS) and Proportion Surviving (PS) by Age Group of Mother, Chuuk State: 1973 to 2000 ...44
Table 5.3: Indirect Estimates of Early Age Mortality CEB/CS, Chuuk State: 1973 to 2000 ...45
Table 5.4: Summary Indicators from Indirect Estimation of Early Age Mortality, Chuuk State: 1969 to 1996 ...45
Table 5.5: Estimated Mortality Data from Other Neighboring Pacific Island Nations: Various Years...46
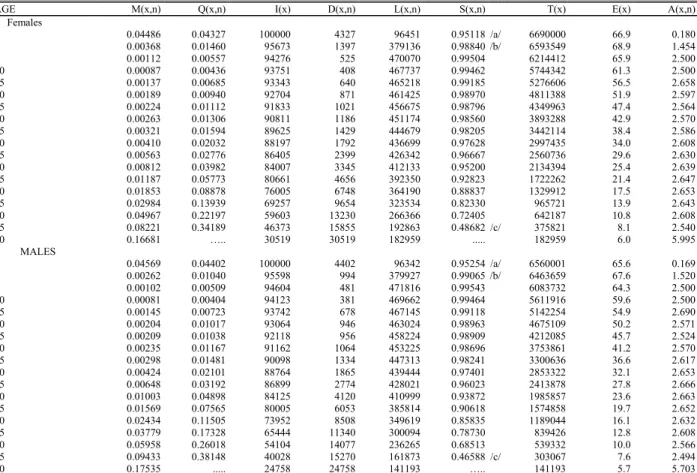
Table 5.6: Life Table as Implied by Coale and Demeny Life Table for the West Pattern of Females and Males, Chuuk: 1997-1998...47
Chapter 6. Migration Table 6.1: Birthplace of Chuuk Residents by Sex: 1989 to 2000 ...50
Table 6.2: Birthplace of Chuuk Residents: 1994 and 2000 ...51
Table 6.3: State of Birth of Chuuk and other FSM States: 1994 and 2000...51
Table 6.4. Internal Lifetime Migration, Chuuk State: 1994 and 2000...52
Table 6.5: Usual Residence by Citizenship, Chuuk State: 1994 and 2000 ...52
Table 6.6: Municipality and State of Legal Residence by Municipality of Usual Residence, Chuuk State: 1994 and 2000 ...53
Table 6.7: Distribution of Non-movers and Previous Residence, Chuuk State: 1994 and 2000 ...53
Table 6.8: Movers by Place of Previous Residence, Chuuk State: 1994 and 2000 ...54
Table 6.9: Residence 5 Years Ago by Usual Residence for Persons Aged 5 Years and Over, Chuuk State: 1994 and 2000 ...54
Table 6.10. Annual Internal Migration Rate by Region, Chuuk State: 1994 and 2000 ... 54
Table 6.11: Residence Five Years Ago by Usual Residence for Persons 5 Years and Over, Chuuk State: 1994 and 2000 ...55
Table 6.12: Educational Attainment of Interstate Migrants by Sex, Chuuk State 1994 and 2000...55
Table 6.13: Labor Force Participation of Interstate Migrants by Sex, Chuuk State 1994 and 2000...55
Chapter 7. Religion, Ethnicity, and Language Table 7.1: Religion by Sex, Chuuk State: 1973 to 2000...58
Table 7.2: Religion by Municipality, Chuuk State: 1994 and 2000 ...59
Table 7.3: Religion by Age Group, Chuuk State: 1994 and 2000 ...59
Table 7.4: Ethnic Origin of Chuuk Residents by Region: 1994 and 2000...60
Table 7.5: Ethnicity by Place of Birth, Chuuk State: 1994 and 2000 ...60
Table 7.6: Languages Spoken at Home by Ethnicity, Chuuk State: 1994 and 2000 ... 61
Table 7.7: Languages Spoken at Home by Place of Birth, Chuuk State: 1994 and 2000...61
Table 7.8: Frequency of English Use by Municipality, Chuuk State: 1994 and 2000...61
Table 7.9: English Speakers at Home by Age Group, Chuuk State: 1994 and 2000... 62
Chapter 8. Education Table 8.1: School Attendance for Age 3 Years and Over by Level and Type, Chuuk State: 1973 to 2000 ...64
Table 8.2: School Attendance for Age 3 Years and Over by Level and Type, Chuuk State: 1994 and 2000...65
Table 8.3: Age-specific Enrollment Ratio per 100 by Age and Sex, Chuuk State: 1994 and 2000...65
Table 8.4: Age-specific Enrollment Ratio by Age, Chuuk State: 1994 and 2000 ...67
Table 8.5: Gross Enrollment Ratio by Sex, Chuuk State: 1994 and 2000 ...68
Table 8.6: Educational Attainment for Age 25 Years and Over by Sex, Chuuk State: 1980, 1994 and 2000...68
Table 8.7: Educational Attainment for Age 25 Years and Over by Sex, Chuuk State: 1994 and 2000...69
Table 8.8: Educational Attainment for Aged 25 Years and Over by Region, Chuuk State: 1994 and 2000 ...69
Table 8.9: Educational Attainment for Age 25 Years and Over by Age Group and Sex, Chuuk State: 1994 and 200070 Table 8.10: Educational Attainment for Age 25 Years and Over by Place of Birth, Chuuk State: 1994 and 2000....71
Table 8.11: Literate Population for Aged 10 Years and Over by Age Group and Sex, Chuuk State: 1980, 1994 and 2000 ...71
Table 8.12: Literate Population for Aged 10 Years and Over by Age Group and Region: Chuuk State: 1994 and 2000 ...72
List of Text Table 2000 FSM Census of Chuuk State
xvi Chuuk Branch Statistics Office, Division of Statistics, FSM Department of Economic Affairs
Chapter 9. Economic Activity
Table 9.1: Distribution of Working-Age Population for Aged 15 Years and Over by Region, Chuuk State: 1994 and
2000...77
Table 9.2: Distribution of Working Age Population for Aged 15 Years and Over by Sex, Chuuk State: 1994 and 2000...77
Table 9.3: Labor Force Distribution by Sex and Region, Chuuk State: 1994 and 2000 ...78
Table 9.4: Labor Force Participation Rates by Age Group and Sex, Chuuk State: 1994 and 2000...78
Table 9.5: Labor Force Participation Rates by Age Group and Region, Chuuk State: 1994 and 2000 ...79
Table 9.6: Unemployment Rates (Percent of Labor Force Unemployed) by Age Groug and Sex, Chuuk State: 1994 and 2000 ...80
Table 9.7: Unemployment Rates (Percent of Labor Force Unemployed) by Age Group and Region, Chuuk State: 1994 and 2000 ... Table 9.8: Unemployed Persons by Age Group and Previous Work Experience, Chuuk State: 1994 and 2000...81
Table 9.9. Underemployment by Region, Chuuk: 1994 and 2000...81
Table 9.10: Labor Force Status for Age 15 Years and Over by Citizenship, Chuuk State: 1994 and 2000...82
Table 9.11: Labor Force Status for Age 15 Years & Over by Language Ability, Chuuk State: 1994 and 2000 ...83
Table 9.12: Educational Attainment Labor Force Status, Chuuk State: 1994 & 2000 ...83
Table 9.13: Year of Last Work for Aged 15 Years and Over Not in the Formal Labor Force, Chuuk State: 2000....84
Table 9.14: Percent of Population in Subsistence Work by Region, Chuuk State: 1994 and 2000 ...84
Table 9.15: Percent of Population in Subsistence Work by Age Group, Sex & Region, Chuuk State: 1994 & 2000 .85 Table 9.16: Subsistence Activities for Aged 15 Years and Over by Educational Attainment, Chuuk State: 1994 and 2000...87
Table 9.17: Subsistence Activities by Search for Cash Employment, Chuuk State: 1994 and 2000...87
Table 9.18: Percent of Population in Market-Oriented Activity by Region, Chuuk State: 1994 and 2000 ...87
Table 9.19: Location of Work Last Week by Region, Chuuk State: 1994 and 2000...88
Chapter 10. Industry and Occupation Table 10.1: Industry of Employment for Aged 15 Years and Over, Chuuk State: 1994 and 2000...92
Table 10.2: Detailed Breakdown of Industry by Sex, Chuuk State: 1994 and 2000...93
Table 10.3: Industry by Percent of Persons with High School Diploma and Vocational Training, Chuuk State: 1994 and 2000 ...94
Table 10.4: Industry by Occupation, Chuuk State: 1994 and 2000 ...94
Table 10.5: Occupations of Current formal Work Force, Chuuk State: , 1994 and 2000 ...95
Table 10.6: Occupations of Current Work Force for Aged 15 Years and Over Who Worked in 5 Years Previous to Census by Sex, Chuuk State: 1994 and 2000 ...95
Table 10.7: Occupation by Age Groups for Aged 15 years and Over, Chuuk State: 1994 and 2000 ...96
Table 10.8: Occupation for Aged 15 Years and Over by Age Group, Chuuk State: 1994 and 2000...96
Table 10.9: Occupation for Aged 15 Years and Over by Place of Birth, Chuuk State: 1994 and 2000 ...97
Table 10.10: Occupation for Aged 15 Years and Over by Region, Chuuk State: 1994 and 2000 ...97
Table 10.11: Educational Attainment of the Current Formal Work Force for Aged 25 Years and Over by Occupation, Chuuk State: 1994 and 2000 ...98
Table 10.12: Type of Work for Aged 15 Years and Over by Region and Sex, Chuuk State: 1994 and 2000 ...99
Table 10.13: Type of Work for Aged 15 Years and Over by Age Group, Chuuk State: 1994 and 2000...99
Table 10.14: Educational Attainment by Class of Worker, Chuuk State: 1994 and 2000 ...100
Chapter 11. Income Table 11.1: Household, Family and Individual Income in U.S. Dollars ($) in 1993 and 1999 by Region, Chuuk State: 1994 and 2000 ...102
Table 11.2: Median Household Income Change for Chuuk and Other FSM States: 1994 and 2000...103
Table 11.3: Percent Distribution of Individual Income in 1994 and 2000 by Region, Chuuk State: 1994 and 2000103 Table 11.4: Individual Income in 1993 and 1999 by Age Group and Sex, Chuuk State: 1994 and 2000...104
Table 11.5: Individual Income by Sex, Chuuk State: 1994 and 2000...104
Table 11.6: Median Income in U.S. Dollars ($) by Type of Family and Region, Chuuk State: 1994 and 2000...105
Table 11.7: Individual Income in 1993 and 1999 by Educational Attainment, Chuuk State: 1994 and 2000 ...106
Table 11.8: Individual Median Income in 1993 and 1999 by Economic Status the Week Before the Census, Chuuk State: 1994 and 2000 ...106
2000 FSM Census of Chuuk State List of Text-tables
Table 11.9: Median Individual Income in U.S. Dollars ($) in 1993 and 1999 by Occupation, Chuuk State: 1994 and
2000 ... 107
Table 11.10: Individual Income in 1993 and 1999 by Class of Work, Chuuk State: 1994 and 2000... 107
Table 11.11: Median Income in U.S. Dollars ($) by Source and Region, Chuuk State: 1994 and 2000 ... 108
Table 11.12: Proportion of Persons Earning Income in each Region, by Source, Chuuk State: 1994 and 2000... 109
Table 11.13: Income Source in 1993 and 1999 by Sex, Chuuk State: 1994 and 2000 ... 109
Chapter 12. Housing Table 12.1: Total Housing Units, Occupied Housing Units, and Others, Chuuk State: 1980, 1994 and 2000... 115
Table 12.2: Total Housing Units by Region, Chuuk State: 1994 and 2000... 115
Table 12.3. Year House Built by Region, Chuuk State: 2000 ... 116
Table 12.4: Occupied Housing Units by Number of Units per Structure, Chuuk State: 1994 and 2000... 116
Table 12.5: Occupied Housing Units by Number of Units per Structure and Region, Chuuk State: 1994 and 2000116 Table 12.6. Rooms per Occupied Housing Units, Chuuk State: 1980, 1994 and 2000 ... 117
Table 12.7. Number of Rooms per Occupied Housing Unit by Region, Chuuk State: 1994 and 2000 ... 117
Table 12.8. Number of Bedrooms per Housing Unit of All Units, Chuuk State: 1980, 1994 and 2000... 117
Table 12.9. Number of Bedrooms of All Housing Units by Region, Chuuk State: 1994 and 2000 ... 118
Table 12.10. Material Used for Roof of All Housing Units, Chuuk State: 1980, 1994 and 2000 ... 118
Table 12.11. Materials Used for Roof of All Housing Units by Region, Chuuk State: 1994 and 2000 ... 118
Table 12.12. Materials Used for Walls, Chuuk State: 1980, 1994 and 2000... 119
Table 12.13. Materials Used for Outside Walls by Region, Chuuk State: 1994 and 2000... 119
Table 12.14. Materials Used for Foundation of All Housing Units by Region, Chuuk State: 1994 and 2000 ... 119
Table 12.15. Electricity Source of All Housing Units, Chuuk State: 1980, 1994 and 2000... 120
Table 12.16. Electricity and Air Condition of All Housing Units by Region, Chuuk State: 1994 and 2000 ... 120
Table 12.17. Piped Water of All Housing Units, Chuuk State: 1980, 1994 and 2000... 120
Table 12.18. Water Supply of All Housing Units by Region, Chuuk State: 1994 and 2000... 121
Table 12.19. Source of Drinking Water of All Housing Units, Chuuk State: 1980, 1994 and 2000 ... 121
Table 12.20. Source of Drinking Water of All Housing Units by Region, Chuuk State: 1994 and 2000... 121
Table 12.21. Sewage disposal of All Housing Units, Chuuk State: 1980, 1994 and 2000 ... 122
Table 12.22. Sewage Disposal of All Housing Units by Region, Chuuk State: 1994 and 2000... 122
Table 12.23. Plumbing Facilities of All Housing Units, Chuuk State: 1980, 1994 and 2000 ... 122
Table 12.24. Plumbing Facilities of Occupied Housing Units by Region, Chuuk State: 1994 and 2000... 123
Table 12.25. Toilet Facilities of All Housing Units, Chuuk State: 1980, 1994 and 2000 ... 123
Table 12.26. Toilet Facilities of All Housing Units by Region, Chuuk State: 1994 and 2000... 123
Table 12.27. Bathtub or Shower Facilities of All Housing Units, Chuuk State: 1980, 1994 and 2000... 124
Table 12.28. Bathtub or Shower Facilities of All Housing Units by Region, Chuuk State: 1994 and 2000 ... 124
Table 12.29. Cooking Facilities Inside of Occupied Housing Units by Region, Chuuk State: 1994 and 2000... 124
Table 12.30. Cooking Facilities Outside of Occupied Housing Units by Region, Chuuk State: 1994 and 2000 ... 125
Table 12.31. Vehicles and Boats Owned by Region, Chuuk State: 1994 and 2000 ... 125
Table 12.32. Monthly Cost of Electricity by Region, Chuuk State: 1994 and 2000 ... 126
Table 12.33. Monthly Cost of Kerosene by Region, Chuuk State: 1994 and 2000 ... 126
Table 12.34. Monthly Cost of Water by Region, Chuuk State: 1994 and 2000 ... 127
Table 12.35. Monthly Cost of Other Fuel by Region, Chuuk State: 1994 and 2000... 127
xviii Chuuk Branch Statistics Office, Division of Statistics, FSM Department of Economic Affairs LIST OF FIGURES
FIGURE Page
Figure 1.1. Population Distribution by Region, Chuuk: 1930 to 2000 ...15
Figure 1.2. Population Distribution by Region, Chuuk: 2000 ...17
Figure 2.1. Population Structure of Chuuk, Chuuk: 1973 to 2000 ...21
Figure 4.1. Age-Specific Fertility Rates, Chuuk: 1973 to 2000 ...39
Figure 6.1. Interstate Lifetime Net-migration Flows of Chuuk and other FSM States, Chuuk: 2000 ...51
Figure 8.1. Age-Specific Enrollment Rates by Age, Chuuk: 1994 & 2000...66
Figure 8.2. Age-Specific Enrollment Rates by Age and Sex, Chuuk: 2000 ...66
Figure 8.3. Age-Specific Enrollment Rates by Region, Chuuk: 2000...67
Figure 8.4 Literate Population by Age and Sex, Chuuk: 2000 ...71
Figure 9.1. Labor Force Participation Rates, Chuuk: 1994 and 2000...78
Figure 9.2. Labor Force Participation Rate by Age and Sex, Chuuk: 2000...79
Figure 9.3 Labor Force Participation Rate by Age and Region, Chuuk: 2000 ...79
Figure 9.4 Subsistence Activities by Sex, Chuuk: 2000...86
LIST OF BASIC TABLES
TABLE Page
Table B01a. Age by Municipality of Usual Residence, Chuuk: 2000... 133
Table B01b. Age by Municipality of Usual Residence, Chuuk: 2000 - continued... 134
Table B01a. Age by Municipality of Usual Residence, Chuuk: 2000... 135
Table B01b. Age by Municipality of Usual Residence, Chuuk: 2000 - continued... 136
Table B01c. Age by Municipality of Usual Residence, Chuuk: 2000 - continued... 137
Table B01d. Age by Municipality of Usual Residence, Chuuk: 2000 - continued... 138
Table B02a. Household and Family Characteristics by Municipality of Usual Residence, Chuuk: 2000... 139
Table B02b. Household and Family Characteristics by Usual Residence, Chuuk: 2000 - cont'd... 140
Table B02c. Household and Family Characteristics by Municipality of Usual Residence, Chuuk: 2000 - cont'd .... 141
Table B02d. Household and Family Characteristics by Municipality of Usual Residence, Chuuk: 2000 - cont'd.... 142
Table B03a. Household Size and Fertility by Municipality of Usual Residence, Chuuk: 2000 ... 143
Table B03b. Household Size and Fertility by Municipality of Usual Residence, Chuuk: 2000-cont'd ... 144
Table B03a. Fertility by Age of Mother & Sex of Child by Municipality of Usual Residence, Chuuk: 2000 ... 145
Table B03b. Fertility by Age of Mother and Sex of Child by Usual Residence, Chuuk: 2000 ... 146
Table B03c. Household Size and Fertility by Municipality of Usual Residence, Chuuk: 2000 - cont'd ... 147
Table B03d. Household Size and Fertility by Municipality of Usual Residence, Chuuk: 2000 - cont'd ... 148
Table B03c1. Fertility by Age of Mother & Sex of Child by Municipality of Usual Residence, Chuuk: 2000 ... 149
Table B03d1. Fertility by Age of Mother and Sex of Child by Municipality Usual Residence, Chuuk: 2000 ... 150
Table B04A. Single Years of Age by Municipality of Usual Residence, Chuuk: 2000 ... 151
Table B04b. Single Years of Age by Municipality of Usual Residence, Chuuk: 2000 - continued ... 152
Table P04a.1. Single Years of Age by Municipality of Usual Residence, Chuuk: 2000... 153
Table B04b.1. Single Years of Age by Municipality of Usual Residence, Chuuk: 2000 - continued ... 154
Table B04c. Single Years of Age by Municipality of Usual Residence, Chuuk: 2000 - continued ... 155
Table B04d. Single Years of Age by Municipality of Usual Residence, Chuuk: 2000 - continued ... 156
Table B04b.1. Single Years of Age by Municipality of Usual Residence, Chuuk: 2000 - continued ... 157
Table B04d.1. Single Years of Age by Municipality of Usual Residence, Chuuk: 2000 - continued ... 158
Table B05a. Place of Birth by Municipality of Usual Residence, Chuuk: 2000 ... 159
Table B05b. Place of Birth by Municipality of Usual Residence, Chuuk: 2000 - continued ... 160
Table B05a. Place of Birth by Municipality of Usual Residence, Chuuk: 2000 ... 161
Table B05b. Place of Birth by Municipality of Usual Residence, Chuuk: 2000 - continued ... 162
Table B05c. Place of Birth by Municipality of Usual Residence, Chuuk: 2000 - continued... 163
Table B05d. Place of Birth by Municipality of Usual Residence, Chuuk: 2000 - continued ... 164
Table B05c. Place of Birth by Municipality of Usual Residence, Chuuk: 2000 - continued... 165
Table B05d. Place of Birth by Municipality of Usual Residence, Chuuk: 2000 - continued ... 166
Table B06a. Legal Residence by Municipality of Usual Residence, Chuuk: 2000 ... 167
Table B06b. Legal Residence by Municipality of Usual Residence, Chuuk: 2000-cont'd ... 168
Table B06a. Legal Residence by Municipality of Usual Residence, Chuuk: 2000 ... 169
Table B06b. Legal Residence by Municipality of Usual Residence, Chuuk: 2000-cont'd ... 170
Table B06c. Legal Residence by Municipality of Usual Residence, Chuuk: 2000 - cont'd ... 171
Table B06d. Legal Residence by Municipality of Usual Residence, Chuuk: 2000 - continued ... 172
Table B06c. Legal Residence by Municipality of Usual Residence, Chuuk: 2000 - cont'd ... 173
Table B06d. Legal Residence by Municipality of Usual Residence, Chuuk: 2000 - continued ... 174
Table B07a. Length of Continuous Residence and Place of Previous Residence by Municipality of Usual Residence, Chuuk: 2000... 175
Table B07b. Length of Continuous Residence and Place of Previous Residence by Municipality... 176
Table B07a. Length of Continuous Residence and Place of Previous Residence by Municipality ... 177
Table B07b. Length of Continuous Residence and Place of Previous Residence by Municipality... 178
Table B07c. Length of Continuous Residence and Place of Previous Residence by Municipality ... 179
Table B07d. Length of Continuous Residence and Place of Previous Residence by Municipality... 180
Table B07c. Length of Continuous Residence and Place of Previous Residence by Municipality ... 181
Table B07d. Length of Continuous Residence and Place of Previous Residence by Municipality... 182
List of Basic-Tables 2000 FSM Census of Chuuk State
xx Chuuk Branch Statistics Office, Division of Statistics, FSM Department of Economic Affairs
Table B08b. Residence 5 Years Ago by Municipality of Usual Residence, Chuuk: 2000 - continued ...184 Table B08a. Residence 5 Years Ago by Municipality of Usual Residence, Chuuk: 2000 ...185 Table B08b. Residence 5 Years Ago by Municipality of Usual Residence, Chuuk: 2000 - continued ...186 Table B08c. Residence 5 Years Ago by Municipality of Usual Residence, Chuuk: 2000 - continued...187 Table B08d. Residence 5 Years Ago by Municipality of Usual Residence, Chuuk: 2000 - continued ...188 Table B08c. Residence 5 Years Ago by Municipality of Usual Residence, Chuuk: 2000 - continued...189 Table B08d. Residence 5 Years Ago by Municipality of Usual Residence, Chuuk: 2000 - continued ...190 Table B09a. Ethnicity by Municipality of Usual Residence, Chuuk: 2000 ...191 Table B09b. Ethnicity by Municipality of Usual Residence, Chuuk: 2000 - continued ...192 Table B09c. Ethnicity by Municipality of Usual Residence, Chuuk: 2000 - continued ...193 Table B09d. Ethnicity by Municipality of Usual Residence, Chuuk: 2000 - continued ...194 Table B10a. Marital Status and Religion by Municipality of Usual Residence, Chuuk: 2000 ...195 Table B10b. Marital Status and Religion by Municipalit of Usual Residence, Chuuk: 2000 - cont'd ...196 Table B10c. Marital Status and Religion by Municipality of Usual Residence, Chuuk: 2000 - continued ...197 Table B10d. Marital Status and Religion by Municipalit of Usual Residence, Chuuk: 2000 - continued...198 Table B11a. Languages and Dialects Spoken at Home by Municipality of Usual Residence, Chuuk: 2000 ...199 Table B11b. Languages and Dialects Spoken at Home by Municipality of Usual Residence, Chuuk: 2000 - cont'd200 Table B11c. Languages and Dialects Spoken at Home by Municipality of Usual Residence, Chuuk: 2000 - cont'd201 B11d. Languages and Dialects Spoken at Home by Municipality of Usual Residence, Chuuk: 2000 - continued ...202 Table B12a. School Enrollment and Educational Attainment by Municipality of Usual Residence, Chuuk: 2000 ..203 Table B12b. School Enrollment & Educational Attainment by Usual Residence, Chuuk: 2000...204 Table B12c. School Enrollment & Educational Attainment by Municipality of Usual Residence, Chuuk: 2000 ...205 Table B12d. School Enrollment and Educational Attainment by Municipality of Usual Residence, Chuuk: 2000 ..206 Table B13a. Literacy, Vocational Training, and Veteran Status by Usual Residence, Chuuk: 2000 ...207 Table B13b. Literacy, Vocational Training, and Veteran Status by Usual Residence, Chuuk: 2000 ...208 Table B13c. Literacy, Vocational Training, and Veteran Status by Muni. of Usual Residence, Chuuk: 2000...209 Table B13d. Literacy, Vocational Training, and Veteran Status by Muni. of Usual Residence, Chuuk: 2000 ...210 Table B14a: Labor Force Characteristics by Municipality of Usual Residence, Chuuk: 2000...211 Table B14b. Labor Force Characteristics by Municipality of Usual Residence, Chuuk: 2000 - cont'd...212 Table B14c: Labor Force Characteristics by Municipality of Usual Residence, Chuuk: 2000 - continued...213 Table B14d. Labor Force Characteristics by Municipality of Usual Residence, Chuuk: 2000 - continued...214 Table B15a. Labor Force Characteristics from U.S. Definition and Duration of Work in 1999 by Municipality of
Usual Residence, Chuuk: 2000...215 Table B15a. Labor Force Activity Charact. from U.S. Definition and Duration of Work in 1999...216 Table B15c. Labor Force Characteristics from U.S. Definition and Duration of Work in 1999 ...217 Table B15d. Labor Force Characteristics from U.S. Definition and Duration of Work in 1999 ...218 Table B15AA. Activity and Place of Work in Week Before Census and Workers in Families in 1999 ...219 Table B15AB. Activity and Place of Work in Week Before Census and Workers in Families in 1999...220 Table B15Bc. Activity and Place of Work in Week Before Census and Workers in Families in 1999...221 Table B15BD. Activity and Place of Work in Week Before Census and Workers in Families in 1999...222 Table B16a. Occupation by Municipality of Usual Residence, Chuuk: 2000 ...223 Table B16b. Occupation by Usual Residence, Chuuk: 2000 - continued ...224 Table B16c. Occupation by Municipality of Usual Residence, Chuuk: 2000 - continued...225 Table B16d. Occupation by Usual Residence, Chuuk: 2000 - continued ...226 Table B17a. Industry by Municipality of Usual Residence, Chuuk: 2000...227 Table B17b. Industry by Municipality of Usual Residence, Chuuk: 2000 - continued ...228 Table B17c. Industry by Municipality Usual Residence, Chuuk: 2000 - continued...229 Table B17d. Industry by Municipality of Usual Residence, Chuuk: 2000 - continued ...230 Table B18a. Class of Worker and Commuting Charact. by Municipality of Usual Residence, Chuuk: 2000...231 Table B18b. Class of Worker and Commuting Charact. by Municipality of Usual Residence, Chuuk: 2000...232 Table B18c. Class of Worker and Commuting Charact. by Municipality of Usual Residence, Chuuk: 2000 - cont'd233 Table B18d. Class of Worker and Commuting Charact. by Municipality of Usual Residence, Chuuk: 2000 - cont'd234 Table B19a. Income in 1999 by Municipality of Usual Residence, Chuuk: 2000...235 Table B19b. Income in 1999 by Municipality of Usual Residence, Chuuk: 2000 - continued...236 Table B19c. Income in 1999 by Municipality of Usual Residence, Chuuk: 2000 - continued...237 Table B19d. Income in 1999 by Municipality of Usual Residence, Chuuk: 2000 - continued...238
2000 FSM Census of Chuuk State List of Basic-Tables
Table H01. Structural Characteristics, Chuuk State: 2000 ... 239 Table H01. Structural Characteristics, Chuuk State: 2000 - continued ... 240 Table H01. Structural Characteristics, Chuuk State: 2000 - continued ... 241 Table H01. Structural Characteristics, Chuuk State: 2000 - continued ... 242 Table H02. Utilitzation Characteristics, Chuuk State: 2000... 243 Table H02. Utilitzation Characterisitcs, Chuuk State: 2000 - continued... 244 Table H02. Utilitzation Characteristics, Chuuk State: 2000 - continued... 245 Table H02. Utilitzation Characterisitcs, Chuuk State: 2000 - continued... 246 Table H03. Plumbing and Water Source Characteristics, Chuuk State: 2000 ... 247 Table H03. Plumbing and Water Source Characteristics, Chuuk State: 2000 - continued ... 248 Table H03. Plumbing and Water Source Characteristics, Chuuk State: 2000 - continued ... 249 Table H03. Plumbing and Water Source Characteristics, Chuuk State: 2000 - continued ... 250 Table H04. Cooking Facilities and Appliances, Chuuk State: 2000... 251 Table H04. Cooking Facilities and Appliances, Chuuk State: 2000 - continued... 252 Table H04. Cooking Facilities and Appliances, Chuuk State: 2000 - continued... 253 Table H04. Cooking Facilities and Appliances, Chuuk State: 2000 - continued... 254 Table H05. Vehicles and Monthly Costs, Chuuk State: 2000 ... 255 Table H05. Vehicles and Monthly Costs, Chuuk State: 2000 - continued ... 256 Table H05. Vehicles and Monthly Costs, Chuuk State: 2000 - continued ... 257 Table H05. Vehicles and Monthly Costs, Chuuk State: 2000 - continued ... 258 Table H06. Tenure and Financial Characteristics, Chuuk State: 2000 ... 259 Table H06. Tenure and Financial Characteristics, Chuuk State: 2000 - continued ... 260 Table H06. Tenure and Financial Characteristics, Chuuk State: 2000 ... 261 Table H06. Tenure and Financial Characteristics, Chuuk State: 2000 - continued ... 262
SYMBOLS
• A dash "–" represents zero or a percent which rounds to less than 0.1
• Three dots "..." means not applicable, or information suppressed for reasons of confidentiality
MAP OF FSM
xxiv Chuuk Branch Statistics Office, Division of Statistics, FSM Department of Economic Affairs EXECUTIVE SUMMARY
This report presents the 2000 FSM Census of Population and Housing data for Chuuk, along with historical data from recent censuses. This report is organized into 12 chapters, which briefly summarize information on the population's demographic, social, economic and housing conditions. Apart from the obvious use of the report in planning, policy formulation, and in administration processes, the data presented in the report can also serve as a benchmark information in monitoring and evaluation activities.
The following paragraphs present a few of the major facts about the resident population of Chuuk State. These are only a few of the main outcomes and should not be viewed as the only information available.
Demographic Characteristics
Population size and projections. The population of Chuuk State increased from 31,596 in 1973 to 53,319 in 1994 and to 53,595 persons in the year 2000. The population by region in 2000 was 14,722 in Northern Namoneas, 11,694 in Southern Namoneas, 14,049 in Faichuk, 6,911 in the Mortlocks and 6,219 in Oksoritod. Between 1994 and 2000, the population grew by about .1 percent per year, which is much lower than the 2.2 percent per year for the period 1989 to 1994 and the 2.0 percent per year for the period 1973 to 2000.
Population density. Population density describes the number of people living in a specific geographic area (i.e., country, state, island, etc.) divided by the landmass of the geographic area. The population density in the State of Chuuk in 2000 was about 1,094 persons per square mile. Regional differences existed in 2000, with the highest density in the Northern Namoneas region (1,900 persons per square mile) and the lowest in Oksoritod region (590 persons per square mile). The high density in the Northern Namoneas region was expected as Weno is Chuuk’s major urban and administrative center.
Median Age. The median age - the age at which half of the population is younger and half older - in the State of Chuuk in 2000 was 18.5 years, an increase of 2 years from the 16.5 years in 1973. The present median age suggests that Chuuk had one of the youngest populations in the FSM.
Sex Ratio. Most populations have slightly more male than female births. As the population ages, the difference
decreases because of higher male mortality. The sex ratio (number of males per 100 females) for Chuuk State in 2000 was about 103 (about 101 in Northern Namoneas, 106 in Southern Namoneas, 104 in Faichuk, 102 in Mortlocks, and 100 in Oksoritod. The sex ratio in the State of Chuuk decreased by about 2 percentage points between 1994 and 2000.
Households. The total number of households declined from 7,043 in 1994 to 6,976 in 2000. However, the average
number of persons per household increased slightly between the two census years, from 7.5 persons to 7.7 persons. Moreover, there was a marked regional difference in the average family size in the household. In 2000, the Mortlocks recorded a low of 7.19 persons per household, and the Halls in Oksoritod reached 9.1 persons per household.
Marital status. Adults in Chuuk State increasingly delay marriage. The average age at first marriage in Chuuk
increased from about 25 years in 1989 to about 27 years in 2000. The proportion of married population decreased from about 60.2 percent in 1973 to about 49.7 percent in 2000. In 2000, proportions married by region were 48.8 percent in Northern Namoneas, 49.6 in Southern Namomeas, 50.2 in Faichuk, 51.1 in Mortlocks, and 50.1 Oksoritod.
Fertility. Almost all fertility indicators revealed a decline in fertility levels in Chuuk. For one thing, the crude birth rate (CBR) dropped from 32 in 1994 births per 1,000 persons to 27.5 births per 1,000 persons in 2000. The total fertility rate (TFR) declined from 5.6 children per woman to 4.5 over the same period.
Mortality. Mortality rates have generally declined in the past three decades; however, accurate mortality records are not always available. For instance, mortality records would indicate that the crude death rate in Chuuk has generally been about 4 deaths per 1,000 persons. However, it is more likely to be 7 deaths per 1,000 persons. Infant mortality rates have declined in the past 30 years. In the early 1970s, infant mortality rates ranged between 71 and 75 infant deaths per 1,000 births. In 2000, the infant mortality rate was just about 43 infant deaths per 1,000 births. Also, from the early 1970s to the year 2000, life expectancy rose from 59 to 66.
2000 FSM Census of Chuuk State Executive Summary Birthplace. Over 98 percent of the Chuuk residents in 1994 and 2000 were born in Chuuk. The proportion of Chuuk residents born outside of Chuuk decreased between 1994 and 2000, especially among the Asian-born persons. The proportion of Asian-born persons declined by 50 percent (from about 489 persons in1994 to about 51 in 2000). This decline was largely due to the dissolution of the foreign fishing venture (which mostly employed these persons) in the intercensal period.
Residence 5 years before the census. Cross-classification of data on residence 5 years before the census with current residence showed the level and pattern of short-term migration. This kind of analysis further provided an estimation of inter-state migration per year. Among the 2000 Chuuk residents aged 5 years and over, about 1 percent lived outside of Chuuk Stated during 1995 (about 1.4 percent for the Lagoon and less than .5 percent for the Outer Islands). The result provided an estimated net interstate out-migration of 1.3 per 1,000 per year for the period 1994 and 2000, Additionally, it provided estimations of internal net migration rate the Lagoon (1.2 per 1,000) and the Outer Islands (-3.6 per 1,000) for the same period.
Social Characteristics
Religion. The Catholic and Protestant were the major religions in the State of Chuuk. The 1994 and 2000 censuses indicated that 53 percent of the residents of Chuuk were Catholics, 43 percent were Protestants and 4 percent were of other religion. Majority of the municipalities on both the Lagoon and Outer Islands were Catholics.
Ethnicity and Language Spoken at Home. About 94 percent of Chuuk residents were of Chuukese ethnicity. Language corresponds to ethnicity. Over 99 percent reported Chuukese as their commonly used language at home. About 91 percent of Chuuk residents reported English as their second most commonly used language.
School Enrollment. In 2000, about 56 percent of persons age 3 to 24 were enrolled in school. Among these enrolled persons, about 5 percent were attending pre-school, 64 percent were in elementary school, 27 percent in high school, and 4 percent in college.
Educational Attainment. In 2000 about 17.8 percent of among all persons 25 years old and over did not complete any level of schooling, compared to 34.6 percent in 1980. Also, the proportion attaining high school increased from 16.4 to 34.1, and the proportion attained college increased from 5.8 percent to 13.7 percent.
Economic Characteristics
Labor Force Participation. Labor force participation was compiled based on the current economic activity (that is, economic activities during a seven day reference period). The overall labor force participation rate of persons 15 years and over during the week before the 2000 Census in Chuuk was about 58 percent, compared with 38 percent in 1994. The male participation rate was (67 percent) while the female was (48 percent). The unemployment rate in 2000, based on UN classification, was over 34 percent. By region, unemployment was highest in Faichuk at about 40 percent, followed by Oksoritod with 38 percent and Northern Namoneas with 37 percent. Southern Namoneas and Mortlocks had slightly lower unemployment rates of 23 percent and 33 percent, respectively.
Subsistence. Out of about 11,979 employed persons in 2000, about 7,433 persons were engaged in agricultural, fishery or related activities. About 2,299 persons were engaged in market oriented agricultural, fishery, or related activities while the remaining 5,134 persons were in pure subsistence (did subsistence for household consumption only and did not sell).
Industry and Occupation. The formal work force in Chuuk in 2000 was about 4,546 (a 15 percent decrease since
1994). The number of workers in most of the industries decline, except for four industries: Gas, electricity & water supply, Transportation & communication, Wholesale & retail trade, and Public Administration.
About 36 percent of the formal work force were manages and professional workers. Technicians and associate professionals (about 13 percent) and service workers (about 17 percent) were also reported as major occupations. Administrative support also had a high percentage (12 percent). Skilled agricultural and fishery workers constituted about 1 percent of all formal workers.
Executive Summary 2000 FSM Census of Chuuk State
xxvi Chuuk Branch Statistics Office, Division of Statistics, FSM Department of Economic Affairs
Class of Worker. The percentage share of private and public workers in Chuuk changed between 1994 and 2000. The private sector’s share of the work force increased from 37.6 in 1994 to 43.4 in 2000. Public sector’s share on the other hand decreased from 62.4 in 1994 to56.9 in 2000.
Income. Out of the 6,976 households in Chuuk in 2000, about 6,385 households reported income for 1999. Their
median income for these households was about $2,800. The mean household income was higher at about $9,600. The median household income by region was about $4,700 for Northern Namoneas, $2,900 for southern Namoneas, $1,800 for Faichuk, and $2,000 for Mortlocks and Oksoritod. The overall median individual income was about $800.
Housing. The total number of housing units increased from about 5,400 in 1980 to over 7,500 in 1994 then decline slightly to 7,400 in 2000. In all census years observed, about 92 to 94 percent of the households were occupied. The number of housing units with 8 or more rooms increased from about 0.4 percent in 1980 to about 0.9 percent 1994 and 2000. Housing conditions in Chuuk improved over the years. About 30 percent of all housing units were built between 1993 and 2000. In 2000, about one-third (27 percent) of the housing units had electricity or solar power compared to 22 percent in 1980. About 25 percent of all the housing units had piped water in 2000 compared to 3 percent in 1980. Similarly, of all housing units in 2000, over 34 percent had flush toilet and about 36 percent had bathtubs or shower. Lastly, a set of basic tables is presented at the end of the report. A set of detail tables is also available in a separate publication. The detailed tables set provides a breakdown of data by municipality. These serve as a basic source of data on Chuuk's population and housing characteristics.
CHAPTER 1 INTRODUCTION
The creation of the independent and sovereign nation of the Federated States of Micronesia (FSM) under the Compact of Free Association with the United States caused a growing need for social and economic development planning. Consequently both the government and private sectors needed social, economic, and demographic data. Furthermore, as in many developing countries, administrators and planners in Chuuk State, in their quest for social and economic development often contended with incomplete or unavailable information. The 2000 FSM Census of Chuuk State was thus conducted as part of the overall effort to provide current and updated information required for planning and administrative purposes. This report presents basic analysis of the 2000 FSM Census results of Chuuk, which also covers the 1994 Census results for comparison purposes.
This chapter locates Chuuk geographically and presents a brief history and population distribution of Chuuk State in selected census years, along with some background on the methodology of the 2000 FSM Census. Chapter 2 presents population change and structure. Chapter 3 presents households and marital status. Chapters 4 to 6 discuss population dynamics (fertility, mortality, and migration). Chapters 7 to 11 provide the basic analysis for social and economic characteristics. Chapter 12 presents housing characteristics. A separate publication presenting detailed tabulations for Chuuk from the 2000 FSM Census has also been compiled and disseminated by the Division of Statistics, of the FSM Department of Economic Affairs. Supplemental information and data from previous selected censuses (1973, 1980, 1989 and 1994) are used to present change over time.
Geographical characteristics
Chuuk, situated at 151022' to 150004' east longitude, 707' to 7041' north latitude, is approximately 650 miles east of
Guam, 1,200 miles west of the Marshall Islands and 380 miles west of Pohnpei. The main atoll, at the center of the State, is surrounded by a quarter mile long, triangular reef varying from 30 to 49 miles in diameter, which protrudes above the water in about 50 places to form low islets. The lagoon, having a circumference of 140 miles and an area of 823 square miles, contains six fairly large, high, habitable volcanic islands and many lesser ones, of which about one hundred have names (Goodenough 1951:19). The high islands and many low coral sand islets in the lagoon have a total land area of 38.6 square miles. Chuuk consists of approximately 100 islands, 43 of which are inhabited with a total land area of 49.2 square miles scattered over an ocean area 300 miles wide and 600 miles long.
Climate
Chuuk State is characterized by a wet, warm and humid climate, which is similar to most Pacific Islands in the North Pacific. Weather variations are most evident in wind and rainfall characteristics. Temperature and relative humidity levels remain consistent throughout the year. Tropical disturbances, even though highly unpredictable, are generally quite seasonal in nature.
Prevailing northeasterly and southerly winds are moderate (7 to 11 miles per hour) throughout the year. Northeasterly trade winds occur during the months of November through April with higher wind speed being prevalent from January through March. Lower velocity winds from the south, southeast and southwest are predominant during the months of June through October.
The average rainfall in Chuuk is approximately 150 inches per year. Monthly rainfall ranges from 6 to almost 16 inches. The least amount of monthly rainfall (6 to 9 inches) occurs during the months of January to March as stronger northeasterly trade winds approach Chuuk.
Ambient air temperatures typically range from a daily low of 750 Fahrenheit (240 Centigrade) to an average high of 870
Fahrenheit (310 Centigrade). Daily levels of relative humidity range from 78 percent, during daylight hours, to
approximately 85 to 87 percent during the night and early morning hours.
Tropical storms generally occur between the months of July and November; many are associated with the influence of the inter-tropical convergence zone which typically moves northward through Chuuk during this time of the year. The occurrence of typhoons in immediate vicinity of Chuuk is uncommon. However, in 1987,Typhoon Nina passed close to Chuuk Lagoon causing heavy damage to homes, and buildings and agricultural crops. Again in November of 1990,
Chapter 1. Introduction 2000 FSM Census of Chuuk State
2 Chuuk Branch Statistics Office, Division of Statistics, FSM Department of Economic Affairs
Typhoon Owen passed through the Northern Outer Islands (The Halls and Nomunuito) devastating many of the small atoll islands.
Regional Sub-Division
Chuuk State is divided into five (5) political regions. Chuuk Lagoon has 3 of the regions: (1) Northern Namoneas (7.75 square miles), consisting of Weno (formerly known as Moen), Piis-Paneu (formerly Piis-Moen), and Fono;(2) Southern Namoneas (11.72 square miles), consisting of Tonoas (formerly Dublon), Fefen ,Etten, Siis, Uman, Parem and Totiw; and (3) Faichuk (19.25 square miles), consisting of Eot, Udot, Romonum, Fanapanges, Wonei, Paata, Tol and Polle. Chuuk Outer islands makes up the two remaining regions:(4) The Mortlocks (4.91 square miles) consisting of Nama, Losap, Piis-Emwar, Namoluk, Ettal, Lekinioch, Oneop, Kuttu, Moch, Satowan and Ta; and (5) Oksoritod (10.6 square miles) is formally divided into three areas which are: (1) The Halls (Nomwin, Fananu, Ruo, and Murilo), (2) Namonuito (Makur, Onou, Unanu, Onoun and Piherarh), and (3) Pattiw (Houk, Polowat, Pollap, and Tamatam). Just outside Chuuk Lagoon is small Kuop Atoll, belonging to the people of Uman. The island area of these lagoon islands is 38.6 square miles and makes up almost 80 percent of the state's land area. All of Chuuk's Outer Islands are composed of coral and most are atolls. The Outer Islands have a total land area of just 10.6 square miles with approximately 1,200 square miles of lagoon area.
A Brief History of Census Taking
Before the coming of the Europeans, Chuuk and the islands around Chuuk were much more heavily populated1. The
population of Chuuk was estimated at 35,000 in 1827 (Lutke, 1835). In 1874, a Rev. E.T. Doane traveled on the 'Star' from Pohnpei to the Mortlocks, and wrote back to the Geographical Magazine, published in London. The ship went first to Satowan, where Doane counted "about 1500" people, with about 600 on one islet. He recorded "some 600 or more" on Ettal. The population on Namoluk was "from 300 to 500". When the ship went on to Losap, Doane found:
All the surroundings of the people, their language, dress, proas, ornaments, tattooing, dwellings, the children in
undress, and the women with the native tapa, showed they were in kith and kin with the islanders already visited. The population may reach 500. The island seemed fertile, and capable of furnishing plenty of food (Doane 1874:204-5).
Doane found no more than 150 to 200 persons on Nama, from reports of Natives on the ship. About 1,500 were on Lekinioch. The ship went on to Nukuoro after this.
Spanish Administration
The early Spanish voyages into Micronesia served to introduce islanders to the marvels of Western technology -- ships as large as meetinghouses and strange-looking men with impermeable skin (armor). Of all these wonders the most precious was iron, the durable material that could be worked into tools and weapons. Islanders were quick to appreciate the advantages of iron as a replacement for their fragile implements of bone, shell, and stone. When the Spanish colonized the Mariana’s at the end of the 17th century, the Chuukese, employing the outer island navigators as their middlemen, carried on trade with Guam for iron. If Europeans would not come to Chuuk, the islanders would sail hundreds of miles to search them out and barter for the metal that was more precious in their eyes than gold (Gorenflo & Levin, 1992).
By the end of the 18th century, Europeans were again plying the Pacific, this time to reap a share of the profits in the lucrative China trade. As they did, they rediscovered the Pacific -- sighting and visiting islands that had never before been seen by white men, correcting erroneous positions recorded 200 years earlier and redrawing the maps of the
region. In 1795, James Mortlock, captain of the British trading vessel Young William, gave his name -- and for a time
that of his ship -- to the group of atolls southeast of Chuuk. Nearly 30 years later, John Hall, while in command of another British vessel, sighted the islands that still bear his name. There were dozens of other sightings and brief visits: Monteverde at Nama in 1806; Lutrell at Namoluk, Nama, and Losap in 1808.
In the wake of the early pioneers of the China trade came the naval explorers from France and Russia. When Freycinet, the commander of the earliest of them, stood off Houk for a few hours in 1819, he was greeted by a throng of islanders who chanted "loulou" (the Chamorro loanword for iron). The next of the French naval commanders, Louis Duperrey,
2000 FSM Census of Chuuk State Chapter 1. Introduction
who visited the area in 1824 and mapped half of the Chuuk lagoon, reported the same experience at Pollap. "The word loulou is always on their lips," he wrote. "Axes, knives, nails and large fishhooks are all objects of great value for them." When the Russian naval party under Feodor Lutke spent a week in the Mortlocks in 1828, he found the people to be surprisingly demanding traders. They scoffed at the iron bars and hoop they were offered and insisted on tinderboxes and knives instead. The iron based traffic with Guam and the passing contact with European and American ships had given the outer islanders cosmopolitanism that sometimes astonished ship captains. Tobacco had already made its way into many of these islands and cock fighting was a popular pastime on Murilo by the early 1920s. One
old man from the Namonuitos astonished a captain by carrying on a conversation in Spanish while devouring
pate-de-foie-gras with unfeigned relish.
Throughout this period of contact, the high islands of Chuuk remained something of a backwater. Like the inhabitants of other volcanic islands in Micronesia, the people there had lost their navigational skills through disuse over the years. They were also less visited than the atolls and were less accustomed to dealing with foreign merchants and seamen. Moreover, the high islands were plagued by the incessant war between districts that was carried on amid ever shifting alliances. Dumont d'Urville, the last of the great French naval commanders to visit Micronesia, brought his two ships into the Chuuk lagoon in 1839 and anchored off Fefen. The Frenchmen found the islanders thoroughly unfamiliar with muskets, European food (cheese and wine and biscuits), and even clothes. The French visit ended tragically when a dozen Chuukese were killed in a battle that broke out between the visitors and the people of a nearby island. The next visitor to Chuuk, Andrew Cheyne in 1844, was also attacked. As Cheyne's schooner lay at anchor off Siis, several hundred men rushed the European seamen and killed several before they were routed. Cheyne publicized the attack in a maritime journal and issued a warning that "no vessel should visit the island group unless well-manned and armed, as the natives will be certain to attack any vessel that they may find in a defenseless state" (Gorenflo & Levin, 1992). Ship captains seemed to have heeded Cheyne's warning and given Chuuk a wide berth for the next 30 years. One who
didn't -- Captain Alfred Tetens of the Vesta -- almost lost his ship in a surprise raid in 1868. For years, Chuuk -- or
"dreaded Hogoleu", as it was sometimes called -- bore a notorious reputation among Western mariners. Islanders
initiated not all the violence, however. The infamous Carl and two or three other blackbirding vessels visited the
Mortlocks in the early 1870s and shanghaied dozens of men for work in the plantations of the South Pacific. Years later a handful of these recruits returned, decked out in Western clothing and eager to tell of their adventures -- but within four months all were dead, possibly victims of diseases they had contracted during their long stay abroad. When three Pohnpeian missionary couples were taken to the Mortlocks in 1874 to introduce Christianity to the islands for the first time, they were greeted with a sullen silence. Memories of the black birding visits were still painfully fresh in the minds of the Mortlockese. Yet, the missionary couples were reluctantly allowed to remain, and within three years had won over 800 converts to Protestantism. The Mortlocks, which had long been the gateway to Chuuk, sent one of the Pohnpeian teachers to Uman in 1879. The spread of Christianity throughout the lagoon islands followed quickly, aided by the work of Robert Logan and other American missionaries. Under the impact of these missionaries, the warfare that was always breaking out between different sections of Chuuk slowly began to subside, although it was another 20 years before it ended altogether.
Merchants soon followed the missionaries into Chuuk, as they did in so many other parts of the Pacific. August Hartman opened a trading station on Fefen, Charles Irons went to Polowat, and Frederick Narruhn established a business on Weno, with Pierre Nedelic and Jack Ehlers coming after them. These pioneer traders found a market for Western goods, including calico and serge, but their work was not without its risks. Hartmann and two of the early traders in the Western islands were killed, and a couple of others were forced to flee for their lives. Even so, commerce and Christianity were by this time firmly rooted in Chuuk.
Spanish annexation of the Carolines in 1885, which ushered in the era of colonial rule, passed virtually unnoticed in Chuuk. The Spanish government, which had its capital on Pohnpei, was kept so occupied by the uprisings and intrigues on that island that it had neither the time nor the inclination to extend effective rule to any of the other islands in the eastern Caroline. A Spanish warship stopped off at Chuuk in July 1886 to raise the flag over the island group.
The next visit was nine years later when the gunboat Quiros came to put an end to the hostilities between Uman and
part of Fefen. The chiefs were assembled on board the ship, a peace treaty was signed, and the Spanish steamed off, confident that they had accomplished their purpose. They were badly mistaken. Within a year fighting between Uman and Fefen resumed, Romanum slaughtered a deputation of chiefs from Udot, and a Japanese trader was strangled to
Chapter 1. Introduction 2000 FSM Census of Chuuk State
4 Chuuk Branch Statistics Office, Division of Statistics, FSM Department of Economic Affairs
death on Tol. The Spanish sent a ship once more to investigate the disturbances and put an end to the trouble, but with no more success than before (L.J. Gorenflo, 1995).
Table 1.1 shows in tabular form some of the early population estimates for Chuuk lagoon and a few of the outer islands. (Some of the estimates are from the German administrative period.)
Table 1.1. Early Population Estimates for Major Island Units in Chuuk State: Selected Years
Outer Islands
Year Chuuk Lagoon Losap Nama Nomwin Houk Polowat
1819 900 1950 350 1860 500 1877 12,000 1901 12,000 300 1,100 1903 430 320 1907 13,514 1908 > 200 1909 177 1914 11,000
Source: 1989 Chuuk State Census Report, Table 1.1; L.J. Gorenflo, 1995
One result of Spanish period may have been an increased mortality from violence. Of course, no demographic data exist from this period. Traders on Chuuk introduced iron and steel tools, which eventually replaced the bone and shell tools, but they also introduced guns to disastrous effect. Gladwin and Sarason, note, for example:
On the small island of Romanum, less than a mile long ... warfare raged intermittently between people of the two ends of this one island. On the western end lived an American trader, while a Japanese trader occupied the eastern end, and each supplied the respective partisans with guns. The slaughter was considerable. And in the meanwhile, the people of Romanum also fought wars with villages on the neighboring islands of Udot and Tol (1953:40-41).
German Administration
The Germans, who took over the islands from hapless Spain in 1899, found two dozen Japanese traders in Chuuk, including Koben Mori and Shirai. Among the trade goods that they were selling to the Chuukese in exchange for their copra were liquor, guns, and dynamite. The German warship that arrived to announce the turnover of rule warned the Japanese that they were not to continue selling contraband articles to the people. Unlike the Spanish, the Germans intended to enforce their regulations. On a surprise visit two years later, German authorities found liquor and guns in the Japanese warehouses, they expelled all the Japanese traders except Mori and served notice to the Chuukese people that they intended to disarm them. The Germans also arrested three local chiefs accused of murder and hauled them off to Pohnpei to serve their jail sentences. This show of muscle had a sobering effect on the population. When the Germans returned in 1904 to make good on their promise to collect all arms, the Chuukese cooperated fully and turned in nearly 500 guns.
Chuuk, long known for its violence, submitted quietly and with a sense of relief to the German governor, as if the people had been waiting years for a show of leadership strong enough to compel their submission. Under the direction of the Germans, the Chuukese began clearing their land and planting coconut and fruit trees. The very chiefs who had been the fiercest turned to building roads and docks, and leaders in all the islands furnished a count of their people for the first census of the islands. Gratified by the progress shown, the Germans appointed flag chiefs to who they gave authority over the six regions of Chuuk lagoon. The copra industry prospered in Chuuk, and when Japanese merchants eventually returned, they did so under terms set by the German government. Now and then, the Germans were forced to intervene in island affairs, as when they moved to put down a revival of traditional dancing in the Mortlocks that threatened to exhaust the population and deplete the food supply, but for the most part, Chuuk was a model colony. The Germans, who thought highly of Chuukese, recruited several to serve as policemen on Pohnpei.
The greatest disruption during this period was the terrible typhoon that struck the Mortlocks in March 1907, taking over 200 lives and leaving many of the islands denuded. Emergency rations were sent to the stricken islands and more than 700 Mortlockese were relocated in the months that followed -- first on Saipan and then on Pohnpei for permanent resettlement. These refugees became the nucleus of what would be a growing Chuukese community on Pohnpei. The
2000 FSM Census of Chuuk State Chapter 1. Introduction
extensive typhoon damage was a major setback for the expanding copra industry and it was years before production reached its pre-typhoon level. Yet, new employment opportunities were opening for Chuukese during these same years. Phosphate mining began on Nauru in 1902 and on Angaur, Palau, a few years later. By 1908 over half of the 500 islanders working on Nauru were Chuukese, and 200 more were employed in the mine on Angaur on contracts that lasted between six months and a year.
These years saw the arrival of German missionaries representing other religious denominations. Lienbenzell missionaries took over the work of the American Congregationalists in 1907, and Catholic priests and brothers of the Capuchin Order launched their work in Lukunoch (today’s spelling is Lekinioch) in 1911, moving on to Chuuk lagoon a year later.
The Germans acquired these islands in 1899 when Spain sold the northern Mariana’s and the Caroline Islands to the German government following Spain's defeat in the Spanish-American war. When, in 1909, the German government finally appointed a resident administrator for Chuuk and set up a branch office on Tonoas, the people provided free labor for the construction of the new facilities. They had only a few people on the administrative staff, and their main aim was economic exploitation. They encouraged the Chuukese to produce copra, fish, and lumber for sale. They also ordered each family to plant at least 100 coconut palms. Coconut trees became the dominant species for approximately two thirds of the slope of the mountains. It became expensive to sacrifice a coconut for drinking when it could be used for making copra (Coulter 1957:297).
Even the head tax that the Germans inaugurated in 1910 caused no ill feeling among the Chuukese, who continued to look to the government to do what they could not easily do for themselves: arbitrate local disputes and keep the peace. In its final years, German administration offered some additional benefits to the population. A government physician, assigned to Chuuk, made the rounds of the islands to offer medical services while he studied health problems in the area. The government also made plans to build a 40-bed hospital and a vocational training school in Chuuk, but before these could be implemented Germany was stripped of its possessions.
The Germans also effectively stopped Chuukese "warfare" and set a standard for relationships for future administrations:
On arrival the Germans ordered the Chuukese to forfeit their guns and stop making war. In response, the Chuukese, at that time numbering about 10,000, listened to the Germans, turned in their 436 guns and stopped making war. This response might have been a result of the Chuukese realization that their traditional system could no longer handle this situation of warfare with German weapons...From this incident the Chuukese attained the attitude that the foreign administration holds the ultimate authority for law and order. (Mirrer 1971:18-19).
The Germans took no systematic censuses in Chuuk (or any other area of Micronesia) during their comparatively short reign. However, during the various South Seas Expeditions in the early 1900s, censuses of individual islands were collected, with the results compiled and displayed in the various volumes of their reports.
Japanese Administration
Japan seized Germany's possessions in Micronesia in 1914 at the outbreak of World War I and established its military headquarters on Tonoas. From there the Japanese Navy ruled Chuuk and the rest of Micronesia for the next seven years. The new ruling power quickly made its impact felt in Chuuk. With characteristic energy, Japanese began work on a public works program that included the installation of harbor facilities, the construction of docks and the laying of roads on the islands. They also built the first hospital in Chuuk, staffed by naval doctors and Japanese health aides. Perhaps their most significant early achievement, however, was the establishment of a public school system that came to include six elementary schools throughout Chuuk.
Japan's administrative policy was, from the very start, far more aggressively assimilationist than its predecessors. Japan never concealed the fact that it intended to "place a permanent Japanese imprint" on Chuuk. Japanese, like the Germans before them, appointed flag chiefs over the islands. Japanese administrators presided over meetings of the flag chiefs, removing those who were regarded as unsuitable in their eyes and replacing them with others who were more receptive to Japanese policies. Prominent leaders were offered cultural tours of Japan to introduce them to