Market Update
The market capitalisation of ASX Listed Investment Companies (LICs) and Listed Investment
Trusts (LITs) grew by 9.1% to $44.2b in the June 2020 quarter. The recovery was followed
by the implementation of unprecedented monetary and fiscal policy stimulus, both in
Australia and globally. Albeit the continued market volatility resulted in no new listings for the
sector, with secondary offerings also being limited to a total of just $481k.
Regal Investment Fund (RF1)
was the top performing LIC/LIT, with a net shareholder
return of 68.9% in the June quarter versus a pre-tax NTA return (incl. net dividends) of
41.1%. Returns were fueled by all fundamental long/short investment strategies including
Market Neutral, Australian, Global Alpha, Small and Emerging Companies. Key contributing
long positions included De Grey Mining, Novonix and buy now pay later provider Zip Co.
Top Investment Picks
Inside this edition
Market Update
Sector Summary
Profiles of 70 LIC/LITs
LISTED INVESTMENT COMPANIES
AND TRUSTS
.
Hayden Nicholsonhnicholson@bellpotter.com.au
BELL POTTER SECURITIES LIMITED ANC 25 006 390 7721
AFSL 243480
DISCLAIMER:
THIS REPORT MUST BE READ WITH THE DISCLAIMER ON PAGE 103 THAT FORMS PART OF IT.
It is important that clients are aware that the share price of a LIC/LIT is impacted by the oscillation of the discount or premium to NTA/NAV, which should be taken into consideration when investing in LIC/LITs. We therefore advise clients to view this report in conjunction with the Bell Potter Weekly Indicative NTA. For further information please speak to your Bell Potter Adviser.
SOURCE: IRESS, COMPANY REPORTS, BELL POTTER RESEARCH. DATA AS AT 30 JUNE 2020. 1 YEAR RETURNS INCLUDE NET DIVIDENDS. NET YIELD BASED ON LAST 12 MONTHS. PLEASE NOTE THAT HISTORICAL PERFORMANCE IS NO GUARANTEE OF FUTURE PERFORMANCE.
Index
Table of Contents 2 Market Update 3 Summary Domestic Equity 8 Global Equity 14 Alternative Strategy 20 Premium/Discount to NTA 24 Liquidity 25
LIC/LIT Investment Profiles Domestic Equity Large Capitalisation 27 Large/Medium Capitalisation 30 Medium/Small Capitalisation 41 Small/Micro Capitalisation 53 Income 59 Other 61 Global Equity Equities 63 Global (Other) 75 Asia 80 Alternative Strategy Long/Short (Global) 83 Long/Short 87 Private Equity/Assets 89 Fixed Income 92
Appendix A: Glossary of terms 97 Appendix B: Performance 99 Appendix C: Disclosures 101
Global Value Fund Limited (GVF)
:
Multi-asset discount capture
Share Price Pre-Tax NTA Prem/Disc Net Yield 1yr Returns: Share Price Pre-Tax NTA
$0.92
$1.00
-8.3%
6.3%
0.6%
-0.2%
GVF invests globally using a discount capture strategy, owning a range of global assets
purchased at a discount to their intrinsic value. GVF aims to provide an alternative source of
market outperformance compared to more common stock selection strategies, identifying or
creating catalysts that will be used to unlock the identified value. On average the LIC/LITs
covered in this report experienced discounts of 10.6%, 12.9% and 16.4% between domestic,
global and alternative investment mandates respectively. These are some of the widest
discounts seen to date, proving a unique investment opportunity for GVF. In the June
investment update, portfolio manager and director Miles Staude noted that the discount
capture strategy employed by GVF had generated gross portfolio returns of 9.3% for the
quarter. The see-through value of the portfolio is now considerably higher than it was prior to
the market sell-off.
MFF Capital Investments (MFF):
Global exposure with long-term performance
Unit Price Pre-Tax NTA Prem/Disc Net Yield 1yr Returns: Share Price Pre-Tax NTA
$2.71
$2.81
-3.5%
1.7%
6.7%
-1.3%
Global equity mandate that has provided shareholders with a net return of 18.7% p.a. (incl.
dividends) over the past 10 years from investments that have attractive business
characteristics at a discount to their assessed intrinsic values. The portfolio is highly
transparent and concentrated, with the top 20 disclosed holdings accounting for ~97% of
this. Notable portfolio weights for June included Visa (18.5%) and MasterCard (16%). Net
cash as a percentage of investment assets (incl. net cash) had also grown to 44% at the end
of the month. This position was adopted over the short-term to prevent capital depreciation.
High net cash balances should provide for greater liquidity and allow the fund to capitalise on
identified long-term undervalued investment opportunities.
Australian Foundation Investment Company Limited (AFI)
:
Sustainable income
Share Price Pre-Tax NTA Prem/Disc Net Yield 1yr Returns: Share Price Pre-Tax NTA
$6.09
$5.96
2.2%
3.9%
1.2%
-4.7%
AFI recently announced guidance on its 30 June final fully franked dividend, maintaining this
at 14 cps. This marks 32.5 years since the last cut to income. AFI reported a preliminary
unaudited profit reserve of $1.1b for the financial year. It also boasted a franking credit
balance of $207.9m at the end of FY20. Given the current payout, this provides investors
with approximately 3.8 years dividend coverage. AFI is now trading at an indicative premium
of ~3.8% to pre-tax NTA, yielding 3.8% fully franked (5.4% grossed up).
Table of Contents
Market Update
3
Summary
Domestic Equity
8
Global Equity
14
Specialist Strategy
20
Premium/Discount to NTA
24
Liquidity
25
LIC/LIT Investment Profiles
Domestic Equity
Large Capitalisation
27
AFI, ARG, AUI
Large/Medium Capitalisation
30
MLT, BKI, DUI, CIN, WLE, WHF, PIC, AMH, CAM, CLF, FSI
Medium/Small Capitalisation
41
WAM, OPH, MIR, QVE, WAX, CDM, WIC, TOP, RYD, TEK, WAA, NAC
Small/Micro Capitalisation
53
WMI, SEC, NSC, NCC, ACQ, OZG
Income
59
DJW, PL8
Other
61
SNC, FGX
Global Equity
Equities
63
MGG, MFF, MHH, WGB, PMC, PGF, PIA, TGG, EGD, EGF, WQG, EGI
Global (Other)
75
ALI, GVF, TGF, FGG, HM1
Asia
80
PAI, EAI, PAF
Alternative Strategy
Long/Short (Global)
83
LSF, VG1, APL, RF1
Long/Short
87
ALF, AEG
Private Equity/Assets
89
BAF, PE1, BTI
Fixed Income
92
GCI, MXT, MOT, NBI, PCI
Appendix A:
Glossary of terms
97
Appendix B:
Legend to Performance Measures
99
Market Update
There were no IPOs in the June 2020 quarter, resulting in zero primary market activity for the first half of the calendar year. The
increased volatility and widening of discounts across the sector has prohibited new listings for many prospective LICs/LITs. Figure 1
depicts the strong decline in IPO capital raised following the 2019 calendar year where a total of $4.1b was amassed. This included
eight new listings with credit income funds drawing the most attention.
KKR Credit Income Fund (KKC), Partners Group Global
Income Fund (PGG), Perpetual Credit Income Trust (PCI)
and
MCP Income Opportunities Trust (MOT)
raised a combined
$2.2b.
Figure 1 - LIC/LIT IPOs
Figure 2 - LIC/LITs IPOs compared to the ASX
SOURCE: BLOOMBERG & BELL POTTER. DATA AS AT 30 JUNE 2020 SOURCE: BLOOMBERG & BELL POTTER. DATA AS AT 30 JUNE 2020
Figure 3 - Largest ASX IPOs since 2017
SOURCE: BLOOMBERG & BELL POTTER. DATA AS AT 30 JUNE 2020
Figure 4 - Cumulative IPO capital raised since 2017
SOURCE: BLOOMBERG & BELL POTTER. DATA AS AT 30 JUNE 2020
M G G L SF KKC MHH VG 8 VG 1 PG G M X T HM 1 W G B PCI NBI PL 8 M O T RF1 QRI PE1 $0.0bn $0.5bn $1.0bn $1.5bn $2.0bn $2.5bn $3.0bn $0.9bn $1.4bn $0.9bn $3.5bn $3.3bn $4.1bn $0.0bn $0bn $10bn $20bn $30bn $40bn $50bn $60bn $0bn $1bn $2bn $3bn $4bn $5bn $6bn 2014 2015 2016 2017 2018 2019 2020*
LIC/LIT IPO Capital Raised (LHS) LIC/LIT Market Cap (RHS)
$0bn $5bn $10bn $15bn $20bn $25bn 2017 2018 2019 2020
ASX Cumulative IPO Capital Raised LIC/LIT Cumulative IPO Capital Raised
5.0% 16.7% 12.9% 59.6% 40.5% 59.9% 0.0% 0% 10% 20% 30% 40% 50% 60% 70% 80% 90% 100% 2014 2015 2016 2017 2018 2019 2020*
Market Update
Secondary market capital raisings were nearly as limited as IPOs during the quarter, with $481k being raised between two LICs/
LITs. This was significantly lower than the three months prior, where $1.9m was injected into the sector. The discrepancy was
predominantly due to a Shortfall Offer in
Bailador Technology Investments Limited (BTI),
which netted a total of $1.7m.
The Board of
MMJ Group Holdings Limited (MMJ)
announced a reduction in the Share Purchase Plan offer price over late March,
shrinking the cost per share from $0.11 to $0.08. The unique decision was made in light of the extreme market volatility and
contractions that were experienced during this time. Under the modified terms, existing eligible shareholders were given the
opportunity to subscribe for between $1,000 and $30,000 worth of shares without incurring any brokerage or transaction costs. All
shareholder applications were accepted in full, with market conditions presumably weighing heavily on investor take-up. The
maximum amount proposed to be raised under the offer was $5m. Participation was therefore very lackluster at round 8%. MMJ
owns a portfolio of minority investments and seeks investments across the full range of emerging cannabis-related sectors including
healthcare, technology, infrastructure, logistics, processing, cultivation, equipment, and retail.
Alternative Investment Trust (AIQ)
raised $92k via a Purchase Plan in April. The fund’s investment strategy is to gain
exposure to a portfolio of leading international absolute return funds and selected direct investment in subordinated debt and equity
co-investments.
Figure 5 - 2Q20 Share Purchase Plans, Placements & Entitlements
SOURCE: COMPANY DATA, IRESS & BELL POTTER
ASX Code Company Name Method Shares Issued Issue Price Amount Raised
AIQ Alternative Investment Trust Share Purchase Plan 920,000 $0.10 $92,000 MMJ MMJ Group Holdings Limited Share Purchase Plan 4,867,500 $0.08 $389,400
Market Update
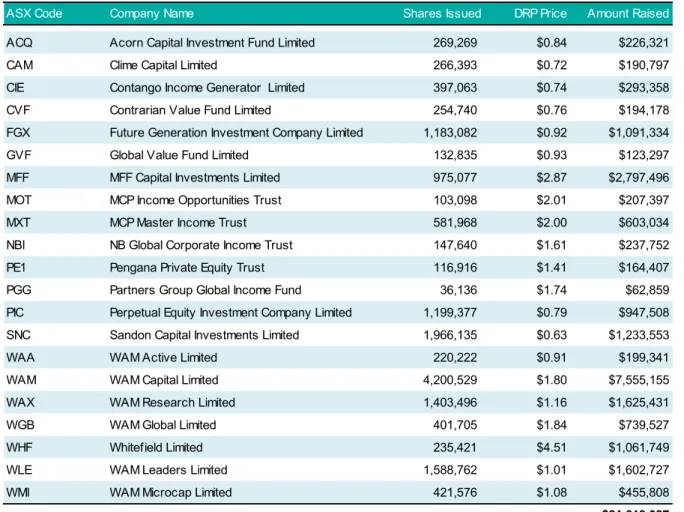
Dividend reinvestment plans (DRPs) totaled $21.6m in the June quarter, a decrease from the $80.7m raised in the previous quarter.
This was predominantly due to the two largest LICs,
Australian Foundation Investment Company Limited (AFI)
and
Argo
Investments Limited (ARG),
paying dividends in February and March respectively. The Wilson Asset Management LICs
combined for $12.2m, or approximately 56%, of the DRP take-up.
Figure 6 - 2Q20 Dividend Reinvestment Plans
SOURCE: COMPANY DATA, IRESS & BELL POTTER
ASX Code Company Name Shares Issued DRP Price Amount Raised
ACQ Acorn Capital Investment Fund Limited 269,269 $0.84 $226,321 CAM Clime Capital Limited 266,393 $0.72 $190,797 CIE Contango Income Generator Limited 397,063 $0.74 $293,358 CVF Contrarian Value Fund Limited 254,740 $0.76 $194,178 FGX Future Generation Investment Company Limited 1,183,082 $0.92 $1,091,334 GVF Global Value Fund Limited 132,835 $0.93 $123,297 MFF MFF Capital Investments Limited 975,077 $2.87 $2,797,496 MOT MCP Income Opportunities Trust 103,098 $2.01 $207,397 MXT MCP Master Income Trust 581,968 $2.00 $603,034 NBI NB Global Corporate Income Trust 147,640 $1.61 $237,752 PE1 Pengana Private Equity Trust 116,916 $1.41 $164,407 PGG Partners Group Global Income Fund 36,136 $1.74 $62,859 PIC Perpetual Equity Investment Company Limited 1,199,377 $0.79 $947,508 SNC Sandon Capital Investments Limited 1,966,135 $0.63 $1,233,553 WAA WAM Active Limited 220,222 $0.91 $199,341 WAM WAM Capital Limited 4,200,529 $1.80 $7,555,155 WAX WAM Research Limited 1,403,496 $1.16 $1,625,431 WGB WAM Global Limited 401,705 $1.84 $739,527 WHF Whitefield Limited 235,421 $4.51 $1,061,749 WLE WAM Leaders Limited 1,588,762 $1.01 $1,602,727 WMI WAM Microcap Limited 421,576 $1.08 $455,808
Market Update
Options are regularly being omitted from recent LIC listing as managements opt to cover the initial listing fee to ensure the company
beings trading at the NTA. $409k was raised via option exercises in the June quarter. This was predominantly due to
Monash
Absolute Investment Company (MA1/MA1OA)
options that were trading deep in the money for the majority of the 3
months. Although this activity significantly contributed to the total amount of option exercises, some 43.9m MA1OA options expired
effective 15 May 2020, representing a foregone potential raising of $46.1m.
Figure 7 - 2Q20 Options Exercised
Figure 8 - Outstanding options
At the end of June 2020 there is approximately $31.5m in outstanding options across 3 LICs.
Acorn Capital Investment (ACQ/ACQAI)
announced the launch of the ACQ Short Term Recurring Option (ASTRO) program
in December 2018. The offer of the pro-rate non-renounceable offer of bonus options occurs twice annually for shareholders.
ACQAI will be short dated, expiring 7 days before the likely next ex-dividend date. Due to this they will be unquoted but will be
transferable. The intention for funds raised from the exercise of the bonus options from the ASTRO program will be applied towards
increasing the Company’s investable capital. Eligible shareholders receive 1 bonus option for every 3 shares held at the bonus
option record date.
Glennon Small Companies Limited (GC1/GC1AI)
announced a 1-for-5 issue of bonus options at no cost in April. The exercise
price is $0.75 which is equivalent to the pre-tax NTA per share of GC1 as at 31 March 2020. The expiry date of GC1AI will be in
October 2021.
SOURCE: COMPANY DATA, IRESS & BELL POTTER
SOURCE: COMPANY DATA, IRESS & BELL POTTER
ASX Option Code Company Name Exercised Exercise Price Amount Raised Expiry Date
GC1AI Glennon Small Companies Limited 12,782 $0.75 $9,587 29-Oct-21 LSXOA Lion Selection Group Limited 6,392 $0.50 $3,196 12-Apr-20 MA1OA Monash Absolute Investment Company 375,122 $1.05 $393,878 15-May-20 NACOA Naos Ex-50 Opportunities Company 2,500 $1.03 $2,575 31-Mar-23
$409,236
ASX Option Code Company Name Share Price Exercise Price Outstanding Options Potential Raise Expiry Date
NCCOB Naos Emerging Opportunities Company $0.80 $1.02 13,220,593 $13,485,005 29-Jun-21 GC1AI Glennon Small Companies Limited $0.68 $0.75 8,752,707 $6,564,530 29-Oct-21 RYDOA Ryder Capital Limited $1.33 $1.50 26,732,673 $40,099,010 10-Dec-21 NACOA Naos Ex-50 Opportunities Company $0.79 $1.03 23,786,870 $24,500,476 31-Mar-23
Investment Performance Measures
In the next section we have evaluated our LIC/LITs using the performance of both the pre-tax NTA and share price. The pre-tax
NTA data seeks to measure the performance of the underlying investments of the Fund. Whereas, the share price data measures
the performance of the security as it trades on the ASX. However, some of this terminology is a little misleading as the pre-tax NTA
actually reflects tax associated with realised capital gains (tax applicable on positions that have been exited) but not unrealised
capital gains (tax applicable on positions that have not been exited).
The measurement of a LIC/LIT’s performance is calculated after all operating expenses, provision and payment of both income and
realised capital gains tax and the reinvestment of dividends, but does not incorporate franking. LIC/LIT returns will consequently be
understated relative to the Index return given that the Benchmarks do not factor in operating costs or taxation. The performance of
Unlisted Unit Trusts are not measured on an after tax basis and are therefore, generally, not a valid comparison.
In order to assess a LIC/LIT’s performance, NTA and share price need to be evaluated with respect to the relative mandate and/or
benchmark, giving varying outcomes from different styles of investment. To cater for this we have separate the LIC/LITs under
coverage into 3 categories:
Domestic Equity
Global Equity
Alternative Strategy
Within each category the LIC/LITs are again group together with other like-mandated companies to assist in general comparison. In
general, the NTA has been benchmarked against the relative indices preferred by the Manager and these should be most reflective
of its mandate.
Our value-add columns seek to quantify the value generated by the Manager, being the difference between the performance of the
share price and pre-tax NTA against the relevant benchmark. A positive value indicates outperformance against the Benchmark
and a negative value indicates an underperformance.
Dividends are also an important aspect of any investment decision. The next section includes historical Net Dividend Yield and
Gross Dividend Yield for the LIC/LITs in our universe. Nonetheless, investors must realise that although historical yield is clearly a
key consideration when selecting a LIC/LIT, it is no guarantee of future yield. Please note several LIC/LITs have recently entered
the market and have not paid a dividend yet.
Dividend Reserves & Franking Credit Balance
In comparison to a trust structure, Listed Investment Companies (LICs) have an advantage in being able retain earnings through
periods to build up a dividend reserve. This assists LICs in maintaining a smooth and sustainable dividend over a long term that is
often fully franked as opposed to trusts that are required to distribute all earnings to the underlying unit holders. Given they are a
company structure, LICs are also required to pay company tax on corporate profits which adds an additional source of franking
credits than can be passed onto shareholders in addition to receiving franked dividends from the underlying holdings. Therefore,
when comparing dividend yields between LICs it can assist to look at the profit reserves and franking credit balances to analyse the
future sustainability of the current dividend.
LICs generally source income from either dividend income from the underlying holdings or from capital appreciation and realisation
of the holdings. Income that is heavy relied on from capital appreciation will tend to be more volatile and, as a result, having a stable
level of profit reserves dedicated to the future distribution of dividends can assist LICs in maintaining a dividend through periods of
poor market performance. The same methodology is applied with maintaining a franking credit balance. Many LICs will differentiate
their dividend reserves from their profit reserves which are likely to include unrealised gains and losses from investments which
may not be actually realised at the current values. We have therefore chosen to report only the specified dividend reserve when
provided to give a more accurate measure of the reverses being held for the future distribution of dividends.
The dividend reserve cover represents how many years the company could continue its last 12 month dividend with the dividend
reserves held. Both the dividend reserve and franking credit balances have been sourced from the LICs 2019 Annual Reports and
have been adjusted for the 2019 final dividend when the adjustment was made in the reports. Not that some reported dividend
reserves may not accurately represent the company’s ability to pay dividends in the future as it may include unrealised profits.
Domestic Equity LIC/LIT Summary
The share price return (incl. net dividends) for domestic equity focused LIC/LITs for the June quarter was 10.9%, calculated on a
market-cap weighted average basis. The pre-tax NTA return (incl. net dividends) was 15.9%. In comparison, the All Ordinaries
Accumulation and S&P/ASX 200 Accumulation indices returned 16.5% and 16.8% respectively. Domestic LIC/LIT NTA returns on
average underperformed the corresponding benchmark by 1.3% over the quarter. Most notably,
Naos Ex-50 Opportunities (NAC)
outperformed its benchmark by 20.4%
The top performing LIC/LIT for the quarter was
Thorney Technologies (TEK)
with a share price return of 56.3% and a pre-tax NTA
return of 33.3%. The share price discount to pre-tax NTA almost halved, tightening over the quarter from -30.7% to -18.8%. TEK
has a broad and open investment mandate, focused on technology related businesses and other businesses with disruptive
business models. This structure enables the flexibility to invest in a wide range of investment opportunities covering listed and
private companies and a wide range of different types of securities, from shares to convertible notes and other instruments. Another
Thorney Management Services LIC,
Thorney Opportunities (TOP),
produced a quarterly total shareholder return of 23.7%. The
medium mandated LIC/LITs averaged a share price return of 25.1% for the quarter, compared to the large-cap mandated return of
12.8%.
The market-cap average share price premium/discount to pre-tax NTA was -2.4% at the end of June, widening from the 2.5%
premium experienced at the end of March. The change was predominantly driven by a tapering in the top-end, where pre-tax NTA
recovery lagged investor sentiment following the sell-off.
Australian Foundation Investment Co (AFI)
and
Argo Investments (ARG)
provided investment returns of 15.1% and 15.6%, only corresponding to a share price increase of 7.8% and 7.5% respectively
Figure 9 - 5yr Market Growth of Domestic Equity LIC/LITs
Figure 10 - 1yr Pre-Tax NTA Performance v Standard Dev.
Figure 11 - Domestic Equity LIC/LIT Dividend Yield (Net and Gross)
SOURCE: COMPANY DATA, IRESS & BELL POTTER SOURCE: COMPANY DATA, IRESS & BELL POTTER
SOURCE: COMPANY DATA, IRESS & BELL POTTER. LAST 12 MONTH DIVIDENDS AS AT 30 JUNE 2020
-20% -10% 0% 10% 20% $40 $70 $100 $130 $160
Jun 15 Jun 16 Jun 17 Jun 18 Jun 19 Jun 20
Premium / Discount (RHS) Growth of $100 (LHS)
AFI ARG AUI MLT BKI DUI CIN WLE WHF PIC AMH CAM CLF FSI WAM OPH MIR QVE WAX CDM WIC TOP RYD NCC TEK WAA NAC WMI SEC NSC ACQ OZG DJW PL8 SNC FGX All Ordinaries Accumulation Index -40% -30% -20% -10% 0% 10% 20% 0% 10% 20% 30% 40% 50% 1 Y r P re -T ax N T A P erf ormanc e
1 Yr Pre-Tax NTA Performance St. Deviation
0% 2% 4% 6% 8% 10% 12% 14% 16% 18%
AFI ARG AUI MLT BKI DUI CIN WLE WHF PIC AMH CAM CL
F FSI W AM O PH MIR Q VE
WAX CDM WIC TOP RYD TEK WAA NAC WM
I SEC NSC NCC ACQ OZ G DJ W PL 8 SNC FGX
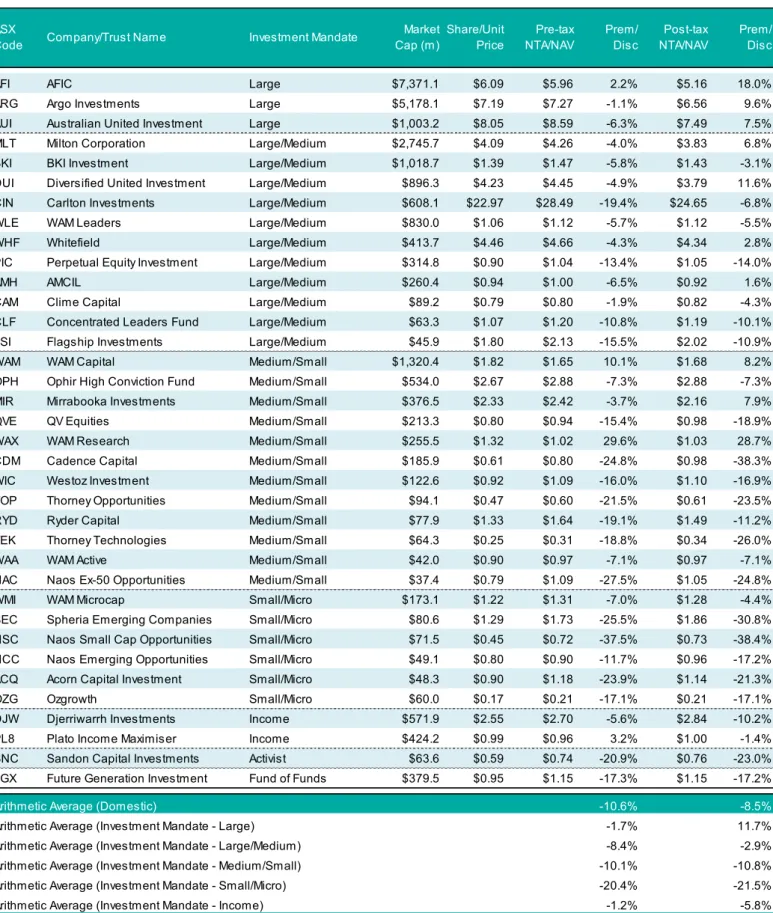
Domestic Equity - NTA Summary
Figure 12 - Domestic Equity LIC/LIT Share Price Premium/Discount to NTA
SOURCE: COMPANY DATA, IRESS & BELL POTTER
AFI AFIC Large $7,371.1 $6.09 $5.96 2.2% $5.16 18.0%
ARG Argo Investments Large $5,178.1 $7.19 $7.27 -1.1% $6.56 9.6%
AUI Australian United Investment Large $1,003.2 $8.05 $8.59 -6.3% $7.49 7.5%
MLT Milton Corporation Large/Medium $2,745.7 $4.09 $4.26 -4.0% $3.83 6.8%
BKI BKI Investment Large/Medium $1,018.7 $1.39 $1.47 -5.8% $1.43 -3.1%
DUI Diversified United Investment Large/Medium $896.3 $4.23 $4.45 -4.9% $3.79 11.6%
CIN Carlton Investments Large/Medium $608.1 $22.97 $28.49 -19.4% $24.65 -6.8%
WLE WAM Leaders Large/Medium $830.0 $1.06 $1.12 -5.7% $1.12 -5.5%
WHF Whitefield Large/Medium $413.7 $4.46 $4.66 -4.3% $4.34 2.8%
PIC Perpetual Equity Investment Large/Medium $314.8 $0.90 $1.04 -13.4% $1.05 -14.0%
AMH AMCIL Large/Medium $260.4 $0.94 $1.00 -6.5% $0.92 1.6%
CAM Clime Capital Large/Medium $89.2 $0.79 $0.80 -1.9% $0.82 -4.3%
CLF Concentrated Leaders Fund Large/Medium $63.3 $1.07 $1.20 -10.8% $1.19 -10.1%
FSI Flagship Investments Large/Medium $45.9 $1.80 $2.13 -15.5% $2.02 -10.9%
WAM WAM Capital Medium/Small $1,320.4 $1.82 $1.65 10.1% $1.68 8.2%
OPH Ophir High Conviction Fund Medium/Small $534.0 $2.67 $2.88 -7.3% $2.88 -7.3%
MIR Mirrabooka Investments Medium/Small $376.5 $2.33 $2.42 -3.7% $2.16 7.9%
QVE QV Equities Medium/Small $213.3 $0.80 $0.94 -15.4% $0.98 -18.9%
WAX WAM Research Medium/Small $255.5 $1.32 $1.02 29.6% $1.03 28.7%
CDM Cadence Capital Medium/Small $185.9 $0.61 $0.80 -24.8% $0.98 -38.3%
WIC Westoz Investment Medium/Small $122.6 $0.92 $1.09 -16.0% $1.10 -16.9%
TOP Thorney Opportunities Medium/Small $94.1 $0.47 $0.60 -21.5% $0.61 -23.5%
RYD Ryder Capital Medium/Small $77.9 $1.33 $1.64 -19.1% $1.49 -11.2%
TEK Thorney Technologies Medium/Small $64.3 $0.25 $0.31 -18.8% $0.34 -26.0%
WAA WAM Active Medium/Small $42.0 $0.90 $0.97 -7.1% $0.97 -7.1%
NAC Naos Ex-50 Opportunities Medium/Small $37.4 $0.79 $1.09 -27.5% $1.05 -24.8%
WMI WAM Microcap Small/Micro $173.1 $1.22 $1.31 -7.0% $1.28 -4.4%
SEC Spheria Emerging Companies Small/Micro $80.6 $1.29 $1.73 -25.5% $1.86 -30.8%
NSC Naos Small Cap Opportunities Small/Micro $71.5 $0.45 $0.72 -37.5% $0.73 -38.4%
NCC Naos Emerging Opportunities Small/Micro $49.1 $0.80 $0.90 -11.7% $0.96 -17.2%
ACQ Acorn Capital Investment Small/Micro $48.3 $0.90 $1.18 -23.9% $1.14 -21.3%
OZG Ozgrowth Small/Micro $60.0 $0.17 $0.21 -17.1% $0.21 -17.1%
DJW Djerriwarrh Investments Income $571.9 $2.55 $2.70 -5.6% $2.84 -10.2%
PL8 Plato Income Maximiser Income $424.2 $0.99 $0.96 3.2% $1.00 -1.4%
SNC Sandon Capital Investments Activist $63.6 $0.59 $0.74 -20.9% $0.76 -23.0%
FGX Future Generation Investment Fund of Funds $379.5 $0.95 $1.15 -17.3% $1.15 -17.2%
Arithmetic Average (Domestic) -10.6% -8.5%
Arithmetic Average (Investment Mandate - Large) -1.7% 11.7%
Arithmetic Average (Investment Mandate - Large/Medium) -8.4% -2.9%
Arithmetic Average (Investment Mandate - Medium/Small) -10.1% -10.8%
Arithmetic Average (Investment Mandate - Small/Micro) -20.4% -21.5%
Arithmetic Average (Investment Mandate - Income) -1.2% -5.8%
Weighted Average (Domestic) -2.4% 6.8%
Post-tax NTA/NAV Prem/ Disc Pre-tax NTA/NAV Prem/ Disc ASX
Code Company/Trust Name Investment Mandate
Market Cap (m)
Share/Unit Price
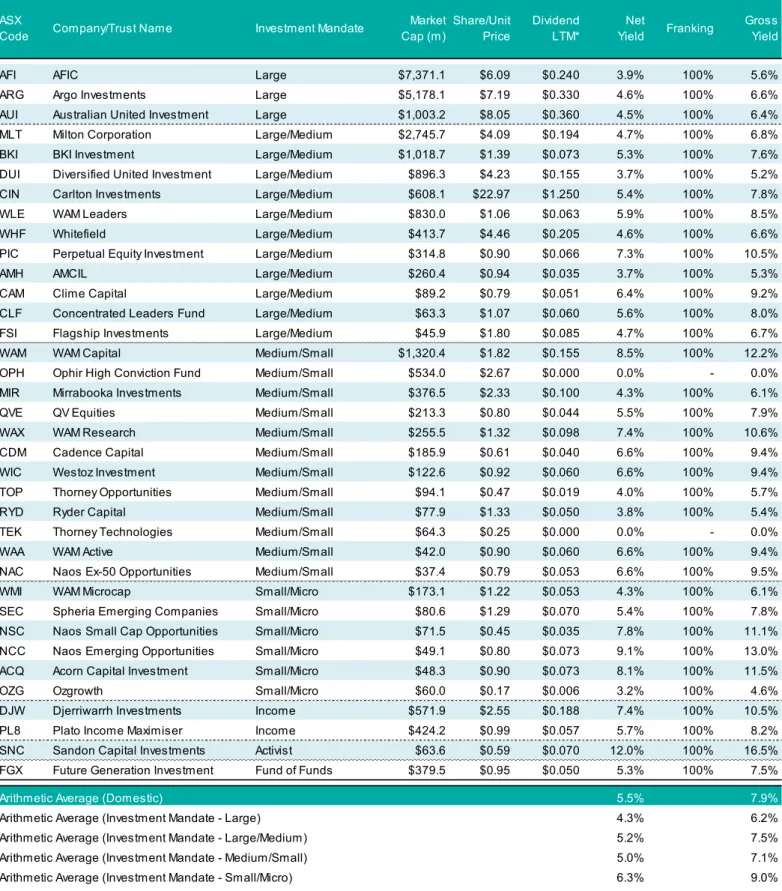
Domestic Equity - Dividend Summary
Figure 13 - Domestic Equity LIC/LIT Historical Dividend Yield
SOURCE: COMPANY DATA, IRESS & BELL POTTER. *LAST 12 MONTH DIVIDENDS/DISTRIBUTIONS PAID, EXCLUDING SPECIAL DIVIDENDS/DISTRIBUTIONS. ASSUMING COMPANY TAX RATE OF 30%.
AFI AFIC Large $7,371.1 $6.09 $0.240 3.9% 100% 5.6%
ARG Argo Investments Large $5,178.1 $7.19 $0.330 4.6% 100% 6.6%
AUI Australian United Investment Large $1,003.2 $8.05 $0.360 4.5% 100% 6.4%
MLT Milton Corporation Large/Medium $2,745.7 $4.09 $0.194 4.7% 100% 6.8%
BKI BKI Investment Large/Medium $1,018.7 $1.39 $0.073 5.3% 100% 7.6%
DUI Diversified United Investment Large/Medium $896.3 $4.23 $0.155 3.7% 100% 5.2%
CIN Carlton Investments Large/Medium $608.1 $22.97 $1.250 5.4% 100% 7.8%
WLE WAM Leaders Large/Medium $830.0 $1.06 $0.063 5.9% 100% 8.5%
WHF Whitefield Large/Medium $413.7 $4.46 $0.205 4.6% 100% 6.6%
PIC Perpetual Equity Investment Large/Medium $314.8 $0.90 $0.066 7.3% 100% 10.5%
AMH AMCIL Large/Medium $260.4 $0.94 $0.035 3.7% 100% 5.3%
CAM Clime Capital Large/Medium $89.2 $0.79 $0.051 6.4% 100% 9.2%
CLF Concentrated Leaders Fund Large/Medium $63.3 $1.07 $0.060 5.6% 100% 8.0%
FSI Flagship Investments Large/Medium $45.9 $1.80 $0.085 4.7% 100% 6.7%
WAM WAM Capital Medium/Small $1,320.4 $1.82 $0.155 8.5% 100% 12.2%
OPH Ophir High Conviction Fund Medium/Small $534.0 $2.67 $0.000 0.0% - 0.0%
MIR Mirrabooka Investments Medium/Small $376.5 $2.33 $0.100 4.3% 100% 6.1%
QVE QV Equities Medium/Small $213.3 $0.80 $0.044 5.5% 100% 7.9%
WAX WAM Research Medium/Small $255.5 $1.32 $0.098 7.4% 100% 10.6%
CDM Cadence Capital Medium/Small $185.9 $0.61 $0.040 6.6% 100% 9.4%
WIC Westoz Investment Medium/Small $122.6 $0.92 $0.060 6.6% 100% 9.4%
TOP Thorney Opportunities Medium/Small $94.1 $0.47 $0.019 4.0% 100% 5.7%
RYD Ryder Capital Medium/Small $77.9 $1.33 $0.050 3.8% 100% 5.4%
TEK Thorney Technologies Medium/Small $64.3 $0.25 $0.000 0.0% - 0.0%
WAA WAM Active Medium/Small $42.0 $0.90 $0.060 6.6% 100% 9.4%
NAC Naos Ex-50 Opportunities Medium/Small $37.4 $0.79 $0.053 6.6% 100% 9.5%
WMI WAM Microcap Small/Micro $173.1 $1.22 $0.053 4.3% 100% 6.1%
SEC Spheria Emerging Companies Small/Micro $80.6 $1.29 $0.070 5.4% 100% 7.8%
NSC Naos Small Cap Opportunities Small/Micro $71.5 $0.45 $0.035 7.8% 100% 11.1%
NCC Naos Emerging Opportunities Small/Micro $49.1 $0.80 $0.073 9.1% 100% 13.0%
ACQ Acorn Capital Investment Small/Micro $48.3 $0.90 $0.073 8.1% 100% 11.5%
OZG Ozgrowth Small/Micro $60.0 $0.17 $0.006 3.2% 100% 4.6%
DJW Djerriwarrh Investments Income $571.9 $2.55 $0.188 7.4% 100% 10.5%
PL8 Plato Income Maximiser Income $424.2 $0.99 $0.057 5.7% 100% 8.2%
SNC Sandon Capital Investments Activist $63.6 $0.59 $0.070 12.0% 100% 16.5%
FGX Future Generation Investment Fund of Funds $379.5 $0.95 $0.050 5.3% 100% 7.5%
Arithmetic Average (Domestic) 5.5% 7.9%
Arithmetic Average (Investment Mandate - Large) 4.3% 6.2%
Arithmetic Average (Investment Mandate - Large/Medium) 5.2% 7.5%
Arithmetic Average (Investment Mandate - Medium/Small) 5.0% 7.1%
Arithmetic Average (Investment Mandate - Small/Micro) 6.3% 9.0%
Arithmetic Average (Investment Mandate - Income) 6.6% 9.4%
Weighted Average (Domestic) 4.8% 6.8%
Dividend LTM* Net Yield Franking Gross Yield ASX
Code Company/Trust Name Investment Mandate
Market Cap (m)
Share/Unit Price
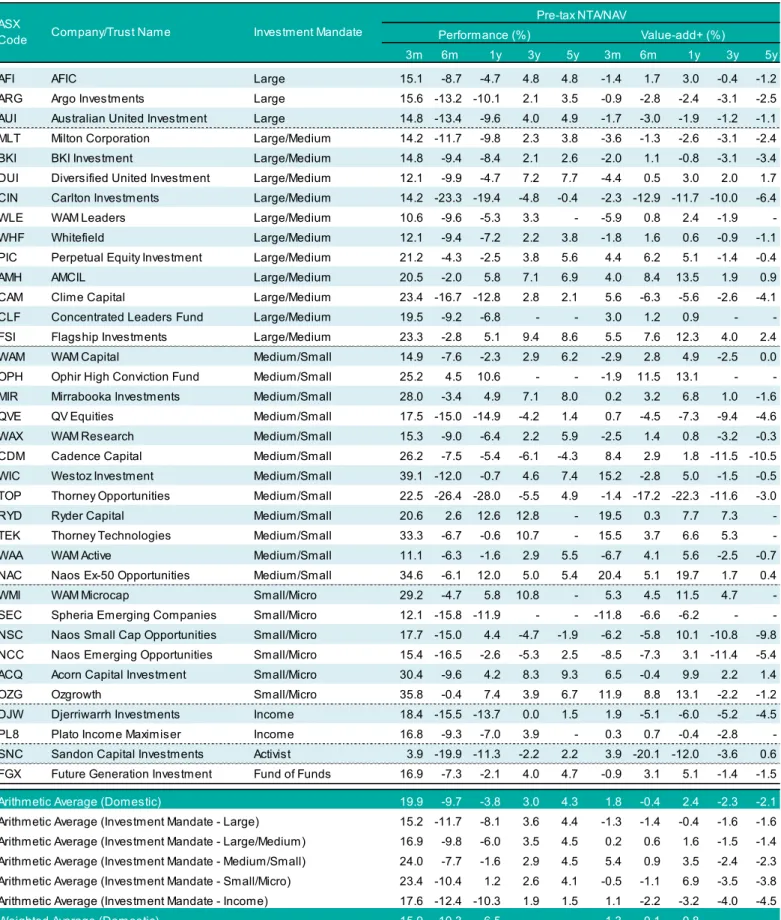
Domestic Equity - Pre-Tax NTA Performance Summary
Figure 14 - Domestic Equity LIC/LIT Pre-Tax NTA Performance
SOURCE: COMPANY DATA, IRESS & BELL POTTER
3m 6m 1y 3y 5y 3m 6m 1y 3y 5y
AFI AFIC Large 15.1 -8.7 -4.7 4.8 4.8 -1.4 1.7 3.0 -0.4 -1.2
ARG Argo Investments Large 15.6 -13.2 -10.1 2.1 3.5 -0.9 -2.8 -2.4 -3.1 -2.5
AUI Australian United Investment Large 14.8 -13.4 -9.6 4.0 4.9 -1.7 -3.0 -1.9 -1.2 -1.1
MLT Milton Corporation Large/Medium 14.2 -11.7 -9.8 2.3 3.8 -3.6 -1.3 -2.6 -3.1 -2.4
BKI BKI Investment Large/Medium 14.8 -9.4 -8.4 2.1 2.6 -2.0 1.1 -0.8 -3.1 -3.4
DUI Diversified United Investment Large/Medium 12.1 -9.9 -4.7 7.2 7.7 -4.4 0.5 3.0 2.0 1.7
CIN Carlton Investments Large/Medium 14.2 -23.3 -19.4 -4.8 -0.4 -2.3 -12.9 -11.7 -10.0 -6.4
WLE WAM Leaders Large/Medium 10.6 -9.6 -5.3 3.3 - -5.9 0.8 2.4 -1.9
-WHF Whitefield Large/Medium 12.1 -9.4 -7.2 2.2 3.8 -1.8 1.6 0.6 -0.9 -1.1
PIC Perpetual Equity Investment Large/Medium 21.2 -4.3 -2.5 3.8 5.6 4.4 6.2 5.1 -1.4 -0.4
AMH AMCIL Large/Medium 20.5 -2.0 5.8 7.1 6.9 4.0 8.4 13.5 1.9 0.9
CAM Clime Capital Large/Medium 23.4 -16.7 -12.8 2.8 2.1 5.6 -6.3 -5.6 -2.6 -4.1
CLF Concentrated Leaders Fund Large/Medium 19.5 -9.2 -6.8 - - 3.0 1.2 0.9 -
-FSI Flagship Investments Large/Medium 23.3 -2.8 5.1 9.4 8.6 5.5 7.6 12.3 4.0 2.4
WAM WAM Capital Medium/Small 14.9 -7.6 -2.3 2.9 6.2 -2.9 2.8 4.9 -2.5 0.0
OPH Ophir High Conviction Fund Medium/Small 25.2 4.5 10.6 - - -1.9 11.5 13.1 -
-MIR Mirrabooka Investments Medium/Small 28.0 -3.4 4.9 7.1 8.0 0.2 3.2 6.8 1.0 -1.6
QVE QV Equities Medium/Small 17.5 -15.0 -14.9 -4.2 1.4 0.7 -4.5 -7.3 -9.4 -4.6
WAX WAM Research Medium/Small 15.3 -9.0 -6.4 2.2 5.9 -2.5 1.4 0.8 -3.2 -0.3
CDM Cadence Capital Medium/Small 26.2 -7.5 -5.4 -6.1 -4.3 8.4 2.9 1.8 -11.5 -10.5
WIC Westoz Investment Medium/Small 39.1 -12.0 -0.7 4.6 7.4 15.2 -2.8 5.0 -1.5 -0.5
TOP Thorney Opportunities Medium/Small 22.5 -26.4 -28.0 -5.5 4.9 -1.4 -17.2 -22.3 -11.6 -3.0
RYD Ryder Capital Medium/Small 20.6 2.6 12.6 12.8 - 19.5 0.3 7.7 7.3
-TEK Thorney Technologies Medium/Small 33.3 -6.7 -0.6 10.7 - 15.5 3.7 6.6 5.3
-WAA WAM Active Medium/Small 11.1 -6.3 -1.6 2.9 5.5 -6.7 4.1 5.6 -2.5 -0.7
NAC Naos Ex-50 Opportunities Medium/Small 34.6 -6.1 12.0 5.0 5.4 20.4 5.1 19.7 1.7 0.4
WMI WAM Microcap Small/Micro 29.2 -4.7 5.8 10.8 - 5.3 4.5 11.5 4.7
-SEC Spheria Emerging Companies Small/Micro 12.1 -15.8 -11.9 - - -11.8 -6.6 -6.2 -
-NSC Naos Small Cap Opportunities Small/Micro 17.7 -15.0 4.4 -4.7 -1.9 -6.2 -5.8 10.1 -10.8 -9.8
NCC Naos Emerging Opportunities Small/Micro 15.4 -16.5 -2.6 -5.3 2.5 -8.5 -7.3 3.1 -11.4 -5.4
ACQ Acorn Capital Investment Small/Micro 30.4 -9.6 4.2 8.3 9.3 6.5 -0.4 9.9 2.2 1.4
OZG Ozgrowth Small/Micro 35.8 -0.4 7.4 3.9 6.7 11.9 8.8 13.1 -2.2 -1.2
DJW Djerriwarrh Investments Income 18.4 -15.5 -13.7 0.0 1.5 1.9 -5.1 -6.0 -5.2 -4.5
PL8 Plato Income Maximiser Income 16.8 -9.3 -7.0 3.9 - 0.3 0.7 -0.4 -2.8
-SNC Sandon Capital Investments Activist 3.9 -19.9 -11.3 -2.2 2.2 3.9 -20.1 -12.0 -3.6 0.6
FGX Future Generation Investment Fund of Funds 16.9 -7.3 -2.1 4.0 4.7 -0.9 3.1 5.1 -1.4 -1.5
Arithmetic Average (Domestic) 19.9 -9.7 -3.8 3.0 4.3 1.8 -0.4 2.4 -2.3 -2.1
Arithmetic Average (Investment Mandate - Large) 15.2 -11.7 -8.1 3.6 4.4 -1.3 -1.4 -0.4 -1.6 -1.6
Arithmetic Average (Investment Mandate - Large/Medium) 16.9 -9.8 -6.0 3.5 4.5 0.2 0.6 1.6 -1.5 -1.4
Arithmetic Average (Investment Mandate - Medium/Small) 24.0 -7.7 -1.6 2.9 4.5 5.4 0.9 3.5 -2.4 -2.3
Arithmetic Average (Investment Mandate - Small/Micro) 23.4 -10.4 1.2 2.6 4.1 -0.5 -1.1 6.9 -3.5 -3.8
Arithmetic Average (Investment Mandate - Income) 17.6 -12.4 -10.3 1.9 1.5 1.1 -2.2 -3.2 -4.0 -4.5
Weighted Average (Domestic) 15.9 -10.3 -6.5 -1.3 -0.1 0.8
Company/Trust Name Investment Mandate Performance (%) Value-add+ (%) Pre-tax NTA/NAV
ASX Code
Domestic Equity - Share Price Performance Summary
Figure 15 - Domestic Equity LIC/LIT Share Price Performance
SOURCE: COMPANY DATA, IRESS & BELL POTTER
3m 6m 1y 3y 5y 3m 6m 1y 3y 5y
AFI AFIC Large 7.8 -13.0 1.2 6.1 4.3 -8.7 -2.6 8.9 0.9 -1.7
ARG Argo Investments Large 7.5 -15.8 -7.8 1.9 2.0 -9.0 -5.4 -0.1 -3.3 -4.0
AUI Australian United Investment Large 8.6 -17.6 -7.9 4.0 4.3 -7.9 -7.2 -0.2 -1.2 -1.7
MLT Milton Corporation Large/Medium 13.9 -15.5 -9.4 1.1 2.5 -3.9 -5.1 -2.2 -4.3 -3.7
BKI BKI Investment Large/Medium 13.5 -15.8 -7.1 -0.1 1.2 -3.3 -5.3 0.5 -5.3 -4.8
DUI Diversified United Investment Large/Medium 10.2 -13.8 0.2 8.2 7.8 -6.3 -3.4 7.9 3.0 1.8
CIN Carlton Investments Large/Medium 9.2 -27.0 -24.0 -6.4 -2.6 -7.3 -16.6 -16.3 -11.6 -8.6
WLE WAM Leaders Large/Medium 8.8 -11.2 0.9 2.9 - -7.7 -0.8 8.6 -2.3
-WHF Whitefield Large/Medium 8.5 -11.9 -4.4 3.6 4.0 -5.4 -0.9 3.4 0.5 -0.9
PIC Perpetual Equity Investment Large/Medium 17.4 -11.8 -6.7 1.7 3.9 0.6 -1.3 0.9 -3.5 -2.1
AMH AMCIL Large/Medium 15.4 -3.1 11.2 6.4 5.9 -2.4 7.3 18.4 1.0 -0.3
CAM Clime Capital Large/Medium 14.1 -17.0 -14.3 3.1 3.4 -3.7 -6.6 -7.1 -2.3 -2.8
CLF Concentrated Leaders Fund Large/Medium 15.9 -15.6 -11.3 - - -0.6 -5.2 -3.6 -
-FSI Flagship Investments Large/Medium 28.6 -3.3 7.6 10.1 10.6 10.8 7.1 14.8 4.7 4.4
WAM WAM Capital Medium/Small 8.2 -15.9 -3.0 -2.1 5.9 -9.6 -5.5 4.2 -7.5 -0.3
OPH Ophir High Conviction Fund Medium/Small 34.2 7.2 7.7 - - 7.1 14.2 10.2 -
-MIR Mirrabooka Investments Medium/Small 22.6 -12.6 -0.3 0.8 3.6 -5.2 -6.0 1.6 -5.3 -6.0
QVE QV Equities Medium/Small 16.1 -21.4 -19.2 -12.3 -2.0 -0.7 -10.9 -11.6 -17.5 -8.0
WAX WAM Research Medium/Small 13.5 -6.9 7.2 2.3 9.4 -4.3 3.5 14.4 -3.1 3.2
CDM Cadence Capital Medium/Small 28.0 -15.8 -14.1 -16.0 -9.3 10.2 -5.4 -6.9 -21.4 -15.5
WIC Westoz Investment Medium/Small 34.6 -15.7 -5.6 4.2 6.5 10.7 -6.5 0.1 -1.9 -1.4
TOP Thorney Opportunities Medium/Small 23.7 -28.5 -27.3 -10.0 2.6 -0.2 -19.3 -21.6 -16.1 -5.3
RYD Ryder Capital Medium/Small 16.2 -5.4 10.2 10.0 - 15.1 -7.7 5.3 4.5
-TEK Thorney Technologies Medium/Small 56.3 -10.7 2.0 4.4 - 38.5 -0.3 9.2 -1.0
-WAA WAM Active Medium/Small 19.8 -14.8 -4.1 -1.2 4.2 2.0 -4.4 3.1 -6.6 -2.0
NAC Naos Ex-50 Opportunities Medium/Small 28.6 -15.5 1.6 -2.9 2.5 14.4 -4.3 9.3 -6.2 -2.5
WMI WAM Microcap Small/Micro 19.9 -13.6 6.4 6.9 - -4.0 -4.4 12.1 0.8
-SEC Spheria Emerging Companies Small/Micro 8.4 -26.1 -23.2 - - -15.5 -16.9 -17.5 -
-NSC Naos Small Cap Opportunities Small/Micro 10.8 -38.0 -15.5 -14.6 -9.9 -13.1 -28.8 -9.8 -20.7 -17.8
NCC Naos Emerging Opportunities Small/Micro 4.6 -19.4 -2.7 -10.1 1.6 -19.3 -10.2 3.0 -16.2 -6.3
ACQ Acorn Capital Investment Small/Micro 17.3 -23.1 -5.4 5.3 9.6 -6.6 -13.9 0.3 -0.8 1.7
OZG Ozgrowth Small/Micro 47.8 1.9 17.4 5.3 5.3 23.9 11.1 23.1 -0.8 -2.6
DJW Djerriwarrh Investments Income 7.6 -28.6 -22.0 -6.4 -6.1 -8.9 -18.2 -14.3 -11.6 -12.1
PL8 Plato Income Maximiser Income 17.9 -14.6 -5.8 3.1 - 1.4 -4.6 0.8 -3.6
-SNC Sandon Capital Investments Activist 12.3 -25.2 -22.0 -7.4 -0.1 -5.5 -14.8 -14.8 -12.8 -6.3
FGX Future Generation Investment Fund of Funds 12.3 -16.1 -14.7 -0.6 0.5 -5.5 -5.7 -7.5 -6.0 -5.7
Arithmetic Average (Domestic) 17.8 -15.3 -5.7 0.0 2.6 -0.8 -5.7 0.7 -5.4 -4.0
Arithmetic Average (Investment Mandate - Large) 8.0 -15.5 -4.8 4.0 3.5 -8.5 -5.1 2.9 -1.2 -2.5
Arithmetic Average (Investment Mandate - Large/Medium) 14.1 -13.3 -5.2 3.1 4.1 -2.7 -2.8 2.3 -2.0 -1.9
Arithmetic Average (Investment Mandate - Medium/Small) 25.1 -13.0 -3.8 -2.1 2.6 6.5 -4.4 1.4 -7.5 -4.2
Arithmetic Average (Investment Mandate - Small/Micro) 18.1 -19.7 -3.8 -1.4 1.7 -5.8 -10.5 1.9 -7.5 -6.3
Arithmetic Average (Investment Mandate - Income) 12.7 -21.6 -13.9 -1.6 -6.1 -3.8 -11.4 -6.8 -7.6 -12.1
Weighted Average (Domestic) 10.9 -14.6 -4.6 -6.4 -4.4 2.7
ASX Code
Share/Unit Price
Performance (%) Value-add+ (%) Company/Trust Name Investment Mandate
Domestic Equity - Profit Reserve and Indirect Cost Ratio Summary
Figure 16 - Domestic Equity LIC/LIT Profit Reserve and Indirect Cost Ratio Summary
SOURCE: COMPANY DATA, IRESS & BELL POTTER. DATA AS AT 30 JUNE 2019.
INDIRECT COST RATIO (ICR) MEASURES THE MANAGEMENT COSTS AS WELL AS OTHER COST THAT ARE DEDUCTED FROM THE ASSETS OF THE LIC/LIT. PERFORMANCE FEES, IF PAYABLE, ARE INCLUDED IN THE CALCULATION WHICH MAY CAUSE FLUCTUATIONS OVER EACH YEAR. DUE TO THIS, A HIGHER ICR ISN’T NECESSARILY A NEGATIVE AS IT MAY BE THE RESULT OF A PERIOD OF OUTPERFORMANCE. COSTS INVOLVED IN BORROWING AND SHORTING ACTIVITIES HAVE BEEN EXCLUDED, WHILST BROKERAGE HAS BEEN INCLUDED. THE COSTS ARE THEN DIVIDED BY AVERAGE PRE-TAX NTA/NAV TIMES THE WEIGHTED AVERAGE SHARES/UNITS OUTSTANDING FOR FY19.
AFI AFIC Large $7,371.1 $1,150.5 $208.3 4.0x $0.2327 0.19%
ARG Argo Investments Large $5,178.1 $778.3 $149.3 3.3x $0.2794 0.15%
AUI Australian United Investment Large $1,003.2 $161.0 $46.3 3.6x $0.4971 0.11%
MLT Milton Corporation Large/Medium $2,745.7 $273.2 $128.7 2.1x $0.2579 0.14%
BKI BKI Investment Large/Medium $1,018.7 $47.0 $29.4 0.9x $0.0538 0.18%
DUI Diversified United Investment Large/Medium $896.3 $67.0 $16.7 2.1x $0.1055 0.13%
CIN Carlton Investments Large/Medium $608.1 $365.9 $69.0 11.1x $3.4761 0.09%
WLE WAM Leaders Large/Medium $830.0 $101.8 $8.9 2.1x $0.0152 1.44%
WHF Whitefield Large/Medium $413.7 $127.1 $18.5 7.0x $0.2779 0.45%
PIC Perpetual Equity Investment Large/Medium $314.8 $19.9 $6.5 0.9x $0.0269 1.64%
AMH AMCIL Large/Medium $260.4 $24.6 $4.5 2.6x $0.0224 0.73%
CAM Clime Capital Large/Medium $89.2 $14.3 $0.1 3.1x $0.0009 2.33%
CLF Concentrated Leaders Fund Large/Medium $63.3 $14.5 $9.8 4.1x $0.2201 2.48%
FSI Flagship Investments Large/Medium $45.9 $8.8 $3.1 4.0x $0.1617 2.64%
WAM WAM Capital Medium/Small $1,320.4 $54.6 $15.1 0.5x $0.0288 1.50%
OPH Ophir High Conviction Fund Medium/Small $534.0 n/a n/a n/a n/a n/a
MIR Mirrabooka Investments Medium/Small $376.5 $60.1 $19.5 3.8x $0.1634 0.63%
QVE QV Equities Medium/Small $213.3 $20.0 $4.6 1.6x $0.0224 1.04%
WAX WAM Research Medium/Small $255.5 $53.7 $1.1 2.9x $0.0075 1.48%
CDM Cadence Capital Medium/Small $185.9 $16.9 $4.6 1.3x $0.0191 1.81%
WIC Westoz Investment Medium/Small $122.6 $39.6 $6.0 4.9x $0.0598 1.31%
TOP Thorney Opportunities Medium/Small $94.1 $88.5 $1.6 23.2x $0.0107 3.78%
RYD Ryder Capital Medium/Small $77.9 $11.4 $0.5 4.3x $0.0114 1.79%
NCC Naos Emerging Opportunities Medium/Small $49.1 $9.7 $0.2 2.2x $0.0044 2.07%
TEK Thorney Technologies Medium/Small $64.3 $48.0 $0.0 n/a $0.0000 7.34%
WAA WAM Active Medium/Small $42.0 $2.2 $0.4 0.8x $0.0130 2.54%
NAC Naos Ex-50 Opportunities Medium/Small $37.4 $2.2 $0.3 0.8x $0.0084 2.94%
WMI WAM Microcap Small/Micro $173.1 $26.6 $3.7 3.6x $0.0351 2.41%
SEC Spheria Emerging Companies Small/Micro $80.6 $10.2 $4.5 2.2x $0.0904 2.18%
NSC Naos Small Cap Opportunities Small/Micro $71.5 $7.6 $3.6 1.3x $0.0284 2.45%
ACQ Acorn Capital Investment Small/Micro $48.3 $19.2 $1.2 4.6x $0.0285 1.77%
OZG Ozgrowth Small/Micro $60.0 $21.3 $0.7 10.9x $0.0026 1.52%
DJW Djerriwarrh Investments Income $571.9 $68.8 $34.0 1.7x $0.2044 0.56%
PL8 Plato Income Maximiser Income $424.2 $15.4 $5.7 1.0x $0.0257 1.01%
SNC Sandon Capital Investments Activist $63.6 $1.3 $0.9 n/a $0.0256 3.82%
FGX Future Generation Investment Fund of Funds $379.5 $37.7 $7.7 n/a $0.0260 0.55%
LTM Dividend Cover Max Div (Fully Franked) Indirect Cost Ratio Franking Reserve (m) ASX
Code Company/Trust Name Investment Mandate
Market Cap (m)
Profit Reserve (m)
Global Equity LIC/LIT Summary
The share price return (incl. net dividends) for global equity LIC/LITs for the June quarter was 9.7%, calculated on a market-cap
weighted average basis. The pre-tax NTA return (incl. net dividends) was 5.1%. In comparison, the MSCI World Net TR (A$) and
MSCI All Country Asia ex-Japan Net TR (A$) indices returned 5.2% and 2.6% respectively. Global LIC/LIT NTA returns on average
underperformed the corresponding benchmark by just 0.3% over the quarter.
Hearts and Minds Investments (HM1)
was a highlight
in this regard, outperforming its benchmark by 18.4%.
Globally diverse income also continues to be a focal point for many investors. The full effect of COVID on end of FY earnings
throughout the sector is yet to be seen. Notably there have been significant headwinds placed on Australian banks, in conjunction
with a reduction in one-off special income items that may effect LIC/LIT investment income. This in turn has a trickle-on effect to
investors. Over the last 12 months,
Platinum Asia Investments (PAI)
has provided a sticky fully franked stream of semi-annual
dividends. At the 30 June closing share price of $1.01, this translates to 4% net and 5.7% gross yield respectively. The income yield
from this investment is also foreseeably sustainable. PAI boasted 3 years dividend coverage based on 2019 financials.
Global Value Fund (GVF)
topically remains a company of interest. It employs a global investment strategy using a
discount capture mechanism, owning a range of global assets purchased at a discount to their intrinsic value. The manager is has
considerable experience in selecting assets that fit this mandate; and in identifying or creating catalysts that will be used to unlock
such value. The market-cap average share price premium/discount to pre-tax NTA for global mandates was -9.4% at the end of
June. This provides a unique opportunity for GVF to capitalise on the current market, where there are large price dislocations
without any fundamental changes. The 30 June share price/NTA discount of 8.3% facilitates an attractive entry point for investors.
Figure 17 - 5yr Market Growth of Global Equity LIC/LITs
Figure 18 - 1yr Pre-Tax NTA Performance v Standard Dev.
Figure 19 - Global Equity LIC/LIT Dividend Yield (Net and Gross)
SOURCE: COMPANY DATA, IRESS & BELL POTTER
SOURCE: COMPANY DATA, IRESS & BELL POTTER. LAST 12 MONTH DIVIDENDS AS AT 30 JUNE 2020
SOURCE: COMPANY DATA, IRESS & BELL POTTER
0% 2% 4% 6% 8% 10% 12%
MGG MFF MHH WGB PMC PGF PIA TGG EGD EGF WQG EGI ALI GVF TGF FGG HM1 PAI EAI PAF
Gross Yield Net Yield
-20% -10% 0% 10% 20% $40 $70 $100 $130 $160
Jun 15 Jun 16 Jun 17 Jun 18 Jun 19 Jun 20
Premium / Discount (RHS) Growth of $100 (LHS)
MGG MFF WGB PMC PGF PIA TGG EGD EGF WQG EGI ALI GVF TGF FGG HM1 PAI EAI PAF
MSCI World TR Index ($A)
-45% -30% -15% 0% 15% 30% 45% 0% 10% 20% 30% 40% 1 Y r P re -T ax N T A P erf ormanc e
Global Equity - NTA Summary
Figure 20 - Global Equity LIC/LIT Share Price Premium/Discount to NTA
SOURCE: COMPANY DATA, IRESS & BELL POTTER.
MGG Magellan Global Trust Global $2,164.6 $1.75 $1.83 -4.9% $1.83 -4.9%
MFF MFF Capital Investments Global $1,489.5 $2.71 $2.81 -3.5% $2.48 9.4%
MHH Magellan High Conviction Trust Global $855.7 $1.40 $1.53 -8.6% $1.53 -8.6%
WGB WAM Global Global $395.9 $1.87 $2.30 -19.0% $2.25 -17.2%
PMC Platinum Capital Global $363.1 $1.25 $1.41 -11.2% $1.42 -12.2%
PGF PM Capital Global Opportunities Global $318.8 $0.90 $1.15 -21.6% $1.16 -22.3%
PIA Pengana International Equities Global $271.9 $1.06 $1.26 -16.0% $1.25 -14.9%
TGG Templeton Global Growth Fund Global $229.7 $1.15 $1.32 -13.4% $1.32 -13.4%
EGD Evans & Partners Global Disruption Global $317.0 $2.61 $2.70 -3.3% $2.70 -3.3%
EGF Evans & Partners Global Flagship Global $175.0 $1.46 $1.54 -5.2% $1.54 -5.2%
WQG WCM Global Growth Global $216.6 $1.25 $1.45 -14.0% $1.34 -7.0%
EGI Ellerston Global Investments Global $108.5 $1.03 $1.18 -13.0% $1.16 -10.9%
ALI Argo Global Listed Infrastructure Global (Infrastructure) $293.8 $2.07 $2.26 -8.4% $2.26 -8.4%
GVF Global Value Fund Global (Multi Asset) $136.0 $0.92 $1.00 -8.3% $1.00 -8.1%
TGF Tribeca Global Natural Resources Global (Resources) $64.8 $1.04 $1.45 -28.3% $1.73 -40.0%
FGG Future Generation Global Investment Global (Fund of Funds) $449.4 $1.15 $1.46 -21.8% $1.39 -17.5%
HM1 Hearts and Minds Investments Global (High Conviction) $699.8 $3.11 $3.45 -9.9% $3.33 -6.6%
PAI Platinum Asia Investments Asia $367.4 $1.01 $1.17 -13.8% $1.15 -12.3%
EAI Ellerston Asian Investments Asia $127.7 $0.96 $1.15 -16.7% $1.14 -15.6%
PAF PM Capital Asian Opportunities Asia $39.2 $0.72 $0.88 -18.2% $0.88 -17.9%
Arithmetic Average (Global) -12.9% -11.8%
Arithmetic Average (Investment Mandate - Equities) -11.1% -9.2%
Arithmetic Average (Investment Mandate - Asia) -16.2% -15.3%
Weighted Average (Global) -9.4% -6.6%
Prem/ Disc Post-tax NTA/NAV Prem/ Disc Pre-tax NTA/NAV ASX
Code Company/Trust Name Investment Mandate
Market Cap (m)
Share/Unit Price
Global Equity - Dividend Summary
Figure 21 - Global Equity LIC/LIT Historical Dividend Yield
SOURCE: COMPANY DATA, IRESS & BELL POTTER. *LAST 12 MONTH DIVIDENDS/DISTRIBUTIONS PAID, EXCLUDING SPECIAL DIVIDENDS/DISTRIBUTIONS. ASSUMING COMPANY TAX RATE OF 30%.
MGG Magellan Global Trust Global $2,164.6 $1.75 $0.063 3.6% 0% 3.6%
MFF MFF Capital Investments Global $1,489.5 $2.71 $0.045 1.7% 100% 2.4%
MHH Magellan High Conviction Trust Global $855.7 $1.40 $0.045 3.2% 0% 3.2%
WGB WAM Global Global $395.9 $1.87 $0.050 2.7% 100% 3.8%
PMC Platinum Capital Global $363.1 $1.25 $0.070 5.6% 100% 8.0%
PGF PM Capital Global Opportunities Global $318.8 $0.90 $0.040 4.4% 100% 6.3%
PIA Pengana International Equities Global $271.9 $1.06 $0.060 5.7% 81% 7.4%
TGG Templeton Global Growth Fund Global $229.7 $1.15 $0.070 6.1% 100% 8.7%
EGD Evans & Partners Global Disruption Global $317.0 $2.61 $0.150 5.7% 0% 5.7%
EGF Evans & Partners Global Flagship Global $175.0 $1.46 $0.158 10.8% 0% 10.8%
WQG WCM Global Growth Global $216.6 $1.25 $0.040 3.2% 0% 3.2%
EGI Ellerston Global Investments Global $108.5 $1.03 $0.030 2.9% 100% 4.2%
ALI Argo Global Listed Infrastructure Global (Infrastructure) $293.8 $2.07 $0.070 3.4% 100% 4.8%
GVF Global Value Fund Global (Multi Asset) $136.0 $0.92 $0.058 6.3% 100% 9.0%
TGF Tribeca Global Natural Resources Global (Resources) $64.8 $1.04 $0.000 0.0% - 0.0%
FGG Future Generation Global Investment Global (Fund of Funds) $449.4 $1.15 $0.015 1.3% 100% 1.9%
HM1 Hearts and Minds Investments Global (High Conviction) $699.8 $3.11 $0.000 0.0% - 0.0%
PAI Platinum Asia Investments Asia $367.4 $1.01 $0.040 4.0% 100% 5.7%
EAI Ellerston Asian Investments Asia $127.7 $0.96 $0.030 3.1% 100% 4.5%
PAF PM Capital Asian Opportunities Asia $39.2 $0.72 $0.030 4.2% 100% 6.0%
Arithmetic Average (Global) 3.9% 5.0%
Arithmetic Average (Investment Mandate - Equities) 4.6% 5.6%
Arithmetic Average (Investment Mandate - Asia) 3.8% 5.4%
Weighted Average (Global) 3.3% 3.9%
ASX
Code Company/Trust Name Investment Mandate
Market Cap (m) Share/Unit Price Dividend LTM* Net Yield Franking Gross Yield
Global Equity - Pre-Tax NTA & Share Price Performance Summary
Figure 22 - Global Equity LIC/LIT Pre-Tax NTA Performance
SOURCE: COMPANY DATA, IRESS & BELL POTTER.
3m 6m 1y 3y 5y 3m 6m 1y 3y 5y
MGG Magellan Global Trust Global 3.5 -4.6 3.5 - - -2.2 -0.7 -1.1 -
-MFF MFF Capital Investments Global -4.6 -12.3 -1.3 11.8 10.6 -10.3 -8.4 -5.9 1.2 1.3
MHH Magellan High Conviction Trust Global 6.2 -4.3 - - - 0.5 -0.4 - -
-WGB WAM Global Global 4.8 -4.7 0.2 - - -0.9 -0.8 -4.4 -
-PMC Platinum Capital Global -0.3 -11.4 -6.1 0.9 2.0 -5.9 -7.0 -10.0 -9.1 -6.9
PGF PM Capital Global Opportunities Global 10.5 -19.4 -9.9 0.9 2.0 4.4 -15.2 -14.5 -9.7 -7.3
PIA Pengana International Equities Global 5.5 -0.4 7.1 7.8 3.3 -0.6 3.4 2.3 -2.8 -6.0
TGG Templeton Global Growth Fund Global 2.9 -11.0 -4.3 1.0 1.6 -2.7 -6.6 -8.2 -9.0 -7.3
EGD Evans & Partners Global Disruption Global 18.8 22.3 31.9 - - 13.2 26.7 28.0 -
-EGF Evans & Partners Global Flagship Global 3.4 -5.4 4.0 - - -2.3 -1.5 -0.6 -
-WQG WCM Global Growth Global 13.3 10.6 16.0 12.7 - 7.7 14.6 11.3 2.0
-EGI Ellerston Global Investments Global 22.0 -6.9 7.5 4.1 4.0 3.5 -1.6 4.2 -2.8 -3.2
ALI Argo Global Listed Infrastructure Global (Infrastructure) -3.8 -11.0 -7.1 5.5 - -1.8 0.5 -0.8 -1.2
-GVF Global Value Fund Global (Multi Asset) 9.3 -5.5 -0.2 2.7 2.3 8.3 -7.7 -4.9 -2.8 -3.4
TGF Tribeca Global Natural Resources Global (Resources) -13.9 -40.9 -39.3 - - -20.3 -15.9 -13.8 -
-FGG Future Generation Global Investment Global (Fund of Funds) 5.2 -1.0 5.0 9.2 - -0.4 3.4 1.1 -0.8
-HM1 Hearts and Minds Investments Global (High Conviction) 24.1 12.4 18.9 - - 18.4 16.3 14.3 -
-PAI Platinum Asia Investments Asia 5.7 4.3 12.1 7.5 - 2.3 7.2 8.6 0.1
-EAI Ellerston Asian Investments Asia 2.8 -3.1 5.5 4.6 - 0.2 0.8 4.3 -0.4
-PAF PM Capital Asian Opportunities Asia 8.4 -14.5 -13.1 -6.0 -2.2 5.0 -11.6 -16.6 -13.4 -9.0
Arithmetic Average (Global) 6.2 -5.3 1.6 4.8 3.0 0.8 -0.2 -0.4 -3.7 -5.2
Arithmetic Average (Investment Mandate - Equities) 7.1 -4.0 4.4 5.6 3.9 0.4 0.2 0.1 -4.3 -4.9
Arithmetic Average (Investment Mandate - Asia) 5.6 -4.4 1.5 2.0 -2.2 2.5 -1.2 -1.2 -4.6 -9.0
Weighted Average (Global) 5.1 -4.1 -0.3 0.2
Pre-tax NTA/NAV
Performance (%) Value-add+ (%) ASX
Global Equity - Pre-Tax NTA & Share Price Performance Summary
Figure 23 - Global Equity LIC/LIT Share Price Performance
SOURCE: COMPANY DATA, IRESS & BELL POTTER.
3m 6m 1y 3y 5y 3m 6m 1y 3y 5y
MGG Magellan Global Trust Global 9.7 -11.2 0.9 - - 4.0 -7.3 -3.7 -
-MFF MFF Capital Investments Global 3.5 -14.6 6.7 17.6 12.8 -2.2 -10.7 2.1 7.0 3.5
MHH Magellan High Conviction Trust Global 5.3 -13.0 - - - -0.4 -9.1 - -
-WGB WAM Global Global 14.8 -18.7 -2.9 - - 9.1 -14.8 -7.5 -
-PMC Platinum Capital Global -0.4 -25.4 -16.1 -4.1 -1.5 -6.0 -21.0 -20.0 -14.1 -10.4
PGF PM Capital Global Opportunities Global 2.3 -26.9 -14.4 -3.4 0.5 -3.8 -22.7 -19.0 -14.0 -8.8
PIA Pengana International Equities Global 18.1 -3.8 6.7 4.7 3.5 12.0 0.0 1.9 -5.9 -5.8
TGG Templeton Global Growth Fund Global 7.5 -12.6 0.4 -0.3 2.1 1.9 -8.2 -3.5 -10.3 -6.8
EGD Evans & Partners Global Disruption Global 20.5 18.5 29.0 - - 14.9 22.9 25.1 -
-EGF Evans & Partners Global Flagship Global 1.0 -9.9 0.9 - - -4.7 -6.0 -3.7 -
-WQG WCM Global Growth Global 23.3 8.1 15.4 5.5 - 17.7 12.1 10.7 -5.2
-EGI Ellerston Global Investments Global 15.7 -11.6 14.4 4.1 0.6 -2.8 -6.3 11.1 -2.8 -6.6
ALI Argo Global Listed Infrastructure Global (Infrastructure) 11.3 -11.5 -5.6 6.5 - 13.3 0.0 0.7 -0.2
-GVF Global Value Fund Global (Multi Asset) -2.1 -15.3 0.6 -1.9 3.4 -4.7 -12.8 -0.9 -6.7 -0.9
TGF Tribeca Global Natural Resources Global (Resources) 18.9 -50.2 -49.3 - - 12.5 -25.2 -23.8 -
-FGG Future Generation Global Investment Global (Fund of Funds) 6.5 -10.2 -12.2 2.9 - 0.9 -5.8 -16.1 -7.1
-HM1 Hearts and Minds Investments Global (High Conviction) 29.6 -4.9 8.6 - - 23.9 -1.0 4.0 -
-PAI Platinum Asia Investments Asia 6.3 -5.0 2.3 5.0 - 2.9 -2.1 -1.2 -2.4
-EAI Ellerston Asian Investments Asia 4.3 -7.1 7.2 2.6 - 1.7 -3.2 6.0 -2.4
-PAF PM Capital Asian Opportunities Asia 3.6 -20.5 -20.7 -9.4 -2.2 0.2 -17.6 -24.2 -16.8 -9.0
Arithmetic Average (Global) 10.0 -12.3 -1.5 2.3 2.4 4.5 -6.9 -3.3 -6.2 -5.6
Arithmetic Average (Investment Mandate - Equities) 10.1 -10.1 3.7 3.4 3.0 3.3 -5.9 -0.6 -6.5 -5.8
Arithmetic Average (Investment Mandate - Asia) 4.8 -10.8 -3.8 -0.6 -2.2 1.6 -7.6 -6.5 -7.2 -9.0
Weighted Average (Global) 9.7 -11.2 4.3 -6.9
ASX
Code Company/Trust Name Investment Mandate
Share/Unit Price
Global Equity - Profit Reserve and Indirect Cost Ratio Summary
Figure 24 - Global Equity LIC/LIT Profit Reserve and Indirect Cost Ratio Summary
SOURCE: COMPANY DATA, IRESS & BELL POTTER. DATA AS AT 30 JUNE 2019.
INDIRECT COST RATIO (ICR) MEASURES THE MANAGEMENT COSTS AS WELL AS OTHER COST THAT ARE DEDUCTED FROM THE ASSETS OF THE LIC/LIT. PERFORMANCE FEES, IF PAYABLE, ARE INCLUDED IN THE CALCULATION WHICH MAY CAUSE FLUCTUATIONS OVER EACH YEAR. DUE TO THIS, A HIGHER ICR ISN’T NECESSARILY A NEGATIVE AS IT MAY BE THE RESULT OF A PERIOD OF OUTPERFORMANCE. COSTS INVOLVED IN BORROWING AND SHORTING ACTIVITIES HAVE BEEN EXCLUDED, WHILST BROKERAGE HAS BEEN INCLUDED. THE COSTS ARE THEN DIVIDED BY AVERAGE PRE-TAX NTA/NAV TIMES THE WEIGHTED AVERAGE SHARES/UNITS OUTSTANDING FOR FY19.
MGG Magellan Global Trust Global $2,164.6 n/a n/a n/a n/a 1.72%
MFF MFF Capital Investments Global $1,489.5 $838.1 $58.6 34.4x $0.1444 0.44%
MHH Magellan High Conviction Trust Global $855.7 n/a n/a n/a n/a n/a
WGB WAM Global Global $395.9 $17.5 $3.8 2.2x $0.0315 2.17%
PMC Platinum Capital Global $363.1 $55.8 $10.8 2.8x $0.0501 1.44%
PGF PM Capital Global Opportunities Global $318.8 $93.5 $16.3 6.7x $0.0619 1.27%
PIA Pengana International Equities Global $271.9 $105.5 $2.3 7.0x $0.0120 1.77%
TGG Templeton Global Growth Fund Global $229.7 $14.2 $8.8 0.9x $0.0537 1.25%
EGD Evans & Partners Global Disruption Global $317.0 n/a n/a n/a n/a 1.51%
EGF Evans & Partners Global Flagship Global $175.0 n/a n/a n/a n/a 1.79%
WQG WCM Global Growth Global $216.6 $25.2 $0.0 6.6x $0.0000 3.22%
EGI Ellerston Global Investments Global $108.5 $6.8 $2.6 2.1x $0.0315 1.67%
ALI Argo Global Listed Infrastructure Global (Infrastructure) $293.8 $59.6 $9.3 6.0x $0.0878 1.58%
GVF Global Value Fund Global (Multi Asset) $136.0 $9.0 $4.4 1.0x $0.0401 2.56%
TGF Tribeca Global Natural Resources Global (Resources) $64.8 -$2.6 $0.0 n/a $0.0000 2.99%
FGG Future Generation Global Investment Global (Fund of Funds) $449.4 $20.2 $2.3 1.3x $0.0079 0.54%
HM1 Hearts and Minds Investments Global (High Conviction) $699.8 $4.2 $0.6 0.9x $0.0052 n/a
PAI Platinum Asia Investments Asia $367.4 $43.8 $8.1 3.0x $0.0298 1.69%
EAI Ellerston Asian Investments Asia $127.7 $11.2 $4.2 3.1x $0.0466 2.13%
PAF PM Capital Asian Opportunities Asia $39.2 $5.9 $5.1 3.5x $0.1207 1.67%
Franking Reserve (m) ASX
Code Company/Trust Name Investment Mandate
Market Cap (m) Profit Reserve (m) LTM Dividend Cover Max Div (Fully Franked) Indirect Cost Ratio
Alternative Strategy LIC/LIT Summary
The alternative strategy LICs are compromised of long/short mandated companies as well as LICs when its performance may not
be best compared to a broad domestic or global equity index.
Calculated on a market-cap weighted average basis, these LIC/LITs collectively returned 12.1% (incl. net dividends) over the
quarter, compared to a pre-tax NTA (incl. net dividends) return of 7.2%.
Regal Investment Fund (RF1)
was the standout top
performer, experiencing a sharp correction in lieu of last quarter’s low performance figures. The fund provided a total shareholder
return (incl. net dividends) of 68.9% and a pre-tax NTA return (incl. net dividends) of 41.1% for the period. RF1 aims to provide
attractive risk adjusted absolute returns over a period of more than five years with limited correlation to equity markets. It achieves
this through a multitude of alternative investment strategies. The manager may adjust the portfolio’s strategy allocations depending
on prevailing market conditions or other factors considered relevant at the time to achieve this investment objective. The Small
Companies strategy was the largest contributor to the portfolio’s performance over the months of April and May, generating gross
returns of 26.7% and 20.1% respectively. Furthermore, the Emerging Companies strategy, which represented 30% of NAV at the
end of June, generated a monthly gross return of 37.6%. This partially underpinned by battery technology developer Novonix which
appreciated 200% relative to its $0.29 acquisition cost in a heavily oversubscribed entitlement offer. Quadpay, which as been
marked based on the terms of its proposed acquisition by Zip, also delivered in excess of 300% ROI.
Credit income LITs also recovered lost ground over the quarter with unit prices increasing across the board by 7% or more.
NB
Global Corporate Income Trust (NBI)
delivered in excess of its investment objective at the quarter end, providing investors
with an annualised distribution yield of 7.5%. The LIT has since revised its target net distribution yield down from 5.25% to 4.5%.
Figure 25 - 5yr Market Growth of Alt. Strategy LIC/LITs
Figure 26 - 1yr Pre-Tax NTA Performance v Standard Dev
Figure 27 - Alternative Strategy LIC/LIT Dividend Yield (Net and Gross)
SOURCE: COMPANY DATA, IRESS & BELL POTTER SOURCE: COMPANY DATA, IRESS & BELL POTTER
SOURCE: COMPANY DATA, IRESS & BELL POTTER. LAST 12 MONTH DIVIDENDS AS AT 30 JUNE 2020
-30% -15% 0% 15% 30% $70 $85 $100 $115 $130
Jun 15 Jun 16 Jun 17 Jun 18 Jun 19 Jun 20
Premium / Discount (RHS) Growth of $100 (LHS)
LSF VG1 APL RF1 ALF AEG
BAF PE1 BTI
GCI MXT MOT NBI PCI All Ordinaries Accumulation Index MSCI World TR Index ($A) -10% 0% 10% 20% 30% 40% 0% 10% 20% 30% 40% 1 Y r P re -T ax N T A P erf ormanc e
1 Yr Pre-Tax NTA Performance St. Deviation
0% 2% 4% 6% 8% 10% 12%
LSF VG1 APL RF1 ALF AEG BAF PE1 BTI GCI MXT MOT NBI PCI
Figure 28 - Specialist Strategy LIC/LIT Share Price Premium/Discount to NTA
Figure 29 - Specialist Strategy LIC/LIT Historic Dividend Yield
SOURCE: COMPANY DATA, IRESS & BELL POTTER.
SOURCE: COMPANY DATA, IRESS & BELL POTTER. *LAST 12 MONTH DIVIDENDS/DISTRIBUTIONS PAID, EXCLUDING SPECIAL DIVIDENDS/DISTRIBUTIONS. ASSUMING COMPANY TAX RATE OF 30%.
LSF L1 Long Short Fund Long/Short (Global) $794 $1.22 $1.63 -25.2% $1.76 -30.5%
VG1 VGI Partners Global Investments Long/Short (Global) $743 $1.83 $2.21 -17.4% $2.27 -19.6%
APL Antipodes Global Investment Long/Short (Global) $462 $0.92 $1.08 -14.5% $1.09 -15.5%
RF1 Regal Investment Fund Long/Short (Global) $287 $2.55 $2.92 -12.7% $2.92 -12.7%
ALF Australian Leaders Fund Long/Short $170 $0.87 $1.12 -22.3% $1.12 -22.3%
AEG Absolute Equity Performance Long/Short $104 $1.12 $1.27 -11.5% $1.19 -6.2%
BAF Blue Sky Alternatives Access Fund Private Assets $141 $0.72 $1.09 -33.7% $1.09 -33.7%
PE1 Pengana Private Equity Trust Private Equity (Global) $219 $1.34 $1.19 12.2% $1.19 12.2%
BTI Bailador Technology Investments Private Equity (Tech) $87 $0.71 $1.24 -43.1% $1.15 -38.7%
GCI Gryphon Capital Income Trust Fixed Income $360 $1.75 $1.99 -12.5% $1.99 -12.5%
MXT MCP Master Income Trust Fixed Income $1,153 $1.81 $2.00 -9.8% $2.00 -9.8%
MOT MCP Income Opportunities Trust Fixed Income $284 $1.64 $2.01 -18.3% $2.01 -18.3%
NBI NB Global Corporate Income Trust Fixed Income $735 $1.65 $1.86 -11.3% $1.86 -11.3%
PCI Perpetual Credit Income Trust Fixed Income $384 $0.96 $1.06 -9.6% $1.06 -9.6%
Arithmetic Average (Alternative Strategy) -16.4% -16.3%
Arithmetic Average (Mandate - Long Short (Global)) -17.5% -19.6%
Arithmetic Average (Mandate - Long Short) -16.9% -14.3%
Arithmetic Average (Mandate - Fixed Income) -12.3% -12.3%
Arithmetic Average (Mandate - Other) -21.5% -20.1%
Weighted Average (Alternative Strategy) -14.7% -15.6%
Prem/ Disc Post-tax NTA/NAV Prem/ Disc Pre-tax NTA/NAV ASX
Code Company/Trust Name Investment Mandate
Market Cap (m)
Share/Unit Price
LSF L1 Long Short Fund Long/Short (Global) $794 $1.22 $0.000 0.0% - 0.0%
VG1 VGI Partners Global Investments Long/Short (Global) $743 $1.83 $0.010 0.5% 100% 0.8%
APL Antipodes Global Investment Long/Short (Global) $462 $0.92 $0.045 4.9% 50% 5.9%
RF1 Regal Investment Fund Long/Short (Global) $287 $2.55 $0.045 1.7% 0% 1.7%
ALF Australian Leaders Fund Long/Short $170 $0.87 $0.050 5.7% 25% 6.4%
AEG Absolute Equity Performance Long/Short $104 $1.12 $0.050 4.5% 100% 6.4%
BAF Blue Sky Alternatives Access Fund Private Assets $141 $0.72 $0.050 6.9% 72% 9.1%
PE1 Pengana Private Equity Trust Private Equity (Global) $219 $1.34 $0.048 3.6% 0% 3.6%
BTI Bailador Technology Investments Private Equity (Tech) $87 $0.71 $0.000 0.0% - 0.0%
GCI Gryphon Capital Income Trust Fixed Income $360 $1.75 $0.086 5.0% 0% 5.0%
MXT MCP Master Income Trust Fixed Income $1,153 $1.81 $0.101 5.6% 0% 5.6%
MOT MCP Income Opportunities Trust Fixed Income $284 $1.64 $0.148 9.0% 8% 9.4%
NBI NB Global Corporate Income Trust Fixed Income $735 $1.65 $0.124 7.5% 0% 7.5%
PCI Perpetual Credit Income Trust Fixed Income $384 $0.96 $0.043 4.4% 0% 4.4%
Arithmetic Average (Alternative Strategy) 4.2% 4.7%
Arithmetic Average (Mandate - Long Short (Global)) 1.8% 2.1%
Arithmetic Average (Mandate - Long Short) 5.1% 6.4%
Arithmetic Average (Mandate - Fixed Income) 6.3% 6.4%
Arithmetic Average (Mandate - Other) 3.5% 4.2%
Weighted Average (Alternative Strategy) 4.1% 4.3%
ASX
Code Company/Trust Name Investment Mandate
Market Cap (m) Share/Unit Price Dividend LTM* Net Yield Franking Gross Yield
Figure 30 - Alternative Strategy LIC/LIT Pre-Tax NTA Performance
Figure 31 - Alternative Strategy LIC/LIT Share Price Performance
SOURCE: COMPANY DATA, IRESS & BELL POTTER.
SOURCE: COMPANY DATA, IRESS & BELL POTTER.
3m 6m 1y 3y 5y 3m 6m 1y 3y 5y
LSF L1 Long Short Fund Long/Short (Global) 33.7 -11.4 -2.7 - - 17.2 -1.0 5.0 -
-VG1 VGI Partners Global Investments Long/Short (Global) -10.9 -7.5 -7.5 - - -16.6 -3.6 -12.1 -
-APL Antipodes Global Investment Long/Short (Global) 0.2 -5.2 -2.1 -0.2 - -5.4 -0.8 -6.0 -10.2
-RF1 Regal Investment Fund Long/Short (Global) 41.1 5.0 16.3 - - 41.0 4.8 15.7 -
-ALF Australian Leaders Fund Long/Short -0.9 -2.2 1.7 -1.4 1.1 -18.7 8.2 8.9 -6.8 -5.1
AEG Absolute Equity Performance Long/Short 5.9 9.3 31.4 9.4 - 5.8 9.1 30.8 8.2
-BAF Blue Sky Alternatives Access Fund Private Assets -1.6 -3.5 0.0 3.3 6.1 -3.5 -7.4 -8.0 -4.7 -1.9
PE1 Pengana Private Equity Trust Private Equity (Global) -9.8 -3.1 -1.4 - - -11.7 -7.0 -9.4 -
-BTI Bailador Technology Investments Private Equity (Tech) 0.8 -3.4 -3.4 5.7 3.2 -1.1 -7.3 -11.4 -2.3 -4.8
GCI Gryphon Capital Income Trust Fixed Income 1.1 1.3 4.3 - - 0.2 -0.6 0.2 -
-MXT MCP Master Income Trust Fixed Income 1.2 2.9 5.5 - - 0.3 1.1 1.6 -
-MOT MCP Income Opportunities Trust Fixed Income 2.0 3.9 7.9 - - 0.5 0.7 1.3 -
-NBI NB Global Corporate Income Trust Fixed Income 14.4 -7.6 -4.4 - - 13.1 -10.2 -9.7 -
-PCI Perpetual Credit Income Trust Fixed Income 1.7 -1.9 0.1 - - 0.8 -3.7 -3.8 -
-Arithmetic Average (Alternative Strategy) 5.6 -1.7 3.3 3.4 3.5 1.6 -1.3 0.2 -3.2 -3.9
Arithmetic Average (Mandate - Long Short (Global)) 16.0 -4.8 1.0 -0.2 9.1 -0.2 0.7 -10.2
Arithmetic Average (Mandate - Long Short) 2.5 3.6 16.5 4.0 1.1 -6.5 8.7 19.9 0.7 -5.1
Arithmetic Average (Mandate - Fixed Income) 4.1 -0.3 2.7 3.0 -2.5 -2.1
Arithmetic Average (Mandate - Other) -3.6 -3.3 -1.6 4.5 4.6 -5.4 -7.2 -9.6 -3.5 -3.4
Weighted Average (Alternative Strategy) 7.2 -3.0 2.6 -1.9
Pre-tax NTA/NAV
Performance (%) Value-add+ (%) ASX
Code Company/Trust Name Investment Mandate
3m 6m 1y 3y 5y 3m 6m 1y 3y 5y
LSF L1 Long Short Fund Long/Short (Global) 41.0 -25.8 -13.2 - - 24.5 -15.4 -5.5 -
-VG1 VGI Partners Global Investments Long/Short (Global) -18.5 -18.5 -22.7 - - -24.2 -14.6 -27.3 -
-APL Antipodes Global Investment Long/Short (Global) 3.4 -10.4 3.8 -6.1 - -2.2 -6.0 -0.1 -16.1
-RF1 Regal Investment Fund Long/Short (Global) 68.9 -2.7 3.3 - - 68.8 -2.9 2.7 -
-ALF Australian Leaders Fund Long/Short 0.0 -9.6 0.8 -7.5 -2.4 -17.8 0.8 8.0 -12.9 -8.6
AEG Absolute Equity Performance Long/Short 9.8 6.2 36.6 4.9 - -8.0 16.6 43.8 -0.5
-BAF Blue Sky Alternatives Access Fund Private Assets 9.9 -16.9 1.1 -9.9 -1.4 8.0 -20.8 -6.9 -17.9 -9.4
PE1 Pengana Private Equity Trust Private Equity (Global) 4.7 -6.5 14.2 - - 2.8 -10.4 6.2 -
-BTI Bailador Technology Investments Private Equity (Tech) 8.5 -34.6 -30.3 -6.7 -4.3 6.6 -38.5 -38.3 -14.7 -12.3
GCI Gryphon Capital Income Trust Fixed Income 7.0 -12.5 -11.1 - - 6.1 -14.4 -15.2 -
-MXT MCP Master Income Trust Fixed Income 8.3 -9.6 -6.5 - - 7.4 -11.4 -10.4 -
-MOT MCP Income Opportunities Trust Fixed Income 13.8 -17.4 -13.0 - - 12.3 -20.6 -19.6 -
-NBI NB Global Corporate Income Trust Fixed Income 11.8 -18.3 -14.3 - - 10.5 -20.9 -19.6 -
-PCI Perpetual Credit Income Trust Fixed Income 7.7 -14.1 -10.8 - - 6.8 -15.9 -14.7 -
-Arithmetic Average (Alternative Strategy) 12.6 -13.6 -4.4 -5.1 -2.7 7.3 -12.5 -6.9 -12.4 -10.1
Arithmetic Average (Mandate - Long Short (Global)) 23.7 -14.4 -7.2 -6.1 16.7 -9.7 -7.6 0.0
Arithmetic Average (Mandate - Long Short) 4.9 -1.7 18.7 -1.3 -2.4 -12.9 8.7 25.9 -6.7 -8.6
Arithmetic Average (Mandate - Fixed Income) 9.7 -14.4 -11.1 8.6 -16.6 -15.9
Arithmetic Average (Mandate - Other) 7.7 -19.3 -5.0 -8.3 -2.8 5.8 -23.2 -13.0 -16.3 -10.9
Weighted Average (Alternative Strategy) 12.1 -14.7 7.3 -13.3 ASX
Code Company/Trust Name Investment Mandate
Share/Unit Price