Foreign aid and economic growth: The impact of aid on
determinants of growth - The case of Vietnam
Economics Master's thesis Tra Trinh 2014 Department of Economics Aalto University School of Business Powered by TCPDF (www.tcpdf.org)
Author Trinh Tra
Title of thesis Foreign aid and economic growth: The impact of aid on determinants of growth –
The case of Vietnam
DegreeMaster of Science in Economics and Business Administration
Degree programme Economics
Thesis advisor(s) Pertti Haaparanta
Year of approval 2014 Number of pages 85 Language English
Abstract
The present thesis investigates the relationship between foreign aid and economic growth in Vietnam from 1993 to 2012. The main objective is to contribute to a better understanding of the reality of aid-growth relationship in Vietnam, how and through which channels aid may influence outcomes, and what make aid works better or less well.
In the research, growth accounting analysis is conducted to regconize contributions of foreign assistance to production factors. An empirical model is estimated using the Autoregressive Distributed Lagged (ARDL) approach to cointegration for the purpose of evaluating of the direct impact of aid on final economic outcome. Additionally, the study conducts an analysis reviewing both positive and negative effects of foreign aid across different sectors.
The empirical results indicate that foreign aid has a significantly positive role in promoting economic growth in Vietnam. The results of growth accounting exercise and the analysis of fundamental channels through which aid has contributed to development outcomes also obtain more evidence supporting the beneficial impacts of aid, especially on macroeconomic management, infrastructure, and human capital accumulation. However, at the same time, such aid-related problems as high volatility and unpredictability of the inflow, absorptive capacity constraints, and rent seeking behavior could burden the recipient‘s administration and in turn, undermine the aid effectiveness.
Based on these findings, a set of policy implications has been suggested. Firstly, Vietnamese government and its donor community should put more effort into improving the coordination among involved parties. Secondly, the analysis implies the importance of systematic evaluations of completed aid programs and projects. Thirdly, the quality of institution and managerial capacity should be strengthened in addition to aid effort. Fourthly, Vietnam needs to be acutely conscious of the problems involving due to high volatility and unpredictability of aid and then implement necessary measures to alleviate pressure on fiscal management. Finally, there is a need to adopt a more self-sustainable approach in enhancing economic growth in the long-run.
Keywords Vietnam, foreign aid, economic growth, ARDL, growth accounting, growth
1 CONTENTS Lists of Tables ... 3 Lists of Figures ... 4 1 INTRODUCTION ... 4 1.1 Research objectives ... 6 1.2 Research questions ... 6
1.3 Structure of the Thesis ... 7
2 LITERATURE REVIEW AND BACKGROUND ... 8
2.1 Economic theory and literature review ... 8
2.2 Overview of foreign aid in Vietnam ... 12
3 METHODOLOGY AND DATA SOURCES ... 18
3.1 Growth accounting analysis ... 18
3.1.1. Measuring fixed capital stock ... 19
3.1.2. Measuring human capital ... 20
3.1.3. Aggregate factor shares ... 22
3.2 Econometric model ... 22
3.3 Data sources ... 27
4 RESULTS AND ANALYSIS ... 28
4.1 Growth accounting analysis results (1991-2012) ... 28
4.2 Empirical results ... 31
5 POSITIVE IMPACTS OF AID ... 39
5.1 Aid and macroeconomic management ... 39
5.2 Aid and economic infrastructure ... 45
5.3 Aid and social infrastructure ... 50
6 NEGATIVE IMPACTS OF AID ... 56
6.1 Macroeconomic consequences ... 56
6.2 Absorptive capacity ... 61
6.3 Aid and governance ... 64
7 CONCLUSION AND DISCUSSION ... 68
7.1 Results ... 68
7.2 Discussion and policy implications ... 68
7.3 Limitations and further research... 71
Bibliography ... 73
2
APPENDIX 2: Investment Transmission Mechanism ... 82 APPENDIX 3: Construction of policy index ... 83 APPENDIX 4: The Delta method to estimate standard error ... 84
3 Lists of Tables
Table 2. 1 Top 10 ODA receipts by recipients ... 13
Table 2. 2 ODA per capita by regions (2006-2010) ... 16
Table 3. 1 Productivity weight by level of education attainment in Vietnam ... 21
Table 4. 1 Growth accounting results 1991-2012 excluding educational adjustment ... 28
Table 4. 2 Growth accounting results 2006-2012 including educational adjustment ... 29
Table 4. 3 Vietnam human capital index 2006-2012 ... 31
Table 4. 4 Summary of integration test results ... 32
Table 4. 5 Diagnostic results for ARDL model... 32
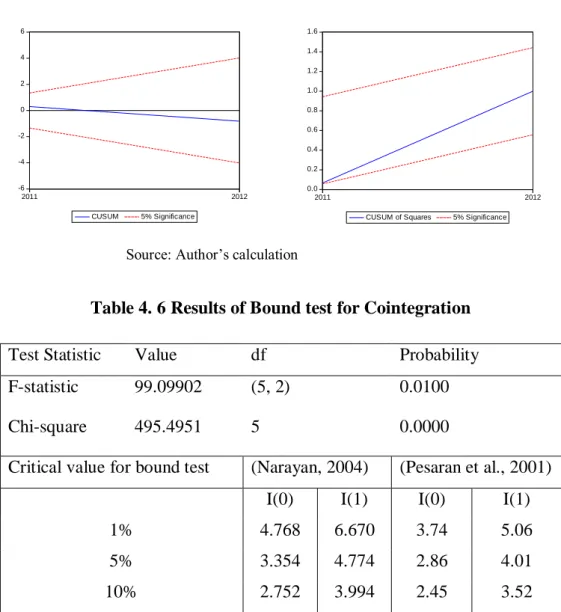
Table 4. 6 Results of Bound test for Cointegration ... 33
Table 4. 7 Estimated long-run coefficients from the ARDL model ... 34
Table 4. 8 Error correction representation of the ARDL model (short-run estimate) ... 35
Table 5. 1 Selected macroeconomic indicators of Vietnam ... 40
Table 5. 2 Budget Deficit, Public Debt, and Public Spending in Vietnam (%GDP) ... 43
Table 5. 3 Summary of education indicators ... 51
Table 5. 4 Summary of health indicators ... 51
Table A 1 Committed, signed, and disbursed ODA flow into Vietnam (1993-2012) ... 81
Table A 2 Result for investment regression ... 82
Table A 3 Principal Component Analysis results for constructing policy index ... 83
4 Lists of Figures
Figure 2. 1 Trend in aid to Vietnam since 1970 ... 14
Figure 2. 2: ODA Commitment, Signed ODA, and ODA Disbursement in 1993-2012 ... 14
Figure 2. 3 Total net ODA disbursement per capita ... 15
Figure 4. 1 Indices of growth accounting results 1991-2012 (1900=100) ... 29
Figure 4. 2 Plot of CUSUM and CUSUM of square of the ARDL model ... 33
Figure 5. 1 Quality indices of infrastructure in selected Asian countries ... 47
Figure 5. 2 ODA support to transportation, post, and telecommunication (US$ millions) ... 49
Figure 5. 3 Public spending on education and health (VND billions) ... 53
Figure 6. 1 USD/VND index, NEER, REER, and export volume (1992-2008) ... 58
Figure 6. 2 Aid disbursement rate, aid inflow growth rate, and revenue growth rate (%) ... 60
5
1 INTRODUCTION
It is widely common that the domestic capital needed to promote economic growth in developing countries is insufficient. Foreign aid therefore becomes one potential external capital that is expected to significantly boost economic development in developing countries. Accordingly, the debate on the relationship between foreign aid and economic growth has been greatly heightened for decades. Although economic theories are fairly consistent with respect to the pivotal role of aid in spurring growth, the empirical evidence has remained controversial. While some studies have found the significantly positive relationship between foreign aid and final economic outcomes (e.g. Henrik Hansen and Finn Tarp, 2000; Channing Arndt et al., 2010; Juselius et al., 2014), others have reached to the conclusion of insignificant or even significantly negative relation. For example, Easterly (2003) asserts a skeptical viewpoint about aid‘s role and concludes that aid cannot buy growth.
The debate seems to be mainly driven by the results from cross-country regression analyses, whilst there have been few studies that adopt specific-country approach to investigate the impact of aid on growth. However, it should be noted that the aid effectiveness is diverse across countries. Although cross-country empirical analyses have progressively developed and enormously contributed to our understanding of aid-growth link, there is clear need for country case studies to practicably capture country-specific heterogeneous features. Hence, this study makes a contribution to the less researched country-level literature on aid effectiveness.
With respect to country specificity, Vietnam appears to be an interesting case study. Vietnam has received impressively increasing amount of Official Development Assistance (ODA) since 1993 and been one of the major ODA recipients in South East Asia region. There is a general belief that foreign aid programs and projects have made substantial contribution to Vietnam‘s success in achieving remarkable economic growth since 1990s. However, to date, research evidence remains scant and ambiguous. In fact, there have been only a few available empirical studies that undertook some investigations into the impact of external assistance on growth (e.g. Chengang Wang and V.N. Balasubramanyam, 2011; Yin Pui Mun and Lau Sim Yee, 2013; and Hong, 2014); yet the final conclusion has still been debatable. Moreover, earlier research appears to lack comprehensive analysis which probes the impact of aid on the basis of understanding the nature of aid inflow to the country and the specific mechanisms through which aid has affected economic development. Therefore, this indicates that there is a need for more in-depth and comprehensive investigation on the aid-growth relationship in this aid-abundant country.
6
The present research employs pluralistic methodological approach to assess the impact of foreign aid for the purpose of delivering more robust results. At first, the growth accounting analysis is conducted in order to sketch out the sources of economic outcomes and then link them to the contribution of foreign assistance. The estimation of the direct aid impact is carried out using the Autoregressive Distributed Lagged (ARDL) approach to cointegration for the period 1993-2012. This approach avoids the problem of unit roots and yields valid coefficient estimates even in the presence of endogenous regressors. Additionally, the study conducts an analysis reviewing both positive growth-enhancing effects and negative growth-retarding effects of foreign aid across different sectors. The approach aims to capture various channels through which external aid can influence final economic outcomes.
1.1Research objectives
The main purpose of the present thesis is to provide a country-specific study of aid and growth in one of the largest aid recipients in the world. The final target of the research is not to put out a conclusive statement on whether or not aid is effective in promoting economic growth in Vietnam. Rather it is hoped that the study would contribute to a better understanding of the reality of aid-growth relationship in Vietnam, how and through which channels aid may influence outcomes, and what make aid works better or less well.
On the basis of better comprehension of the factors that might improve or undermine aid effectiveness, this research is expected to contribute some discussions on ways that make aid works better. Accordingly, the study would attempt to come up with policy implications in order to improve aid effectiveness in Vietnam.
1.2Research questions
In order to conduct the research, some relevant questions include:
• What does empirical evidence show regarding the link between foreign aid and economic growth?
• Which are the specific channels through which aid can positively and negatively influence on final economic outcomes?
• How has foreign aid impacted on Vietnam‘s growth and developmental outcomes? • What are the potential challenges to efficiently allocate and implement external aid
7
• How can Vietnam handle the negative impacts and maximize the benefits from future aid in order to effectively foster economic development?
1.3Structure of the Thesis
The present thesis is divided into seven chapters. The present chapter introduces the research topic as well as explains the aim, the objectives, and the research questions of the study. The chapter two presents the highlights of the theoretical and empirical literature and reviews the history and characters of aid inflow to Vietnam since 1993. The chapter three explains methodologies used to estimate aid-growth relationship and data sources. The chapter four goes on to document the results of both estimation methodologies employed. Chapter five and six discuss the positive and negative impacts of aid across different sectors, covering aid management. The final chapter concludes.
8
2 LITERATURE REVIEW AND BACKGROUND
2.1Economic theory and literature review
The purpose of this section is to give the reader a brief review of the literature relevant to the present study. The section will continue as follows: the theoretical basis that conceptualizes the role of external assistance in economic development, the empirical evidence, and the review of methodology.
In the early literature, foreign aid is considered as a driving force for economic growth through physical capital accumulation in recipient countries. The Harrod – Domar model of economic growth, which implies that investment is the only factor determining growth, is one popular conceptual framework being used to justify the aid growth relationship. With investment assumed to be equal to savings, the model explains that poor countries suffer low economic growth due to the saving gap, which happens when domestic savings are insufficient to finance the level of investment required to achieve the desired growth rate. Foreign aid is thus expected to play a supportive role in spurring growth by supplementing to domestic savings and filling up the gap. Primarily based on the Harrod – Domar model, the two-gap model of Chenery and Strout (1966) made a significant contribution to foreign aid literature by focusing on not only the saving gap but also the foreign exchange gap. The two-gap model points out that international trade and foreign exchange besides domestic savings are also important to the development of one economy and that a gap between import requirements for a given level of production and foreign exchange earnings can reduce economic growth by constraining both imports and savings. Developing countries barely overcome the shortage of foreign exchange by their own resources and hence foreign aid supposedly helps to relax this constraint.
The above models have however received some criticism as they do not allow the substitution of labor for capital and assume the stable linear relationship between investment and growth. Eventually, further growth models have been developed trying to solve those drawbacks of previous models and contributing to literature on assessment of the impact of foreign aid on economic growth. The Solow-style neoclassical model, in which capital and labor are substitutable and exhibit diminishing return to scale, is considered as an alternative to the Harrod – Domar growth model. The model continuously affirms the crucial role of capital accumulation, part of which constitutes foreign aid, in promoting growth. However, in the model, there is no permanent causal relationship between investment and growth (Easterly, 2003) and therefore, it
9
restricts the use of the basic neoclassical model to study the impact of aid on growth over the long-run.
An alternative to the neoclassical growth models, endogenous growth models, take into account a complex set of inputs besides physical capital as determinants of economic growth, such as technology, human capital, intermediate new goods, organizational capital, social capital, and institutional design (Easterly, 2003). The model has become a popular theoretical framework used in current aid-growth empirical investigations since it remedies the shortcomings of the neoclassical model of economic growth and provides additional empirical relevance and explanatory power (Sakyi, 2011). In particular, the assumption of increasing returns to capital of endogenous growth model implies that foreign aid may improve growth in long-run and therefore supports the estimation of the long-term economic impact of aid (Kargbo, 2012). Furthermore, the model assumes the non-linear relationship between investment and growth (as opposed to the neoclassical growth model); and so there would be the case of measuring ―the quality of investment‖ and the quality of foreign aid (Easterly, 2003). Based on this model, the contribution of external assistance to growth can be estimated through other factors in addition to capital accumulation. The endogenous model, for instance, also stresses the critical role of human capital in the growth process; and therefore this justifies the assessment of foreign aid on building up human capital in recipient countries. Indeed, aid in the forms of both technical assistance and investment in education and health care system potentially fosters human capacity building and then production outcomes (Kargbo, 2012).
Following the aforementioned growth theories, the debate on whether foreign aid in actualit y has been effective in propelling economic growth has intensified over the last few decades. Being cognizant of the enormous amount of the existing empirical studies on aid-growth relationship, this paper will limit the review to the analysis of the main characteristics of aid effectiveness literature and its methodological development. The overview of empirical literature can be described through four main features. Firstly, the final conclusion regarding the positively contributing impact of foreign assistance on economic growth remains fairly controversial. On the one hand, studies have found that aid successfully promotes economic growth in recipient countries1. On the other hand, some conclude that the impact of aid on growth appears to be statistically insignificant or even negative and significant2. Juselius et al. (2014) argue that this divergence is attributed to the differences in analytical framework utilization, estimation
1
See (Mosley, 1980); (Mosley et al., 1987)); (Henrik Hansen and Finn Tarp, 2000); (Carl-Johan Dalgaard et al., 2004); (Channing Arndt et al., 2010); (Matthijs Lof et al., 2013).
2
10
methodology, variable specifications, and initial assumptions. Indeed, basing on same data sources covering 131 countries over the period 1960-2006 as those used in Nowak-Lehmann et al. (2012), Matthijs Lof et al. (2013) employ different econometric model and find positive and statistically significant long-run effect of aid on income, which is opposed to the former‘s result.
Secondly, empirical literature presents a mounting concern about the conditional relationship between aid and growth, in which aid works in some circumstances but not in others, depending on the characteristics of the recipient countries - e.g. policy, political environment, economic vulnerability, or geographical characters. During early 2000s, Craig Burnside and David Dollar (2000) attracted considerable attention from academia with the idea of testing the aid-growth relation in the presence of policy. Although some papers agree with Burnside and Dollar‘s conclusion that foreign aid only work in good policy circumstance3, quite many others criticize the methodology approach and challenge the result. Typically, Henrik Hansen and Finn Tarp (2000) find that the aid-growth link is signigicant and positive, regardless of an unfavorable policy environment. Moreover, Easterly et al. (2004), by using the same variable specifications as Craig Burnside and David Dollar (2000) did but with updated data sample, argue that the role of policy in determining the foreign aid effectiveness disappears. Other examples of this ―conditional‖ strand of the literature are Chauvet, L. and P. Guillaumont (2004) which revisit the relationship between foreign aid and growth while making assumptions that aid effectiveness depends on policy, structural economic vulnerability, and political instability; or Carl-Johan Dalgaard et al. (2004) which find that foreign aid performance seems to be related to geographical location of country sample.
Thirdly, a recent development in the aid-growth literature is the analysis of the long-run cumulative effects of aid on growth. In other words, there is a growing tendency among aid studies toward the discussion of non-growth intermediate determinants through which foreign assistance might affect the final outcome of the recipient country, including health, education, environment and climate change, institution, or politics. Simone Dietrich and Joseph Wright (2012), for instance, conclude that foreign aid on democracy and governance has a consistently positive effect on democratic consolidation using survival analysis for the period from 1991 to 2008 in sub-Saharan Africa sample; or Lynda Pickbourn and Léonce Ndikumana (2013) observe that foreign aid appears to be effective in reducing maternal mortality as well as the gender gap in youth literacy regardless of initial conditions of the recipients. Typically, Channing Arndt et al. (2013) process a comprehensive evaluation of long-run effect of aid in developing countries
3
11
by thoroughly analyzing the link between foreign aid and a cluster source of growth and deduce that ―Aid has contributed to economic growth by stimulating its proximate determinants – e.g., physical capital accumulation and improving human capital, particularly education and health‖. Last but not least, an overwhelming proportion of aid effectiveness literature is cross-country research, which has sometimes been criticized for not being usually informative for country-level perspective. Arguably, the impact of aid on growth is far from equally everywhere since ―countries with very different initial conditions and/or aid profiles may see very different responses to aid over time‖ (Tarp, 2009). Meanwhile, cross-country approach cannot capture the fact that countries are heterogeneous; and thus it does not necessarily guarantee the applicability of cross-country research‘s findings in a particular country (Kargbo, 2012). This therefore warrants the need for country case studies in which a particular country‘s circumstances and performance would be thoroughly taken into account. On this basis, the present research provides country-level analysis by examining the Vietnam aid – growth experience.
To date, analytical methodologies have been gradually altered and developed wit h the aim of tackling previous methodological limitations and capturing more precisely the complexity of foreign aid. The first progressive move is the application of Two-stage Square (2SLS) model and Generalized Method of Moments (GMM) model, in which the supposedly endogenous problem of foreign aid and other related variables such as governance, investment, and policy can be handled. Later on, the availability of panel data techniques makes it possible to account for unobserved country-specific factors and exploit variations both across countries and over time (Matthijs Lof et al., 2013). For example, the use of panel GMM regressions to revisit the aid-growth evidence in Rajan, R.G. and Subramanian, A. (2008) was paid attention as it can address the endogeneity of other regressors as well as incorporate fixed effects. Recently, new methods based on vector autoregressive (VAR) model have been emerged reflecting the new trend of foreign aid study - the long-run effect of aid on a set of key macroeconomic variables which finally lead to economic growth - including co-integrated VAR model (Juselius et al., 2014) and panel VAR model (Matthijs Lof et al., 2013).
To sum, the review concludes that the debate on the aid-growth relationship has still been inconclusive and appears to continue. Notwithstanding, the abundant and diversified aid effectiveness literature and the development of analytical methodology have built a concrete foundation for further analysis of a country case study, which will be presented in the next sections.
12
2.2Overview of foreign aid in Vietnam
It would be difficult to precisely assess the impact of foreign aid on economic growth of a specific country without understanding the features of aid inflow to this country. Therefore, the following part will briefly discuss the overview of Vietnam‘s economic development and main characteristics of foreign aid in Vietnam over the period 1993-2012. In the present study, ODA is used as the indicator of foreign aid.
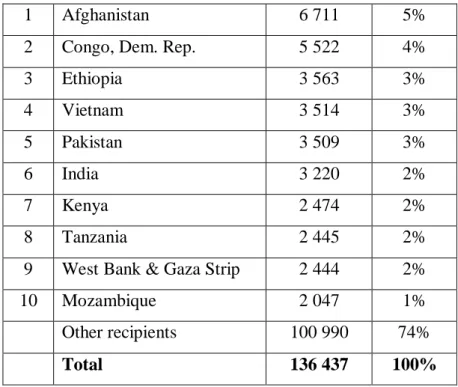
Vietnam has become one of the case studies in development textbooks after experiencing a spectacular transition process since the launch of ‗Doi Moi‘ – a homegrown, political and economic renewal campaign – in 1986. Prior to the Doi Moi, Vietnam was one of the poorest countries in the world due to a century of warfare and ineffective economic mechanism – centrally planned economy. During that time, the country was faced with many problems including high poverty rate, unproductive and underdeveloped agriculture, hyperinflation, extremely poor economic infrastructure, famine, and the trade embargo by the west. Then, the Doi Moi has marked an impressive transition from a centrally planned economy to a so-called socialist-oriented market economy4 and from one of the poorest countries in the world to a lower-middle-income country in two decades. According to World Bank (2012), between 1990 and 2010, Vietnam‘s economy grew at the annual average rate of 7.3 percent. Other than the early 1990s, the only times that growth fell below 7 percent were in the aftermath of the Asian financial crisis, 1998-1999, with the annual average growth rate of 5.2 percent, and during the recent global crisis, 2008-2010, with the annual average rate of 5.7 percent. Since the beginning of the transition process, the supply and demand of external support such as foreign aid have significantly increased because of the normalization of Vietnam‘s diplomatic relationship with the rest of the world, especially with the west, and the need for physical capital as well as advanced knowledge and technology for the rapid expansion of the economy. This naturally raises the question how much aid has contributed to Vietnam‘s development and economic growth. In fact, Vietnam is one of Asia‘s foremost ODA recipients and still receiving a huge and increasing amount of ODA each year. The latest statistics of DAC shows that Vietnam is the fourth largest ODA-recipient all over the world (see table 2.1).
4
Socialist- oriented market economy: a multi-sector market economy oriented towards the eventual and long-term development of socialism, where the state sector plays a decisive role in directing economic development.
13
Table 2. 1 Top 10 ODA receipts by recipients (US$ millions, net disbursement in 2011)
Source: DAC/OECD
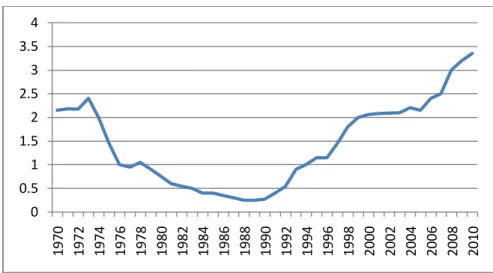
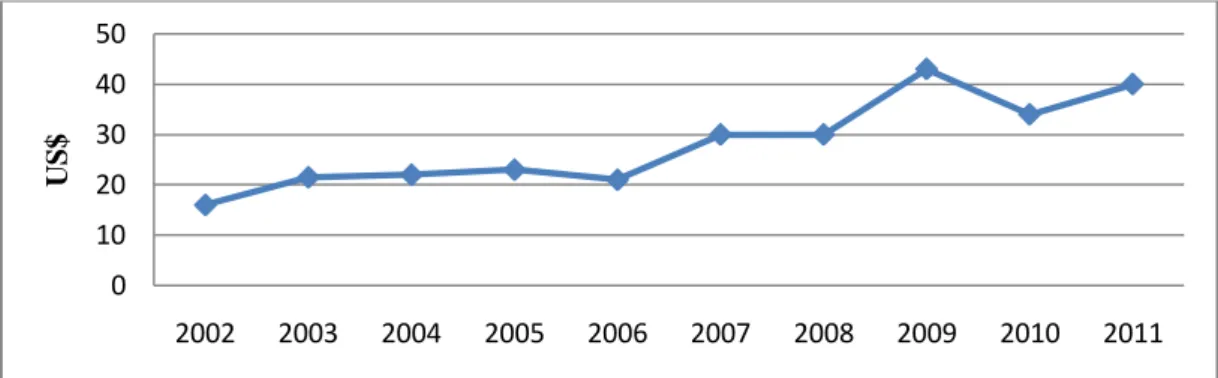
Prior to the collapse of Communist Block, Vietnam received ODA mainly from Former Soviet Union, Eastern European countries, and China (OECD, 2004). However, the political changes influencing these donors during 1990s made the main external financial source gradually dry up and led to a big challenge for Vietnam in filling the financial gap needed for economic expansion. Under this circumstance, the first Consultative Group Meeting (CG meeting) for Vietnam conducted in Paris in November 1993, in which a full cooperation between Vietnam and the international financial community was formally established, became a turning point marking the resumption of ODA flow into Vietnam. Since then, the CG meetings are held once or twice per year in Vietnam at which the Vietnamese government and donors exchange views on socio-economic policies and the implementation of the ODA committed by the donors. As a result, the cumulative cooperation between donors and recipient has led to the rapidly increasing flow of ODA into Vietnam since 1993. More explicitly, the figure 2.1, which illustrates the trend in aid to Vietnam since 1970, represents the continuous upward trend from 1993 to present period. According to the Ministry of Planning and Investment (MPI), during the period 1993-2012, international donors have committed to provide over US$78 billion for Vietnam, of which the disbursed amount reached to US$38 billion (see figure 2.2). In addition, the amount of disbursed funds over the period has been improved, which is indicated by the slightly increasing trend of the net ODA disbursement per capita in the figure 2.3. Nevertheless, it is the fact that the
1 Afghanistan 6 711 5%
2 Congo, Dem. Rep. 5 522 4%
3 Ethiopia 3 563 3% 4 Vietnam 3 514 3% 5 Pakistan 3 509 3% 6 India 3 220 2% 7 Kenya 2 474 2% 8 Tanzania 2 445 2%
9 West Bank & Gaza Strip 2 444 2%
10 Mozambique 2 047 1%
Other recipients 100 990 74%
14
average disbursement rate of 48 percent over the period 1993-2012 is still lower than the world average rate5. This might signal shortcomings in the cooperation between Vietnamese government and its donors and weaknesses in managerial capacity of the recipient‘s authority.
Figure 2. 1 Trend in aid to Vietnam since 1970
(US$ billions, 2010 prices and exchange rate, 3-year average net ODA receipts)
Source: DAC/OECD
Figure 2. 2: ODA Commitment, Signed ODA, and ODA Disbursement in 1993-2012 (Unit: US$ billions)
Source: Foreign Economic Relation Department – MPI
5
The ratios of ODA net disbursement to ODA commitment (2010 price) to all developing countries in 2010 and 2011 are 80 and 85 percent, respectively. (Source: DAC/OECD)
0 0.5 1 1.5 2 2.5 3 3.5 4 1970 1972 1974 1976 1978 1980 1982 1984 1986 1988 1990 1992 1994 1996 1998 2000 2002 2004 2006 2008 2010 0 1 2 3 4 5 6 7 8 9 1993 1994 1995 1996 1997 1998 1999 2000 2001 2002 2003 2004 2005 2006 2007 2008 2009 2010 2011 2012
15
Figure 2. 3 Total net ODA disbursement per capita
Source: DAC/OECD
The providers of ODA to Vietnam include 28 bilateral donors and 23 international organizations in 2012, increasing from total 26 bilateral donors and international organization in 1993 (MPI). Of all the donors, Japan, IDA6, and AsDB Special Fund7 are the three largest donors of Vietnam, providing about 75 percent of total ODA value disbursed in Vietnam over 2007-2011. With respect to composition of aid from Vietnam‘s two largest donors, Japan and IDA, the share of loans is much larger than the share of grants, in which the former accounts for more than 90 percent of the total amount of aid. This proportion partly explains aid composition and the trend of disbursed aid modalities in Vietnam. Over the history of receiving aid, the share of loans has been usually much larger than the share of grants and continually increased over time. According to MPI, the proportion of loans in ODA capital increased from 80% in 1993-2000 to 93% in 2006-2010 and to 95.7% in 2011-2012. Almost all of the ODA loans are long-term and carry preferential interest rate and a long grace period. Around 45 percent of the loans have interest rate lower than 1 percent p.a. and a maturity of at least 30 years, of which 10 years is the grace period. Another trend regarding aid modality is the increasing share of ODA disbursed through general or sector budgetary support and pooled funding (Adam McCarty et al., 2009). The trend toward non-project based modalities and using country system provides recipient‘s authority with greater ownership but raises the challenges of managerial capacity and moral hazard.
ODA resources have mostly been allocated in accordance with the priority the Government places on economic sectors as well as the preference of the donors. With the aim of creating a favorable environment for economic development and poverty reduction, the Government allocates the aid inflow mainly to economic infrastructure and services, which accounts for 41.3 percent of the total aid. Each donor also has specific preference in terms of aid allocation. More
6
IDA: International Development Association - The part of the World Bank established in 1960 that helps the world‘s poorest countries by providing loans (called ―credits‖) and grants for programs.
7
AsDB Special Fund: Asian Development Bank Special Fund
0 10 20 30 40 50 2002 2003 2004 2005 2006 2007 2008 2009 2010 2011 US$
16
particularly, Japan, the Vietnam‘s largest donor, for the purpose of directing toward concrete goals with particular emphasis on increasing industrial capacity and building up country‘s comparative advantages, concentrates more than 80 percent of its aid into Vietnam on economic infrastructure, then around 10 percent on social infrastructure. In contrast, the United States, the sixth largest bilateral donor of Vietnam, mainly focuses on social infrastructure sector, with roughly 85 percent of the total aid amount; or France, the third largest bilateral donor, assigns about 35 percent of its ODA into Vietnam to the multi-sector8.
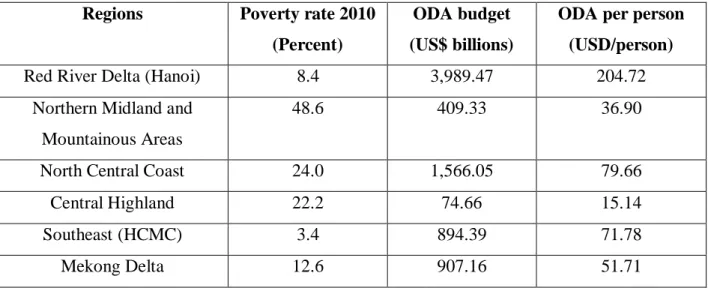
Another typical feature of Vietnam‘s ODA inflow is the relatively unequal distribution of aid financing between rural and urban area. It appears that the prosperous urban areas such as Red River Delta and Southeast tend to be allocated large volume of ODA per capita; meanwhile the poorest rural areas such as Northern Midland and Mountainous Areas and Central Highland have very low levels of ODA per capita (see table 2.2). This recognizes the fact that ODA has not fully focused on the issue of regional disparities in development. The most active donors participating in Poverty Reduction Strategy Paper (PRSP) are the World Bank, UNDP, SIDA, and DfID9 since they participated in the joint poverty working group with the Vietnamese government. According to Japan International Cooperation Agency (JICA), being cognizant of growing regional disparities, international donors have recently put more emphasis on poverty reduction in their assistance programmes.
Table 2. 2 ODA per capita by regions (2006-2010)
Regions Poverty rate 2010
(Percent)
ODA budget (US$ billions)
ODA per person (USD/person)
Red River Delta (Hanoi) 8.4 3,989.47 204.72
Northern Midland and Mountainous Areas
48.6 409.33 36.90
North Central Coast 24.0 1,566.05 79.66
Central Highland 22.2 74.66 15.14
Southeast (HCMC) 3.4 894.39 71.78
Mekong Delta 12.6 907.16 51.71
Source: World Bank, MPI
8
This data was collected by OECD in 2012 which is available at
http://www.compareyourcountry.org/chart.php?project=aid-statistics&page=0&cr=oecd&lg=en
9
UNDP: UnitedNations Development Programme
SIDA: Swedish International Development Cooperation Agency DfID: UK Department for International Development
17
Finally, although Vietnam has received large sums of foreign aid, the ratio of aid dependency is relatively low. According to the data released by World Bank, over the period 1993-2011, Vietnam‘s average ratio of net ODA received to GNI is 3.85 percent. Meanwhile, the average rate in Sub-Saharan African countries over the same period is much higher, approximately 10 percent10, of those the ratios of Guinea-Bissau and Mozambique are 30 and 24 percent, respectively. Specially, in Afghanistan, the largest ODA recipient in the world, this ratio reaches to almost 42 percent, representing its extreme dependence on ODA inflow.
To sum, Vietnam has experienced a robust increase of aid inflow over the period 1993-2012. Being allocated to various socio-economic fields, this external assistance is expected to play an integral role in spurring economic growth and development in Vietnam. However, the relatively low disbursed rate and the current trend regarding disbursed aid modalities have emphasized the need to more effectively absorb and use this financial assistance. Moreover, it is the fact that the external assistance inflow in the future will be ceased growing and gradually decreased together with the higher development level of the country. Therefore, precisely assessing the impact of aid in order to maximize the benefits of this assistant source has become absolutely necessary. Evaluation and analysis of aid impacts on economic growth will be discussed in the following chapters.
10
The ratio is calculated from the data of 47 Sub-Saharan African countries (source: World Development Indicators – World Bank).
18
3 METHODOLOGY AND DATA SOURCES
3.1Growth accounting analysis
With the aim of measuring the effect of foreign aid on economic growth, it is necessary to proximately assess the sources of growth. Growth accounting approach, which helps explain the sources of economic outcomes by decomposing growth rate into the contributions of physical capital, human capital, and total factor productivity, is a proper methodology. Within the scale of the present study, there are two main purposes of conducting growth accounting analysis. First, the results would reveal the respective contribution of production factors to Vietnam‘s economic growth over the period 1991-2012 and then be referred to the impacts of foreign aid on total output. Second, the exercise is expected to provide a robust informative basis to support the analysis of the positive and negative impacts of aid on determinants of growth, which will be discussed in the chapter 5 and chapter 6 of this research.
This study implements the growth accounting analysis using Cobb-Douglas aggregate production function with Hicks-neutral technical change but try to include human capital instead of labor force as a factor of production. Therefore, the aggregate production function has the form as follows:
Y = A Kα Hβ = A Kα (h*L)β (1)
where Y is GDP in real terms; A is total factor productivity (TFP) which represents the level of technology and technical knowhow; K is fixed capital inputs; H presents human capital which is the product of labor force (L) and human capital index (h); α and β represent national income share accrued to fixed capital and human capital, respectively. The production function (1) is assumed to be constant return to scale, which means α + β = 1.
Then, the original production function can be expressed under differentiating form and trans-log form, as follows: ΔYt = ΔAt + αΔKt + βΔHt (2) Ln Yt Yt−1 = α Ln Kt Kt−1 + β Ln Ht Ht−1 + A t,t-1 (3)
19
where Δ denotes the rate of change of each term; At,t-1 indicates the growth in a translog TFP
measure. In present study, the share of fixed capital and human capital in total product are assumed to be constant over the considered period.
The above production function will be used to calculate the individual contribution of production factors in growth accounting exercise. In order to complete this estimation, measures of three elements including fixed capital stock, human capital stock, and aggregate factor shares are needed. The following sub-sectors would discuss the method and process to calculate those factors.
3.1.1. Measuring fixed capital stock
The fixed capital stock will be estimated using the Perpetual Inventory Method (PIM), which is a common method in growth literature. The value of capital stock is calculated based on the equation:
Kt = (1- δ)* K t-1 + It (4)
where K is the capital stock, I is the investment, and δ is the depreciation rate of capital.
In this paper, all capital goods are treated as homogeneous and applied an annual depreciation rate of 5 percent. The same rate of depreciation for the case of Vietnam was used in Le Dang Doanh et al. (2002) and Shenggen Fan et al. (2003).
Following Iradian (2007), we calculate the initial value of capital stock using the approach first introduced in Harberger (1978). Particularly, this approach is based on the observation that if the capital-output ratio is constant in a given period of time, the capital and output growth rates are equal during that period. When reorganizing the equation (4), we derive the equation (5).
Kt− Kt−1
Kt−1 + δ = It
Kt−1 (5)
where capital growth rate, Kt− Kt−1
Kt−1 , is equal to the output growth rate. Thus, equation (5) can be
written as:
Kt-1 =
It
20
The value of output growth (g) can be calculated by using five-year average annual growth rate of real GDP in which the base year capital stock would be centered in the middle of five-year period. Since the initial capital stock in this study starts from 1990, the average growth rate of real GDP would be calculated during the period 1988-1992.
3.1.2. Measuring human capital
Since data for Vietnam do not allow a reasonable calculation of human capital stock, many previous studies that implement growth accounting exercise used the data of labor force or of economically active population as proxy for human capital stock11. It means that all workers have been treated as if they are identical regardless of their education attainment, working experience, gender, geographical coverage or working hours. However, reality as well as growth literature have shown that both quantity and quality of labor force influence aggregate output. Therefore, present study at the beginning attempted to measure the human capital of Vietnam. Unfortunately, due to lack of data, the measurement could not be conducted. This research has consequently used the results calculated from Hyun Hwa Son (2012), which measures the human capital of Vietnam using the 2008 Vietnam Household Living Standard Survey (VHLSS). In Hyun Hwa Son (2012), the author develops a measure of human capital taking account of different levels of education that people possess and of other control variables using the following Mincerian-type wage regression:
Ln(x) = α + β(age) + β1(age2) + γDsex + εDurban + ρ(Whours) + ηDethnicity + 9𝑖=2𝛿𝑖𝐷𝑖 + u (7)
where 𝐷𝑖 are eight dummy variables for each level of educational attainment; the regression coefficient 𝛿𝑖 is interpreted as the productivity of the ith educational attainment level relative to that of having ―no degree‖; Whours denotes hours of work; Dsex, Durban, and Dethnicity are dummy
variable illustrating gender, geographical coverage, and ethnicity of the earner, respectively.
11
21
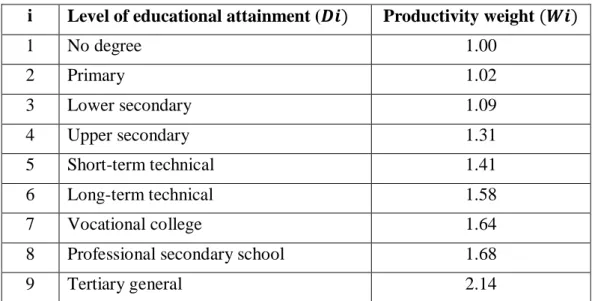
Table 3. 1 Productivity weight by level of education attainment in Vietnam
i Level of educational attainment (𝑫𝒊) Productivity weight (𝑾𝒊)
1 No degree 1.00 2 Primary 1.02 3 Lower secondary 1.09 4 Upper secondary 1.31 5 Short-term technical 1.41 6 Long-term technical 1.58 7 Vocational college 1.64
8 Professional secondary school 1.68
9 Tertiary general 2.14
Source: (Hyun Hwa Son, 2012)
Overall, the results indicate that an additional level of education gives rise to higher earnings, which represent to higher productivity weight (see table 3.1). Those productivity weight indices are assumed to be constants over the considered period. Then, in order to calculate total human capital, it is necessary to collect the data regarding the structure of employment by education level. In this study, the structure of population 15 years old and older is used to proximately represent the structure of labor force. In particular, the total human capital and the human capital index - (h) in equation (1) - of each year can be calculated by:
H = (𝐿𝑖 ∗ 𝑊𝑖) (8)
h = 𝐻
𝐿𝑖 (9)
where H is total human capital, Li is labor force with ith educational attainment level, Wi is the
productivity weight of ith educational attainment level.
Nevertheless, once again, due to insufficient data of labor force structure by educational attainment, the quality-adjusted growth accounting result, which presents the contribution of education to economic growth, is only available for the period 2006-101212.
12
General Statistical Office (GSO) of Vietnam has started to process the Vietnam Labor Force Survey and Vietnam Household Living Standard Survey (VHLSS) since 2006. Before 2006, VHLSS was only conducted in 1993 and 1998.
22 3.1.3. Aggregate factor shares
One common approach to estimate the shares of fixed capital and human capital in aggregate output is to use a priori measure of capital in the range of 0.3 – 0.4 (Iradian, 2007). Present study follows this approach by assuming that the fixed capital share is at the middle of the common range, 0.35, and the human capital share is 0.65. This share was also adopted for some other East Asian countries13. In fact, Le Dang Doanh et al. (2002), who undertook the growth accounting analysis for the case of Vietnam, used the share 0.4 and 0.6 for fixed capital and human capital, respectively. However, as discussed in Rainer Klump and Thomas Bonschab (2004), Le Dang Doanh et al. (2002) find that the assumed value of fixed capital share is too high. Therefore, it seems to be reasonable to set the fixed capital share at 0.35.
Another issue that should be taken into consideration is the change of aggregate factor shares during the period within the scope of present study. Indeed, with the case study of Mozambique, Channing Arndt et al. (2006) allow the labor and capital shares to move with the aim of capturing the changing pattern of fixed capital and human capital accumulation before and after the civil war. Regarding the present research, during the considered time period, 1991-2012, the country did not experience large upheaval that may strongly affect factor shares as the civil war did in the case of Mozambique. Therefore, the shares of fixed capital and human capital are considered to be constant in this paper.
3.2Econometric model
Whilst the growth accounting exercise is a preliminary step for the analysis of fundamental determinants of economic growth through which the impact of aid is indirectly assessed, the following part is a further step to directly evaluate the aid effectiveness using econometric analysis. The main purpose of this empirical model is to estimate the short- and long-run effect of growth determinants, in which foreign aid is considered as one of those determinants. The model used in the current paper is based on aforementioned growth theories including Harrod-Domar, neoclassical, and endogenous growth model. It is consistent among those growth theories that capital is an important determinant of economic growth. Besides, the endogenous growth model has recognized the significant role of public policy in long-run economic growth and then supported the inclusion of policy variable in empirical growth regression. Following
13
23
those growth theories, the empirical model for estimating aid-growth relationship is specified as follows:
GDPGt = β0 + β1ODAt + β2INVt + β3Policyt + β4Crisist + μt (10)
where GDPG is real gross domestic product growth rate being a proxy for economic growth; ODA denotes the ratio of official development assistance to GDP presenting foreign aid; INV is the ratio of investment to GDP, used as a proxy for capital; policy is macroeconomic policy index accounting for fiscal, monetary, and trade policies; and crisis is a dummy variable capturing the impact of shocks which are not captured by other explanatory variables14. The empirical analysis uses annual time series data from 1993 to 2012.
As can be seen, both investment and ODA are included in the growth regression (10). Consequently, there might be the problem of double counting since some part of investment will be funded by aid, leading to a biased coefficient on the aid variable (Feeny, 2005). In some other studies, the authors choose to include the aid variable while omitting the investment variable to avoid the double counting problem. Nevertheless, omitting the investment variable will cause model misspecification and a biased coefficient on the aid variable as not all aid goes to investment (Gomanee et al., 2002; Feeny, 2005). Therefore, this reseach follows the methodology of Gomanee et al. (2002) and Feeny (2005) to tackle the problem using Residual Generated Regressors technique. In other words, the present study examines the effect of aid on growth taking into account the transmission mechanism of investment. In the first step, the presence of an aid investment transmission mechanism is investigated. In particular, an OLS regression in which investment is treated as the dependent variable is examined. The explanatory variables include foreign aid; the availability of credit (Gomanee et al., 2002; Feeny, 2005); economic growth (Feeny, 2005); and one period lagged investment to account for the dependence of current investment levels on physical capital stock (Gomanee et al., 2002). Because the aid investment mechanism exists, the model can move to the second step in which the variable INVRES is constructed representing the part of investment that is not attributed to foreign aid. INVRES is estimated by using the residuals from an aid-investment bivariate regression, which means that investment is regressed on aid, and then substituted for INV in the
14
The crisis variable takes the value 1 during period 1998-1999 capturing the consequence of Asian crisis and 2008-2011 expressing the shock from global crisis and Vietnam‘s self-induced recession. Mustapha K. Nabli et al. (2010) argue that the economy was not well prepared for the crisis and that the global crisis compounded Vietnam‘s difficulties. Consequently, the country suffered quite lasting economic downturn from 2008 to 2011 due to the effects derived from both the global crisis and the country‘s macroeconomic instability.
24
regression (10). The details of investment transmission mechanism process are discussed in the Appendix 2.
As mentioned above, policy is captured by macroeconomics policy index in the growth regression. Kargbo (2012) defends the use of the policy index as it helps to save the degrees of freedom in regression and avoid the potentially high correlation with other macro variables. In this paper, government final consumption expenditure as share of GDP is chosen as a proxy of fiscal policy (Kargbo, 2012; Easterly, W. R. and S. T. Rebelo, 1993); inflation is proxy of monetary policy (Craig Burnside and David Dollar, 2000; Javid, M., and A. Qayyum, 2011); and trade openness measure which is (import+export)/GDP is proxy of trade policy (Feeny, 2005; Craig Burnside and David Dollar, 2000). The policy index is constructed using the Principal Component Analysis (PCA) (see Appendix 3 for more details)15. In general, higher value of policy index indicates better macroeconomic policy.
The econometric procedure adopted in this paper follows the ARDL approach to cointegration which was first introduced by Pesaran, M. H., and Y. Shin (1999) to investigate the long run relationship among the variables of interest. Using this approach has several advantages over other counterpart estimators. First, Pesaran et al. (2001) point out that the approach allows to test for the existence of a relationship between variables irrespective of whether the underlying regressors are stationary I(0), nonstationary I(1), or mutually cointegrated. The approach therefore avoids the uncertainty of unit root pretesting. Comparing to Johansen likelihood approach, another common approach of cointegration, ARDL becomes more flexible as the former is only applicable when the variables have the same order of integration. Furthermore, the integration test results of the base model‘s variables in the present study are shown a mixed integration order. Thus, ARDL approach seems to be the best option in this case. Second, this approach captures both short- and long-run dynamics when testing for the existence of cointegration which certainly fits the main purpose of this part. Third, the ARDL conintegration approach has been proved to help in correcting residual serial correlation and endogeneity bias (see Inder, 1993; Pesaran, M. H., and Y. Shin, 1999). In fact, the potentially endogenous problem of foreign aid has been commonly discussed due to the fact that foreign aid allocation might be depended on the level of income. This advantage makes the use of ARDL become more appropriate for examining the aid-growth relationship. Finally, the test allows the application to a small sample size which is the case of the present research.
15
Javid, M. and A. Qayyum (2011) and Kargbo (2012) also use PCA method to calculate policy index when estimating aid-growth regression.
25
The ARDL approach to cointegration follows six steps. First, the integration test on the time series data must be conducted in order to identify the order of integration as ARDL methodology will be invalidated on I(2) variables. Moreover, this is an important step to determine which approach is appropriate for further investigation. This paper uses two of the common unit root tests namely Augmented Dickey-Fuller (ADF) test and Kwaitkowski-Phillips-Schmidt-Shin (KPSS) test to examine the order of integration of the time series data. The ADF test is widely used to determine the presence of unit root, but KPSS is noted to have stronger explanatory power in dealing with small sample size than other counterparts (Yin Pui Mun and Lau Sim Yee, 2013). Considering small sample size of this case study, we consider KPSS test as the main technique of estimation, which implies that the results of KPSS test will be prioritized in the presence of any difference between the two tests‘ results.
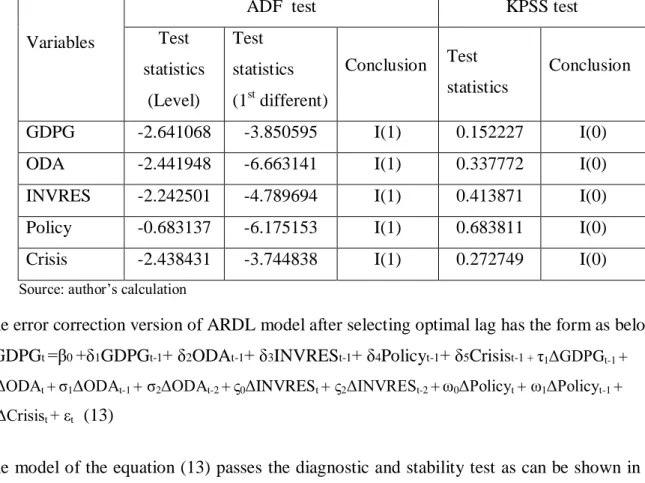
Second, we construct the error correction version of ARDL model, which is specified as follow:
Δyt = a0 + Σ biΔyt-i + ΣciΔXt-i + d1yt-1 + d2Xt-1 + et (11)
where d1, d2 are parameters of the long-run relationship variables; a0 is vector of constant; bi and
ci are matrices of parameters; yt is a vector of endogenous variables; Xt is a vector of explanatory
variables.
Embedding equation (10) into the error correction form (11), we have:
ΔGDPGt =β0 +δ1GDPGt-1+ δ2ODAt-1+ δ3INVRESt-1+ δ4Policyt-1+ δ5Crisist-1 + ΣηiΔGDPGt-i +
ΣζjΔODAt-j +ΣςlΔINVRESt-l +ΣωmΔPolicyt-m +ΣθnΔCrisist-n + εt (12)
where δi are the long – run multipliers. (12) becomes the base equation to estimate the short-run
and long-run relationship among variables.
Third, the optimal lag of the ARDL model which means (i, j, l, m, n) need to be selected. Following the method used in Pesaran, M. H., and Y. Shin (1999), the maximum initial lag length for annual data is set at two periods for all variables. Then, we look at all possible combinations of lag within this constraint and choose the specification with the smallest Schwartz/Bayesian Information Criteria (SC) value. It should be noted that ARDL-SC has been proved to have comparative advantage over ARDL-AIC (Akaike information criteria). Particularly, Pesaran, M. H., and Y. Shin (1999) show that ARDL-SC performs slightly better
26
than ARDL-AIC in the majority of the experiments and that SC is a consistent model selection criterion while AIC is not.
Fourth, before further investigating, the specification derived from previous step must pass the diagnostic and stability test, which ascertain the goodness of fit and model adequacy. Because ARDL model is OLS of the error correction version equation, it must satisfy the test for classical least squares assumptions including serial correlation, functional form of the model, normality of the residuals, and heteroskedasticity. Specially, a key assumption in the ARDL Bound test methodology of Pesaran et al. (2001) is that the errors of equation (12) must be serially independent, leaving the serial correlation test becomes the most important one in this model. In particular, this paper uses Breusch-Godfrey Serial Correlation LM Test, Ramsey Regression Equation Specification Error Test (RESET) model, Jarque-Bera normality test, and heteroskedasticity test ARCH. Furthermore, the cumulative sum of recursive residuals (CUSUM) test and the cumulative sum of squares of recursive residuals (CUSUMSQ) test are conducted to detect the structural instability and model misspecification within the 5 percent critical bounds.
Fifth, if the model passes the diagnostic test and stability test, the ARDL Bounds test will be performed to test the co-integration which means to figure out whether there is evidence of a long-run relationship among the variables or not. Basically, the approach bases on Wald test using the F statistic to examine the null hypothesis of no cointegration (H0: δ1 = δ2 = δ3 = δ4 = δ5
= 0). Nevertheless, the distribution of the test statistic is totally non-standard, which implies that the critical values differ from those in the standard distribution. Therefore, this step will use the critical value for the asymptotic distribution of the F-statistic supplied by Pesaran et al. (2001) and Narayan (2004) to test cointegration16. There are two critical values in which the lower bound is based on the assumption that all the variables are I(0) and the upper bound assumes that all the variables are I(1). If the calculated F-statistic falls below the lower bound, we cannot reject the null hypothesis, meaning that the variables are I(0) and hence no cointegration is possible. In contrast, if the calculated F-statistic exceeds the upper bound, the null hypothesis is rejected, suggesting the existence of cointegration between the variables regardless of whether they are I(0) or I(1). If the F-statistic appears between the bounds, the test is inconclusive.
16
Because the critical values generated by Narayan (2004) are set for small sample size of 30 to 80 observations, they are used for the final conclusion of the test in this paper. Narayan (2004) affirms that the use of critical values in Pesaran et al. (2001) may be misleading as it was established basing on relatively large sample size of 1000 observations. In fact, Kargbo (2012) and Yin Pui Mun & Lau Sim Yee (2013) have used Narayan (2004)‗s critical values as their benchmark for the cointegration test.
27
Finally, if the bounds test leads to the conclusion of conintegration, the short-run dynamics parameters and the long-run effects can be estimated illustrating the short- and long-run impact of each determinant on economic growth. At this stage, the error correction term (ECT) which demonstrates the speed of adjustment of the function towards the long-run equilibrium is also estimated. The ECT has to be negative and significant to affirm the long-run relationship among the variables.
3.3Data sources
The data sources related to ODA are taken mainly from Foreign Economic Relation Department - Ministry of Planning and Investment (MPI) of Vietnam. Other data are collected from General Statistical Office (GSO) of Vietnam, World Development Indicators of World Bank, and Asian Development Bank. In particular, the variables and their units are listed by sources as follow:
General Statistical Office of Vietnam: GDP growth rate; GDP at current price (billion dong); GDP at constant 1994 price (billion dong); structure of population 15 years and older by education level (2006-2012); real export at constant 1994 price (billion dong); real import at constant 1994 price (billion dong).
World Development Indicators – World Bank: Investment which is represented by Gross capital formation as a share of GDP (%); labor force (person); exchange rate (%); inflation (%); government final consumption expenditure as a share of GDP (%).
Asian Development Bank: Domestic credit (1994-2011) at current price (billion dong).
28
4 RESULTS AND ANALYSIS
4.1Growth accounting analysis results (1991-2012)
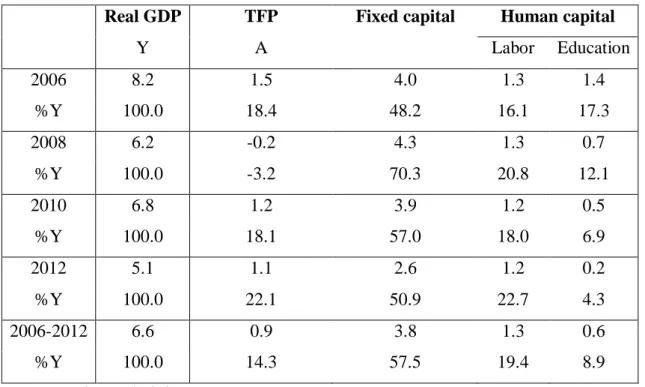
Table 4.1 and table 4.2 present the summary of growth accounting results which are demonstrated in five-year sub-period and the whole period. Table 4.1 shows the contributions of TFP, fixed capital, and labor force to economic growth, in which education adjustment is excluded from labor inputs. In table 4.2, education improvement of labor force is included, together with labor population, deriving the contribution of human capital to GDP growth. However, the results are only available over restricted period of time (2006-2012). As can be seen from the table 4.2, the quality-adjustment leads to a fall in the TFP measure. Additionally, figure 4.1 provides graphical view of the results presented in the table 4.2 in order to capture the trend of each production factor‘s contribution over the period.
Table 4. 1 Growth accounting results 1991-2012 excluding educational adjustment
Real GDP TFP Capital Labor
1991-1995 8.2 2.8 4.0 1.4 %Y 100.0 34.2 48.3 17.6 1996-2000 7.0 0.6 4.6 1.8 %Y 100.0 7.9 66.2 25.9 2001-2005 7.5 2.0 4.0 1.5 %Y 100.0 27.2 52.8 20.1 2006-2012 6.6 1.5 3.8 1.3 %Y 100.0 23.1 57.5 19.4 1991-2012 7.2 1.7 4.1 1.5 %Y 100.0 23.1 56.3 20.6
29
Table 4. 2 Growth accounting results 2006-2012 including educational adjustment
Real GDP TFP Fixed capital Human capital
Y A Labor Education 2006 8.2 1.5 4.0 1.3 1.4 %Y 100.0 18.4 48.2 16.1 17.3 2008 6.2 -0.2 4.3 1.3 0.7 %Y 100.0 -3.2 70.3 20.8 12.1 2010 6.8 1.2 3.9 1.2 0.5 %Y 100.0 18.1 57.0 18.0 6.9 2012 5.1 1.1 2.6 1.2 0.2 %Y 100.0 22.1 50.9 22.7 4.3 2006-2012 6.6 0.9 3.8 1.3 0.6 %Y 100.0 14.3 57.5 19.4 8.9
Source: Author‘s calculation
Figure 4. 1 Indices of growth accounting results 1991-2012 (1900=100)
Source: Author‘s calculation
An analysis of these results suggests three main findings. Firstly, the exercise reveals that the high level of economic growth in Vietnam has been mainly stemmed from the high growth of the fixed capital stock. During the whole period 1991-2012, fixed capital stock contributes on average 56 percent to GDP growth. Moreover, with the exception of the year 1992, fixed capital always makes the largest contribution compared to the other two production factors. The result reflects the consistently important role of physical capital in gaining high economic growth rate.
90 100 110 120 130 140 150 160 170 180 190 200 1990 1991 1992 1993 1994 1995 1996 1997 1998 1999 2000 2001 2002 2003 2004 2005 2006 2007 2008 2009 2010 2011 2012 Fixed capital TFP Labor
30
This finding also resembles what are found in many other studies such as Le Dang Doanh et al. (2002), Seila (2011), and Rahul Anand et al. (2014)17. Of those, Le Dang Doanh et al. (2002), whose research covers the period of 1980-2002, explain that physical capital has remarked increasing and large contribution to growth from the announcement of the Doi Moi.
Secondly, TFP contribution has been minor on average and experienced some fluctuations over the considered period. Particularly, TFP‘s contribution accounts for approximately 23 percent over the period 1991-2012 for the case of excluding educational improvement in human capital, and about 14.3 percent during 2006-2012 for the case of including educational factor. As can be seen from the figure 4.1, the share of TFP in GDP growth has not been stable over time. In particular, during two economic crises, the Asian crisis (1998-1999) and the global crisis (2008-2010), Vietnam‘s TFP ceased growing or even went negative at some times. Interestingly, Mustapha K. Nabli et al. (2010, p. 557) also notice this TFP trend of Vietnam but without addressing any possible reason. In fact, this phenomenon was also observed in other countries. After implementing the growth accounting analysis for the cases of China and India, Rahul Anand et al. (2014) point out that the economic slowdown of these two countries have been driven largely by the decline in trend TFP growth. They suggest one explanation that the decline in TFP may be overstated if a declining capital utilization rate is not taken into account in the contribution of physical capital accumulation. This might be the reason for the case of Vietnam. Even so, it cannot deny the fact that trend TFP growth in Vietnam appears relatively low compared to other Asian countries such as China, India18. This obviously reflects the poor technology background in Vietnam and a sort of problems that hinder the TFP growth such as low research and development, poor infrastructure, and low level of economic complexity (Rahul Anand et al., 2014).
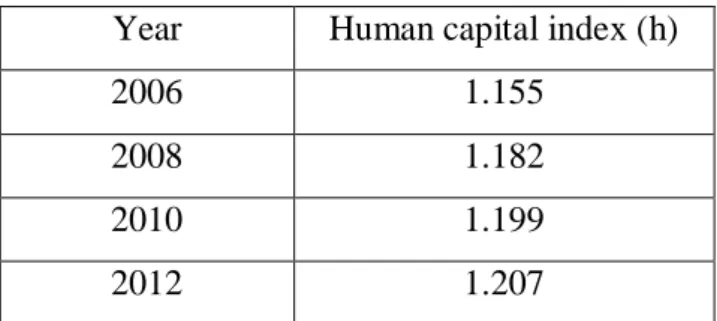
Thirdly, there has been relatively strong return of education on aggregate output. Over the period 2006-2012, educational improvement contributes about 9 percent to total economic growth (see table 4.2). Based on the method used in Hyun Hwa Son (2012), the human capital indices of Vietnam for period 2006-2012 have been calculated. The results indicate that human capital has been gradually enhanced over time (see table 4.3). Obviously, this upward trend in human capital index has stemmed from the improvement in educational attainment of labor force to the extent
17
Specifically, the contribution of fixed capital to GDP growth is estimated at 69.3 percent during 1992-1997 in Le Dang Doanh et al. (2002), 57.7 percent during 1989-2008 in Seila (2011), and more than 50 percent during 1994-2013 in Rahul Anand et al. (2014).
18
According to Rahul Anand et al. (2014), during the period 1994-2013, TPF contribution to GDP growth accounts for about 35 and 40 percent in India and China, respectively.
31
that more workers have obtained higher educational qualification. Indeed, in 1993, 36 percent of economically active working population had no educational qualification and only 6.8 percent obtained vocational and tertiary education; but by 2012, the former has dropped by 19 percent and the latter has grown to 16 percent (VHLSS). Thus, it can be concluded that investment aimed at expanding access and improving quality of educational service provision to the whole population, in general, and to labor force, in particular, provides critical foundation to economic growth.
Table 4. 3 Vietnam human capital index 2006-2012
Year Human capital index (h)
2006 1.155
2008 1.182
2010 1.199
2012 1.207
Source: Author‘s calculation
To sum, the findings of growth accounting exercise give a robust basis to further explore the contribution of external assistance. It is the fact that foreign assistance has effect on economic growth through affecting the production factors. For example, large and rising ODA inflow to Vietnam since 1993 may exert positive impacts on economic achievement through increasingly accumulating the fixed capital or supporting the development of human capital and technology. Based on the exercise‘s findings, further analyses regarding the channels through which foreign aid affects GDP growth and the levels of those effects will be discussed in the chapter 5 and 6 of this research.
4.2Empirical results
Table 4.4 represents the results of the ADF and KPSS integration test for the variables used across the model. Since the ADF and KPSS tests give conflicting results, the variables may have mixed order of integration containing both I(0) and I(1). The nonexistence of I(2) among variables allows us to conduct the ARDL approach to cointegration.