Procedia Economics and Finance 30 ( 2015 ) 680 – 689
2212-5671 © 2015 The Authors. Published by Elsevier B.V. This is an open access article under the CC BY-NC-ND license (http://creativecommons.org/licenses/by-nc-nd/4.0/).
Peer-review under responsibility of IISES-International Institute for Social and Economics Sciences. doi: 10.1016/S2212-5671(15)01317-9
ScienceDirect
3rd Economics & Finance Conference, Rome, Italy, April 14-17, 2015 and 4th Economics &
Finance Conference, London, UK, August 25-28, 2015
Venture Capital, Private Equity and Foreign Direct Investment:
Case Study of the Czech Republic
Ondrej Ptacek
a, Bozena Kaderabkova
a, Marian Piecha
aa University of Economics, W. Churchilla Sq. 4, Prague 3, Czech republic
Abstract
The paper analyses influence of venture capital (VC) and private equity (PE) investing on FDI inflow in the Czech Republic. There exist barriers in the Czech Republic, such as high investment thresholds, imperfect information or legislative barriers that negatively affect the PE and VC investment activity and prevent foreign investors from investing in Czech PE and VC. This is the main reason
RIWKH&]HFK5HSXEOLF¶VOLWWOH3(DQG9&PDUNHW DFWLYLW\'DWDRQIRUHLJQGLUHFWLQYHVWPHQW)',LQ3(DQG9&LVGLVWRUWHG
though, as main foreign investors are investment funds with Czech managers who invest through vehicles established outside the EU for tax reasons. The solution that would contribute to dismantling the barriers of FDI inflow in PE and VC would be to create more favourable conditions for investing in the Czech Republic. If the Czech Republic pursues reaching the European average as benchmark, it has to fill-in a yearly gap in PE and VC investment of 0.077% GDP, or EUR 113.2 million, according to 2007-2013 average figures.
5 The Authors. Published by Elsevier B.V.
Peer-review under responsibility of IISES-International Institute for Social and Economics Sciences.
Keywords: venture capital; asset management; private equity; financial markets; market failure; government failure
1.Introduction
This paper aims at description of relation between foreign direct investment and private equity and venture capital on case study of the Czech Republic.
Theoretical background focuses on the decision-making principles and definitions connected with venture capital and private equity investing. Results describe the main features of the Czech private equity and venture capital market in relation to the European benchmark. Then, the influence of venture capital and private equity investing on foreign direct investment is analysed.
© 2015 The Authors. Published by Elsevier B.V. This is an open access article under the CC BY-NC-ND license (http://creativecommons.org/licenses/by-nc-nd/4.0/).
2.Theoretical background of venture capital and private equity
Despite its relative importance in terms of ability to help start-ups develop in multinational companies and specific differences from other sources of capital, there is still insufficient background of theoretical economics in the field of venture capital. Despite there have been many attempts to describe the processes of venture capital, the terminology is still not unified.
The researched literature always considers Venture Capital as an asset class, mainly as a subset of Private Equity*.
But, sometimes is Venture Capital perceived also as a synonym to Private Equity. Generally, the literature shows that there exist at least two stages of venture capital ± early stage investments in start-up businesses and later stage investments in developing companies.
Private equity means generally investing capital in unquoted businesses, unlisted on public markets. However
private equity refers to the source of equity funds being on private markets, private equity may be used to invest also in listed shares, including to take over publicly listed companies, and delist them.Á
The term Risk Capital is often used as homonym to Venture Capital, but not always. For instance, Merton and PeUROGGHILQHULVNFDSLWDODV³WKHVPDOOHVWDPRXQWWKDWFDQEHLQYHVWHGWRLQVXUHWKHYDOXHRIWKHILUPVQHWDVVHWV
against a loss in value relative to the risk-IUHHLQYHVWPHQWRIWKRVHQHWDVVHWV´S7KLVGHILQLWLRQLVYHU\GLIIHUHQW
and is related to risk management in financial institutions.
Typical is investment in shares of newly established businesses with high-growth potential (start-ups, start-up firms), often commercialising an innovation, but also with high risk of default. Risk-aversed rational investors would invest under these conditions if the investment promises high yields in future by exit. Private equity investors, mostly
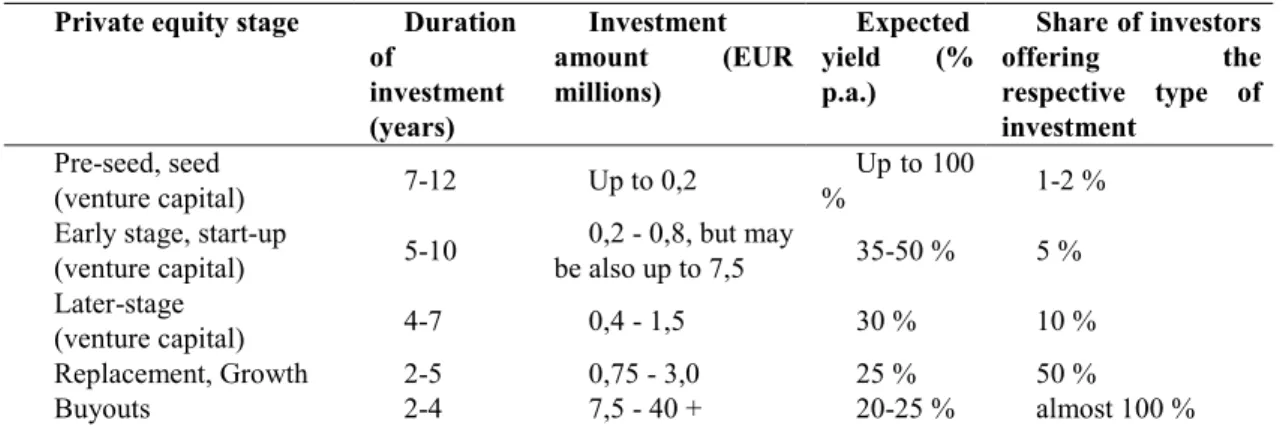
institutional, typically do not acquire businesses to realise take-overs, as strategic investors mostly do, but invest as financial investors and realise yields not in the form of regular dividends, but by exiting the investment in a period of usually 3-6 years. The stages with typical investment durations and investment amounts are depicted in Table 1.
Table 1: Private equity stages
Private equity stage Duration of investment (years) Investment amount (EUR millions) Expected yield (% p.a.) Share of investors offering the respective type of investment Pre-seed, seed (venture capital) 7-12 Up to 0,2 Up to 100 % 1-2 %
Early stage, start-up
(venture capital) 5-10 0,2 - 0,8, but may be also up to 7,5 35-50 % 5 % Later-stage (venture capital) 4-7 0,4 - 1,5 30 % 10 % Replacement, Growth 2-5 0,75 - 3,0 25 % 50 % Buyouts 2-4 7,5 - 40 + 20-25 % almost 100 %
Source: DvoĜák, Procházka (1998)
We will operate with terminology brought up by the European Private Equity and Venture Capital Association (EVCA), as the paper is oriented mainly on European venture capital markets and EVCA is the most important association in this field on the old continent. Another important player in this field in Europe is the European Commission, which has presented its own definitions in the EC (2006). The Commission definitions for the purpose
* EVCA (2007) EVCA (2007) Á IMF (2009)
of state aid rules have to be taken into account particularly when public capital is invested beside private sources or other advantage (such as tax reliefs or guarantees) is provided to private venture capital investors in the EU.
Due to EVCA, venture capital has two stages ± early stage and later-stage. EVCA (2007) distinguishes venture
FDSLWDODV ³DVXEVHWRI3(UHIHUVWRHTXLW\LQYHVWPHQWV PDGHIRUWKHODXQFKHDUO\GHYHORSPHQWRUH[SDQVLRQRID EXVLQHVV´S+RZHYHUWKHJURZWKVHJPHQWLVQRWLQFOXGHGDV(9&$UHIHUVWRH[SDQVLRQRI³UHODWLYHO\ PDWXUHRUGHYHORSHGFRPSDQLHV´S%XWWRPDNHLWHYHQPRUHFRPSOLFDWHG³DGGLWLRQDOO\PRVWLQYHVWPHQWVPDGH E\EX\RXWIXQGVLQWRYHQWXUHVWDJHVZRXOGEHGHILQHGDVJURZWKFDSLWDO´S7KLVH[DPSOHVKRZVKow challenging it is to distinguish individual stages of PE/VC in practice.
We should focus on the main indicators of venture capital market activity derived from the stages of common venture capital transaction pipeline to select the right ones for the purpose of equity gap calculation. This pipeline is defined e.g. in Wright and Robbie (2003) as firm level of venture capital including deal generation, initial and second screening, valuation and due diligence, deal approval and structuring, post-contractual monitoring, investment
UHDOLVDWLRQDQGHQWUHSUHQHXUV¶H[LWDQGUHFRQWUDFWLQJZLWKYHQWXUHFDSLWDOLVWVIROORZHGE\DUHYLHZRIWKHHYLGHQFHRQ
the performance of venture capital firms.
These processes are commonly aggregated into three main market activity indicator groups: fundraising activity, investment activity and divestment activity. We will work mainly with fundraising and investment amounts in monetary terms per period of time.
3.Empirical evidence: venture capital and private equity development in the Czech Republic in compare to Europe
The investment activity in private equity (PE) and venture capital (VC) in the Czech Republic was observing an upward trend in 2007-2009, decreasing in 2010-2012 with recovery in 2013.**
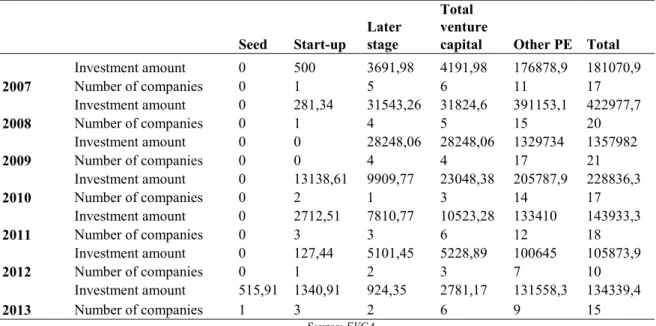
As the overall number of investment is very limited and varies between 10 to 20 in the whole private equity industry, the investment activity is influenced by appearance or non-appearance of several larger investments, as depicted below in Table 3. The seed stage investments are almost missing, the first one since 2007 has been made in 2013 amounting only at EUR 515 000. Start-up capital has been struggling with almost absence of new investments over the whole period with EUR 18 millions invested over 2007-2013 (but more than EUR 13 million, or 72%, within a single year in 2010). However, in seed and start-up stages, there are existing investments out of official statistics as business angles operate in this field in the Czech Republic almost without being organized in syndicates or networks. Later stage venture capital was developing quite hopefully until 2010 with 4 to 5 new investments in a year. Since then, its investment activity has been diminishing to only 3% of 2009 values in 2013.
Overall venture capital investment activity including seed, start-up (together marked as early stage) ad later stage investments was very weak and became almost invisible in 2012-2013. Other private equity investments form almost 96% of all PE and VC investments in the Czech Republic over the period of 2007-2013. Most capital has been invested in buyouts (64% of total PE and VC investment) and growth capital (20%). Rescue, turnaround and replacement capital are rather rare. However no permanent or systematic changes in the sensitivity to market returns in relation to risk premiums have been generally detected in the Czech financial market after financial crisis, the private equity
fundraising activity indicators (including venture capital) show less willingness to allocate capital to private equity and venture capital funds from investors.
** CVCA (2013), EVCA (2011), EVCA (2012), EVCA (2013) and EVCA (2014).
Table 2: Investment amounts and number of invested companies in the Czech Republic, by private equity and venture capital stage, 2007-2013, EUR thousands Seed Start-up Later stage Total venture
capital Other PE Total 2007 Investment amount 0 500 3691,98 4191,98 176878,9 181070,9 Number of companies 0 1 5 6 11 17 2008 Investment amount 0 281,34 31543,26 31824,6 391153,1 422977,7 Number of companies 0 1 4 5 15 20 2009 Investment amount 0 0 28248,06 28248,06 1329734 1357982 Number of companies 0 0 4 4 17 21 2010 Investment amount 0 13138,61 9909,77 23048,38 205787,9 228836,3 Number of companies 0 2 1 3 14 17 2011 Investment amount 0 2712,51 7810,77 10523,28 133410 143933,3 Number of companies 0 3 3 6 12 18 2012 Investment amount 0 127,44 5101,45 5228,89 100645 105873,9 Number of companies 0 1 2 3 7 10 2013 Investment amount 515,91 1340,91 924,35 2781,17 131558,3 134339,4 Number of companies 1 3 2 6 9 15 Source: EVCA
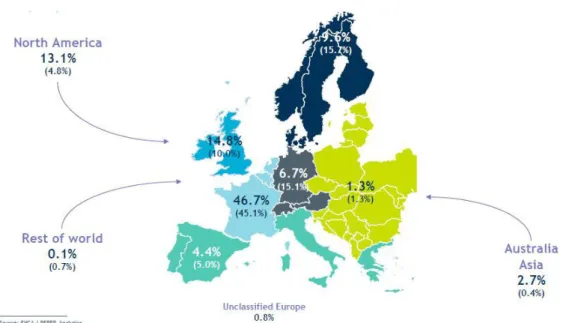
This is not only the case of the Czech Republic. As we can see from the Chart 3, the whole Central and Eastern European region had only 1,3% share on total fundraising in PE and VC funds in Europe in 2013. The strongest region was France and Benelux (incluGLQJWKH(8³LQYHVWPHQWKHDYHQ´RI/X[HPERXUJIROORZHGE\WKH8QLWHG.LQJGRP
Nordic states and German speaking countries.
If we compare data on PE and VC investment activity in the Czech Republic with total European figures over the period of 2007-2013 as in Table 4, we find out that besides the overall weak performance of the market in the Czech Republic, there are also differences in particular categories. A clear investment gap can be observed in seed stage and start-up stages, with almost no activity in the Czech Republic (0,72% share on total investment amount, 10,4% share on number of companies) but quite strong activity in Europe (4,91% and 42,29%). Significant difference is especially in the share on number of companies ± whereas more companies in Europe received venture capital (62,42%) than other private equity investments (37,58%), the Czech figures showed results vice versa: only 28,95% of companies received venture capital and 71,05% obtained other PE investment.
Fit. 1. Venture Capital in Europe, fundraising geographic breakdown 2013 (2012 in parentheses), source of funds in % of total amount
Source: EVCA, PEREP analytics
Table 3: Investment amounts and number of invested companies in PE segments, Czech Republic and Europe, 2007-2013 totals
Czech Republic Total Europe
Total investment % of total investmen t No. of invested companie s % of invested companie s Total investment % of total No. of invested companie s % of invested companie s Seed 516 0.02% 1 0.88% 1 130 734 0.37% 2 954 8.31% Start-up 18 101 0.70% 11 9.65% 13 923 586 4.54% 12 071 33.97% Subtotal Early stage 18 617 0.72% 12 10.53% 15 054 320 4.91% 15 025 42.29% Later-stage venture capital 87 230 3.39% 21 18.42% 15 034 187 4.90% 7 712 21.70% Total venture capital 105 846 4.11% 33 28.95% 30 088 507 9.81% 22 180 62.42% Other PE (Growth, Buyouts etc.) 2 469 168 95.89% 81 71.05% 276 693 907 90.19% 13 352 37.58% Total 2 575 014 100.00% 114 100.00% 306 782 413 100.00 % 35 532 100.00%
The cause of this situation is clear: Czech VC funds invest in larger projects than in the rest of Europe. Whereas average investment amount per company was EUR 1.3 million in Europe, it was EUR 3.2 million in the Czech Republic, 2.3 times higher.
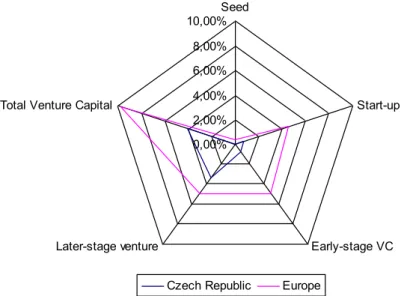
However, due to lack of market activity, the share of venture capital funding on GDP in the Czech Republic is significantly lower than in Europe. The following Chart 5 depicts investment value by venture capital stage to GDP ratio in the Czech Republic and European countries.
Fig. 2. Venture capital investments to GDP (current prices, EUR) percentage ratio ratio by stage, Czech Republic and Europe, 2007-2013 totals
Source: Own adjustment of EVCA and Eurostat data
In general terms, early stage enterprises receive only a little venture capital in the Czech Republic. The legislation does not encourage PE investors enough to enter the venture capital market as well. This is particularly evident from the data on PE and VC funds investing in the Czech Republic (full CVCA members). Only a few of them are oriented on early stage investments and only one fund with total sources of only EUR 20 million prefers also investments under EUR 1 million. The total amount of funds managed in the Czech Republic is about EUR 4.5 billion and the average fund size is EUR 373 million. On average, the minimum deal size is EUR 6.5 million and maximum EUR 50 million. Thus, seed, start-up and even smaller later-stage venture projects cannot fulfil the threshold of minimum investment values required by VC funds investing in the Czech Republic.ÁÁ This creates a burden for companies seeking equity
financing of lesser values creating possible market inefficiency.
)XUWKHUPRUHEXVLQHVVDQJHOV¶QHWZRUNVGRQRWDGHTXDWHO\WDNHWKHSODFHRIODFNLQJHDUO\VWDJHYHQWXUHFDSLWDOIXQGV
due to CVCA findings. Ventures already having research and development results must still seek funds for their
commercialization among friends and family or rely on bank loans and grants.
The reluctance towards capital-based instruments may stem from the pursuit of a high level of autonomy by the businesses. Both entrepreneurial candidates and representatives of companies in further phases of development indicated the need for independence as one of the main reasons for starting or having started their businesses according
ÁÁ CVCA (2010)
See EVCA (2011) and EVCA (2012).
0,00% 2,00% 4,00% 6,00% 8,00% 10,00%Seed Start-up Early-stage VC Later-stage venture
Total Venture Capital
to a survey in Poland.*** Businesses also stress the lack of the competences of financial institutions and simplistic, XQGHUGHYHORSHG DQG LQDSSURSULDWH DSSURDFK WR QHZ EXVLQHVV YHQWXUHV¶ DVVHVVPHQW LQ FHUWDLQ NQRZOHGJH LQWHQVLYH
industries, such as biotechnology.
4.Results: FDI inflow in venture capital and private equity in the Czech Republic
Within our case study, we will now concentrate on current state of foreign direct investment (FDI) in venture capital and private equity in the Czech Republic.
The EVCA statistics distinguish between market and industry data. The market statistics are related to a particular country, regardless of the origin or location of private equity fund managers. On the contrary, industry statistics uses data by country of origin of fund managers.ÁÁÁ Whereas in the previous chapter, we were working with market statistics
on private equity and venture capital activity in the Czech Republic, we will now deploy also industry statistics to bring about relevant findings on venture capital and private equity investment activity in relation to FDI inflow in the Czech Republic.
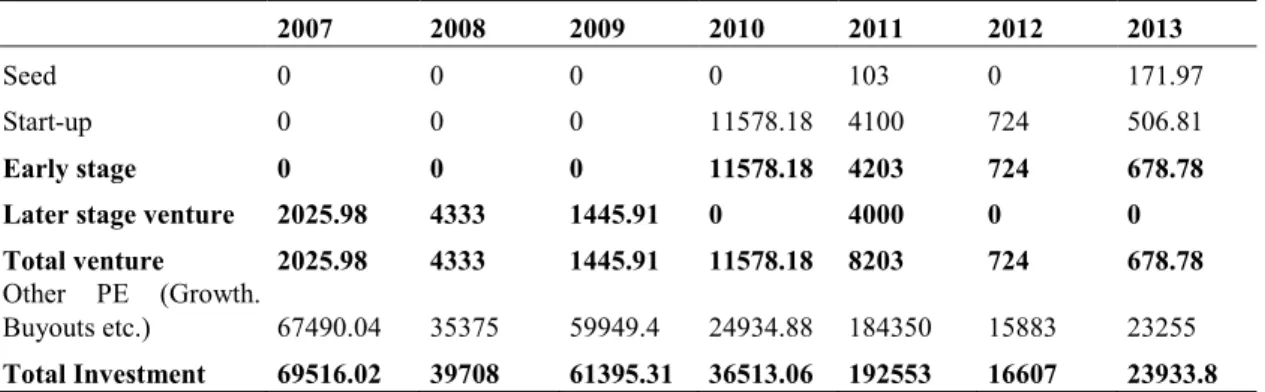
Table 6 depicts amounts invested by VC and PE funds with Czech based management companies (VC and PE firms) over 2007-2013. This data is significantly different from market data on Czech companies receiving PE and VC investments, as described in the previous chapter.
Table 4: Venture capital and private equity investments in the Czech Republic, industry statistics (by country of origin of the venture capital/private equity firm), EUR thousands, 2007-2013
2007 2008 2009 2010 2011 2012 2013
Seed 0 0 0 0 103 0 171.97
Start-up 0 0 0 11578.18 4100 724 506.81
Early stage 0 0 0 11578.18 4203 724 678.78
Later stage venture 2025.98 4333 1445.91 0 4000 0 0
Total venture 2025.98 4333 1445.91 11578.18 8203 724 678.78
Other PE (Growth.
Buyouts etc.) 67490.04 35375 59949.4 24934.88 184350 15883 23255
Total Investment 69516.02 39708 61395.31 36513.06 192553 16607 23933.8
Source: Own adjustment of EVCA data
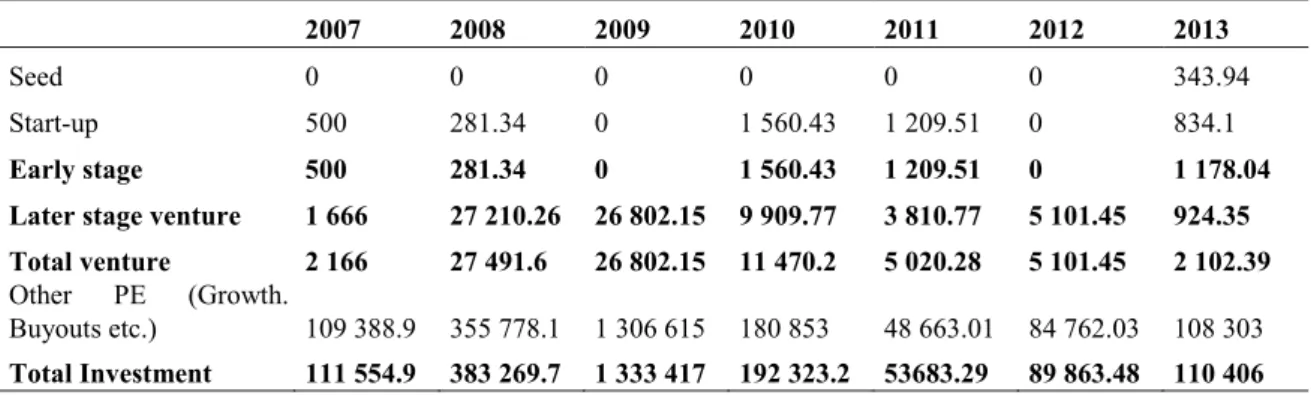
When we deduct this industry statistics data from the market statistics and alo take into account investments of Czech VC and PE funds on abroad (EVCA data available), we will find foreign direct investment in PE and VC estimates. PE and VC investments are included in direct investment according to IMF (2009) methodology on Balance of Payments.
Table 7 shows the results ± we find out that although we identified overall market activity in PE and VC in the Czech Republic as relatively poor in compare to the rest of Europe, it is able to attract significant amounts of foreign investment, EUR 325 million on average over the period of 2007-2013. Even if we counted out 2009 as an outlier with one mega buyout investment, FDI investment amount would be still EUR 134 million yearly on average. Of these foreign direct investment amounts, 95.1% are buyout operations.
*** Matejun (2013) Martin (2013) ÁÁÁ EVCA (2014)
Table 5: Venture capital and private equity foreign direct investments in the Czech Republic estimates, EUR thousands, 2007-2013
2007 2008 2009 2010 2011 2012 2013
Seed 0 0 0 0 0 0 343.94
Start-up 500 281.34 0 1 560.43 1 209.51 0 834.1
Early stage 500 281.34 0 1 560.43 1 209.51 0 1 178.04
Later stage venture 1 666 27 210.26 26 802.15 9 909.77 3 810.77 5 101.45 924.35
Total venture 2 166 27 491.6 26 802.15 11 470.2 5 020.28 5 101.45 2 102.39
Other PE (Growth.
Buyouts etc.) 109 388.9 355 778.1 1 306 615 180 853 48 663.01 84 762.03 108 303
Total Investment 111 554.9 383 269.7 1 333 417 192 323.2 53683.29 89 863.48 110 406 Source: Own adjustment of EVCA data
We are now able to determine the share of FDI on PE and VC investment in the Czech Republic. As depicted in Table 8, this share varies between the years and PE and VC stages in 2007-2013 EVCA and Czech National Bank figures. In some years and market segments, FDI represent 100% of investment. Overall, the share of FDI investment on total PE and VC investment has been ranging from 37.3% in 2011 to 98.3% in 2009. In venture capital, it has been varying from 47.7% in 2011 to 97.6% in 2012. This is mainly caused by the fact that the overall number of companies receiving PE or VC investment is limited to 10-20 per year as argued already in this paper, so one or two investments may bring about significant difference in data on year-on-year basis.
Table 6: Share of FDI on private equity and venture capital investment in the Czech Republic by stage, 2007-2013
2007 2008 2009 2010 2011 2012 2013 Average Seed - - - 66.7% 66.7% Start-up 100.0% 100.0% - 11.9% 44.6% 0.0% 62.2% 53.1% Early stage 100.0% 100.0% - 11.9% 44.6% 0.0% 63.4% 53.3% Later stage VC 45.1% 86.3% 94.9% 100.0% 48.8% 100.0% 100.0% 82.2% Total venture 51.7% 86.4% 94.9% 49.8% 47.7% 97.6% 75.6% 71.9% Other PE (Growth. Buyouts etc.) 61.8% 91.0% 98.3% 87.9% 36.5% 84.2% 82.3% 77.4% Total investment 61.6% 90.6% 98.2% 84.0% 37.3% 84.9% 82.2% 77.0%
Source: Own adjustment of EVCA data
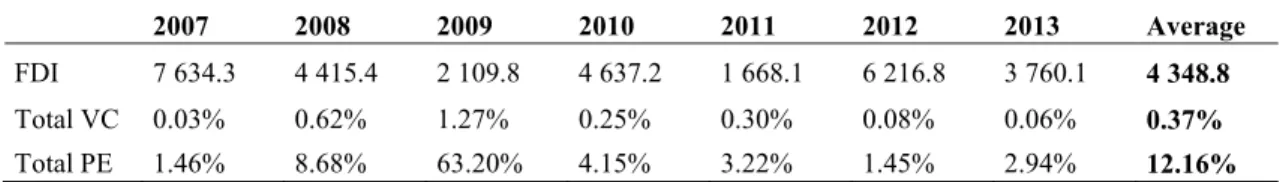
Finally, we present data on private equity and venture capital investment share on total FDI in the Czech Republic over the period 2007-2013 in table 9. As we found out earlier in this paper that venture capital activity is very limited in the Czech Republic, it is not surprising that the share of venture capital investment on foreign direct investment is only 0.37% on average. On the other hand, it means that the gap in venture capital investments mainly in compare to Anglo-Saxon, but also in compare to closer German-speaking countries of Europe could be quite easily filled with new FDI or mobilisation of domestic sources for investment. Country Risk Agencies have credibility in the market and capture the impact of relevant macroeconomic variables properly, resulting in a distribution of FDI in relation to recognized competitiveness of economies seeking more profitable investments.
Private equity is much more significant with 12.16%, but this data is distorted with 2009 outlier. If we skip 2009 in the time series, we will get a new average share of PE investment on FDI value of 3.65%.
Table 7: FDI in the Czech Republic in EUR millions and percentage share of FDI in private equity and venture capital estimates, 2007-2013
2007 2008 2009 2010 2011 2012 2013 Average
FDI 7 634.3 4 415.4 2 109.8 4 637.2 1 668.1 6 216.8 3 760.1 4 348.8
Total VC 0.03% 0.62% 1.27% 0.25% 0.30% 0.08% 0.06% 0.37%
Total PE 1.46% 8.68% 63.20% 4.15% 3.22% 1.45% 2.94% 12.16% Source: Own adjustment of EVCA and Czech National Bank data
One of the main reasons is that given the evidence in the previous chapters, the Czech PE market is not able to allocate resources effectively mainly due to:
x Risk aversion on the supply side leading to high minimum investment threshold;
x Imperfect information on the demand side.****
The investment criteria applied by the VC funds operating in the Czech Republic actually exclude investments in the seed and start up stages of SME development.Even investments through the later stage are limited given the
minimum investment size of ca. EUR 1 million for most funds. Consequently, the majority of realized transactions are management buyouts or buy-ins and replacement or secondary purchase transactions.
There also occurs imperfect information on the demand side, as the entrepreneurs are lacking practical knowledge on PE and VC (including its indirect positive effects on business) and are usually not willing to share equity with external investors.ÁÁÁÁ
Another reason lies in legal barriers of establishing PE and VC funds within the Czech Republic. The PE and VC funds operate in the Czech Republic mainly from off-shore destinations. Off-shoring has been very much used to lower the operating costs of enterprises or for tax optimisation purposes, which is the case.
As regards PE and VC investments, the FDI could flow in the Czech Republic mainly through foreign funds of funds managing capital from pension funds and other investors. Corporate foreign direct investors could then extend the possibilities of exits, using network enterprising or creating alliances and acquisitions as modern forms of business integration.***** Promotion of venture capital by appropriate government action, as well as measures for deepening of
financial markets and increase of financial discipline, would enrich supply of equity capital. 5.Conclusion
There exist barriers in the Czech Republic, such as high investment thresholds, imperfect information or legislative barriers that negatively affect the PE and VC investment activity and prevent foreign investors from investing in Czech PE and VC.
7KLV LV WKH PDLQ UHDVRQ RI WKH &]HFK 5HSXEOLF¶V OLWWOH 3( DQG 9& PDUNHW DFWLYLW\ ZKLFK LV OLPLWHG WR -20 investments per year in total. FDI takes 77% share on total PE and VC investment in the Czech Republic over 2007-2013. Data on FDI in PE and VC is distorted, though, as main foreign investors are investment funds with Czech managers who invest through vehicles established outside the EU for tax reasons. The solution that would contribute to dismantling the barriers of FDI inflow in PE and VC would be to create more favourable conditions for investing in the Czech Republic.
****3WiþHN )RULQVWDQFHGXHWRKLJKHUH[SHFWHG,55HWF=LQHFNHU5DMFKORYi ÁÁÁÁ=LQHFNHU5DMFKORYi 9LODPRYi-DQRYVNi.R]HO9R]ĖiNRYi *****9LODPRYi-DQRYVNi.R]HO9R]ĖiNRYiâYHFRYi 9LGXþLü9LGXþLü%RUDVâXãDN
If the Czech Republic pursues reaching the European average as benchmark, it has to fill-in a yearly gap in PE and VC investment of 0.077% GDP, or EUR 113.2 million, according to 2007-2013 average figures.
The paper has identified the influence of venture capital and private equity investing on FDI inflow in the Czech Republic.
Acknowledgements
This paper was created within the project ³Factors of poverty and its social and political consequences of economic and policy recommendations´. Project registration number 9â(,*6).
References
CVCA (2010). The Czech Republic 2009. Retrieved from http://www.cvca.cz.
CVCA (2013). Czech Private Equity & Venture Capital Association 2012 Activity Report. Retrieved from http://www.cvca.cz/.
'YRĜiN,3URFKi]ND35L]LNRYêDUR]YRMRYêNDSLWiO9HQWXUH&DSLWDO3UDJXH0DQDJHPHQW3UHVV
EC (2006). Community Guidelines on State aid to promote risk capital investments in small and medium-sized enterprises. Official Journal of the European Union, 18 August 2006, C 194, p. 2-21.
EVCA (2007). Guide on Private Equity and Venture Capital for Enterpreneurs. Retrieved from http://www.evca.eu.
EVCA (2011). Central and Eastern Europe Statistics 2010. An EVCA Special Paper edited by the EVCA Central and Eastern Europe Task Force. Retrieved from http://www.evca.eu.
EVCA (2013). Central and Eastern Europe Statistics 2012. An EVCA Special Paper edited by the EVCA Central and Eastern Europe Task Force. Retrieved from http://www.evca.eu.
EVCA (2014). Central and Eastern Europe Statistics 2013. An EVCA Special Paper edited by the EVCA Central and Eastern Europe Task Force. Retrieved from http://www.evca.eu.
EVCA (2014). 2013 European Private Equity Activity. Statistics on Fundraising, Investments & Divestments. Retrieved from http://www.evca.eu. International Monetary Fund (2009). Balance of Payments and International Investment Position Manual. Sixth Edition (BPM6). Washington D.C.:
International Monetary Fund.
Martin M. (2013). The Barriers to Growth of Biotechnology Companies in Emerging Economies. Regional Case Study Analysis. In: International Journal of Economic Sciences, Vol. II (No. 1), p. 21-39.
Matejun M. (2013). Instruments Supporting Development in the Life Cycle of Small and Medium-Sized Enterprises. In: International Journal of Economic Sciences, Vol. II (No. 1), p. 40-60.
Merton R. C., Perold A. (1993) Theory of Risk Capital in Financial Firms. Journal of Applied Corporate Finance No. 6/1993, p. 16-36.
Popa S. (2012). The influence of the country risk rating on the foreign direct investment inflows in Romania. In: International Journal of Economic Sciences, Vol. I (No. 2), p. 93-116.
3RãWD97LPH-Varying Risk Premium in the Czech Capital Market: Did the Market Experience a Structural Shock in 2008±2009? Finance
D~YČU1RS-470.
3WiþHN2(TXLW\*DSRQWKH9HQWXUH&DSLWDO0DUNHWLQWKH&]HFK5HSXEOLF,QWHUQDWLRQDO-RXUQDORI%XVLQHVVDQG0DQDJement. Vol. II (No. 1), p. 59-75.
9LGXþLü/9LGXþLü9%RUDV'âXãDN760(VEXVLQHVVHQYLURQPHQW7KHFDVHRI&URDWLD,QWHUQDWLRQDO-RXUQDORI(FRQRPLF6FLHQFHs Vol. II (No.3), p. 152-165.
9LODPRYiâ-DQRYVNi..R]HO59R]ĖiNRYi,6HOHFWHG6SHFLILF$VSHFWVRI0DUNHWLQJ$QDlyses and Management in the Conditions of Metallurgy Firms. 20th Anniversary International Conference on Metallurgy and Materials METAL 2011, p. 1279-1285.
9LODPRYiâ-DQRYVNi..R]HO59R]ĖiNRYi,âYHFRYi(1HZ7UHQGVLQWKH0DQDJHPHQWZLthin the Metallurgy Firms. International Conference on Metallurgy and Materials METAL 2012, p. 1897-1903.
Wright M., Robbie K. (1998). Venture Capital and Private Equity: A Review and Synthesis. Journal of Business Finance & Accounting No. 25/1998, p. 521±570.
=LQHFNHU 0 5DMFKORYi - 3ULYDWH HTXLW\ DQG YHQWXUH FDSLWDOLVWV LQYHVWPHQW FULWHULD LQ WKH &]HFK 5HSXEOLF %UQR $FWa Universitatis Agriculturae et Silviculturae Mendelianae Brunensis, No. 6/2010, p. 26-38.