Using Wearable Sensors for Human Activity
Recognition in Logistics: A Comparison of Different
Feature Sets and Machine Learning Algorithms
Abbas Shah Syed
1University of Louisville, USA
Zafi Sherhan Syed
2Mehran University, Pakistan
Muhammad Shehram Shah
3RMIT University, Australia
Salahuddin Saddar
4Mehran University, Pakistan
Abstract—The topic of human activity recognition has gained a lot of attention due to its usage for exercise monitoring, smart health and assisted living. Even though the aforementioned domains have received significant interest by researchers, activity recognition for industrial settings has received little attention in comparison. Industry 4.0 involves the assimilation of industrial workers with robots and other equipment used in the industry and necessitates the development of recognition methodologies for activities being performed in industries. In this regard, this paper presents a comparison in performance of various time/frequency domain features and popular machine learning algorithms for use in activity recognition in a logistics scenario. Experiments were conducted on inertial measurement sensor data from the recently released LARa dataset which involved three feature sets being used with four machine learning algorithms; Support Vector Machines, Decision Trees, Random Forests and Extreme Gradient Boost (XGBoost). The best result achieved in the experiments was an average accuracy of 78.61% using the XGBoost classifier while using both time and frequency domain features. This work serves as a baseline for activity recognition in logistics using IMU sensors and enables the development of solutions to support fulfillment of Industry 4.0 goals.
Keywords—Human Activity Recognition (HAR); inertial sen-sors; LARa dataset; smart industry
I. INTRODUCTION
Human activity recognition (HAR) has been a very pop-ular application target for the development of mobile smart devices as it brings healthcare to the home. HAR involves the determination of activities that a person performs in their daily life such as walking, standing, sitting, jogging, etc. Wearable sensors such as accelerometers, gyroscopes, magnetometers can be worn on the body and collect movement data on a person while they are performing activities. Although, there are various modalities that can be used for activity recognition, such as videos [1] or using environmental sensors (for e.g. pyroelectric infrared sensors [2]), wearable sensors provide the benefit of being nonrestrictive to movement, are cost effective and easy to ‘carry’, thereby making them suitable for use in human activity recognition tasks.
While human activity recognition has attracted wide in-terest in the domains of smart health, ambient assisted living and more [3], the area of activity recognition in an industrial setting has received much less attention. This, even after the fact that the Industry 4.0 vision involves workers in a factory to be equipped with sensors and other smart devices
to work fully integrated with robots and other devices [4]. It is therefore necessary to develop algorithms that are able to perform activity recognition in such an environment that allows seamless integration of workers with machines in the industry and also facilitate optimization of processes and protocols. Moreover, from a health perspective, activity recognition might help in pointing to work related injuries or avoiding them altogether if sensor signatures are not as expected.
This paper investigates the performance of four machine learning algorithms, Support Vector Machines (SVM), Deci-sion Trees (DT), Random Forests (RF) and Extreme Gradient Boost (XGBoost) for the use of activity recognition in logistics using inertial sensors. Different time and frequency domain features are used in this work which have been utilized for ac-tivity recognition previously and their performance is discussed on the recently published LARa dataset [5]. It was found that XGBoost performs the best among the chosen algorithms using both time and frequency domain features. The paper is organized as follows, section II provides a disussion of the literature for activity recognition in the industry, section III provides an introduction to the dataset, section IV elucidates on the methodology used in this work, the way the experiments have been set up, section V provides a discussion of the results obtained for the experiments while a conclusion is presented in section VI and future work is discussed in section VII.
II. LITERATUREREVIEW
One of the early works for activity recognition in the industry was carried out by Ward. et al. in [6] who use a combination of microphones and an accelerometer to iden-tify different activities performed in assembly tasks in wood shops as a component for augmented reality/computer guided assembly jobs. Data is collected from subjects performing the activities with two microphones attached to them, one on the wrist and the other on the upper arm. The accelerometer is also placed on the wrist. Data from the microphones and accelerometer is segmented and they individually vote for the activity being performed. For classification on the microphone side, the authors compute the FFT, then use Linear Discrim-inant Analysis for dimensionality reduction followed by the computation of euclidean distance to samples in a training set for determining the current activity. For the accelerometer, they make use of Hidden Markov models to predict the activity being performed. Activity recognition for construction was presented in [7] who use data from five Inertial Measurement
Units (IMUs) placed on a worker (thigh, back of head, calf, upper arm and chest) to identify activities being performed on a construction site targeting increased productivity and reduced risk of injury. To do this, they compute various time and frequency domain features on the accelerometer and gyroscope measurements from the IMUs and after performing feature selection, compare three different ML algorithms, SVM, KNN and C4.5 decision trees for classification. They find that SVM performed the best from the models considered. The authors in [8] target behavioral modeling for assembly line workers using accelerometer data to enable task performance analysis as well as development of computer guided task instruction systems. An accelerometer is placed on a workers wrist and a two step recognition process is used, first windowed data is classified using a KNN classifier which is then passed to a state machine to identify completed tasks from the activity sequences.
In [9], human activity recognition has been performed using convolutional neural networks (CNN) on accelerometer data from the Skoda dataset[10]. Their network consists of one convolutional and pooling layer for each accelerometer signal axis followed by two fully connected layers and a softmax layer for classification. They are able to achieve an accuracy of 88.19% using their CNN. Targeting process optimization, the authors in [11] present a dataset which consists of triaxial accelerometer, gyroscope and magnetometer data from three IMU sensors of subjects performing activities in a picking process. One IMU is placed on the upper chest while the other two are placed on the right and the left wrist respectively. The authors also use this data to perform classification between activities using statistical features and three different ML algorithms, SVM, Naive Bayes and Random Forest from which Random Forest performed the best. In [12], the authors use a convolutional neural network on inertial measurement sensor data on the dataset in [11] to enable optimization in regard to Industry 4.0. Due to class imbalance, the authors use data augmentation and then pass the IMU data for each activity to a CNN with four convolutional layers, two pooling layers, one fully connected layer and a softmax layer for classification. They compare the performance of their CNN with a baseline determined using statistical features and three ML algorithms, SVM, Naive Bayes and Random Forests. The CNN outper-forms the other methods by achieving an accuracy of 73.9% as the best result. Another approach which employs deep learning for human activity recognition in an industrial context is proposed in [4] who use CNNs with accelerometer data to differentiate between different activities from the dataset provided in [13]. They compare the performance of multiple preprocessing methods (raw data, spectogram and its variants) for use with a CNN for classification. They achieve the best results when using raw values.
The authors in [14] make use of semantic representations from motion data collected in a manual picking scenario to perform human activity recognition. They use the MoCAP dataset which consits of a multichannel time series of pose information recorded by 38 cameras. This data is labeled with three different attribute representations, two by experts and one by a nonexpert, and is passed to the convolutional neural network architecture described in [15]. The attribute representations differ in the granularity of the sequences used to describe the picking process, for e.g. representation 1 uses
less attributes described for the picking process compared to representation 2. The CNN achieves a higher accuracy for representation 1 compared to the other two representations at 75%. The authors do note that the representation process is subjective as annotations are expert dependent.
As observed from the literature discussed, activity recog-nition in the industry is important for achieving Industry 4.0 goals of optimization, computer guided worker instruction, increased productivity and also to enable a safer work en-vironment. However research in this direction has not been up to speed with activity recognition for other domains (smart health, assisted living etc) due to the absence of a large publicly available dataset. Fortunately, the recent introduction of the publicly available LARa dataset which contains recordings of activities performed in a logistics scenario opens up various opportunities for research in this domain. This paper uses the LARa dataset to perform activity recognition in logistics using IMU data in this work.
III. DATASET
The LARa dataset is a novel dataset that presents multi-modal data for developing algorithms for activity recognition for logistics activity recognition. The dataset has been provided by the ‘Innovationlab Hybrid Services in Logistics’ at TU Dortmund and follows up from their previous research in this area [16]. The dataset consists of 14 individuals performing three different tasks in a logistics scenario, two related to picking and one related to packing. Each of these activities were recorded using an Optical Marker-based Motion Capture (OMoCap) system which measures movements of the par-ticipants as markers, RGB camera to capture videos of the participants and inertial measurement units to track participant movements while performing their activities. There are a total of 758 minutes of data in the LARa dataset which have been annotated for eight intra-activities which in certain sequences constitute the three tasks performed. In addition to this, they also provide 19 binary semantic annotations called attributes for the three scenarios which describe intra-activities in a different manner too. The activities annotated include standing, walking, cart (participant is walking with the cart), handling upwards (participant has atleast one hand raised upward to shoulder height), handling centered (participant can handle things without bending, lifting their arms or needing to kneel), handling downwards (participant has hands below his knees while kneeling or otherwise), synchronization (waving motion before each recording) and a set of samples which were unrecognizable by the annotators and have been marked as
None.
This dataset is the first of its kind in that it provides an opportunity for researchers to develop automated algorithms for recognizing activities in the context of logistics operations as a public dataset. This work focuses on utilizing data from inertial measurement units for logistics activity recognition. Three types of inertial measurement units were used for recording this data and recordings from seven subjects is contained within the dataset. These units are used to measure accelerometer and gyroscope sensor readings on both the legs, arms and the chest/mid-body. Table I presents a summary of IMU measurements in the dataset. There are a total of 14 trials of scenario 1, 99 trials of scenario 2 and 95 trials of scenario
3. For a detail on the sequences of each activity that form the three tasks the reader is referred to [5].
TABLE I. SUMMARY OFIMUMEASUREMENTS IN THELARA DATASET
Subject ID Gender Age Scenario 1 Scenario 2 Scenario 3
S07 M 23 2 13 14 S08 F 51 2 13 14 S09 M 35 2 14 13 S10 M 49 2 13 12 S11 F 47 2 12 0 S12 F 23 0 6 14 S13 F 25 2 14 14 S14 M 54 2 14 14 Total 14 99 95 IV. METHODOLOGY
The methodology for this study follows a typical ML pipeline as shown in Fig. 1 where the first stage is preprocess-ing (windowpreprocess-ing in this case), followed by feature extraction and then the use of ML to perform classification. Each of these steps are discussed in detail in subsequent sections. Three different tests were performed with the four machine learning algorithms, first using both frequency and time domain fea-tures, the second using time domain features only, and the third using only frequency domain features.
A. Preprocessing Stage
The sensor measurements from the inertial measurement units in the dataset are recorded with a sampling frequency of 100 Hz. Data collection takes place as the participants carry out each of the three scenarios. Moreover, each triaxial accelerometer and gyroscope reading has been annotated as belonging to one of the eight activity classes described in section III.
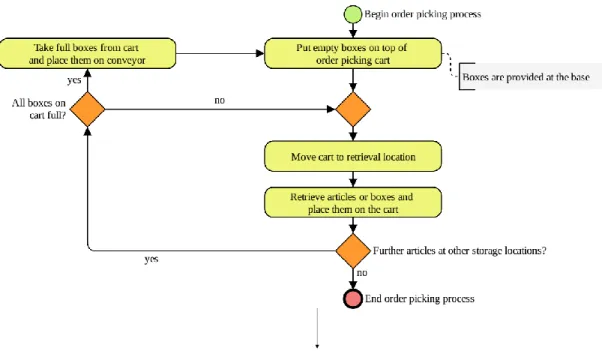
Since the data consists of tasks determined by the per-formance of a number of sequential activities, during prepro-cessing contiguous segments are extracted from accelerometer and gyroscope measurements having the same label. For e.g. for scenario 1, Fig. 2 depicts the sequence of events in the carrying out of this task by subject seven (trial number 1) as extracted from the labeled activities of IMU data. The figure also shows the business model of the activity performed [5] for context. The windowing process extracts the contiguous samples for each of these activities, in this case there were 28 windows extracted for the intra-activities that constitute the task in scenario 1 in terms of activities: standing (0), walking (1), cart (2), handling upwards (3), handling centered (4), handling downwards (5), synchronization (6) and None (7). After performing ‘windowing’ for all samples, segments from annotations belonging to the categoriesNoneand synchroniza-tion were removed as they are not intended to be taken in to account [5]. The remaining segments for six activities were passed on to the feature extraction stage.
B. Feature Computation
Feature extraction is the process of representing data in a meaningful format so as to make it more adaptable for use in computational processes such as regression, classification or other forms of decision making. The field of human activity recognition using wearable sensor data has utilized various
types of feature extraction mechanisms such as wavelets [17], time and frequency domain computations [18] and also CNNs [19]. In this work, different time and frequency domain fea-tures have been used to represent the information contained in the extracted windows of the accelerometer and gyroscope sensors. This choice is motivated by the works of [20], [21] who achieve very good results for human activity recognition, we compute twelve time domain and four frequency domain features in the feature extraction process. These are listed in Table II. These parameters are computed for each of the segments extracted in the preprocessing stage. Moreover, for each sensor in each segment, feature values are normalized across the three axes to ensure that different scales/units of the sensors do not affect classification performance.
TABLE II. FEATURES COMPUTED FROMIMUDATA
Domain Feature set
Time Variance Mean Median Standard Deviation Maximum Minimum Delta 25th Percentile 75th Percentile Interquartile range Kurtosis Skew Frequency
Power Spectral Density Mean Power Spectral Density Median Power Spectral Density RMS Power Spectral Entropy
C. Classification
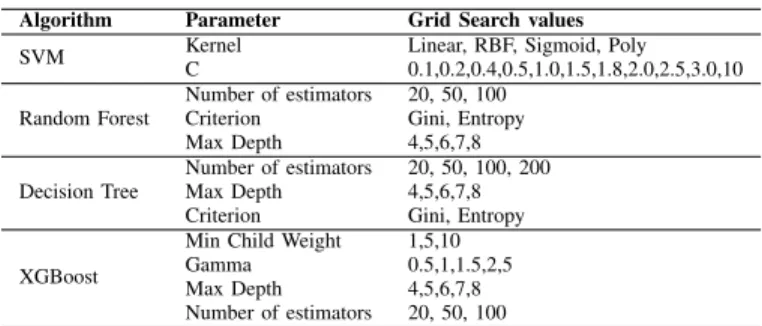
For classification, five different algorithms have been cho-sen to test their efficacy for HAR in the logistics scenario. The algorithms chosen are SVM, XGBoost, Random Forests and Decision Tree. Tree based ensemble schemes have been chosen as they have been useful in [22] for fall detection purposes. Moreover, SVM has been successfully used in [23] to perform human activity recognition using inertial sensors. Each of the chosen algorithms were tuned by performing a grid parameter search. The details of the grid search for each of the tested algorithm is given in Table III.
TABLE III. PARAMETER VALUES FOR TUNINGMLCLASSIFIERS
Algorithm Parameter Grid Search values
SVM Kernel Linear, RBF, Sigmoid, Poly C 0.1,0.2,0.4,0.5,1.0,1.5,1.8,2.0,2.5,3.0,10
Random Forest
Number of estimators 20, 50, 100 Criterion Gini, Entropy Max Depth 4,5,6,7,8
Decision Tree
Number of estimators 20, 50, 100, 200 Max Depth 4,5,6,7,8 Criterion Gini, Entropy
XGBoost
Min Child Weight 1,5,10 Gamma 0.5,1,1.5,2,5 Max Depth 4,5,6,7,8 Number of estimators 20, 50, 100
V. EXPERIMENTATION, RESULTS,ANDDISCUSSION In order to test the efficacy of the features used to represent IMU data for logistics activity recognition, we perform three different experiments. These experiments were conducted to
Windowing Frequency Domain Feature Computation Time Domain Feature Computation Support Vector Machines Random Forests Decision Tree XG Boost
Fig. 1. Methodology for HAR Recognition in Logistics
6 -> 0 -> 1 -> 4 -> 3 -> 4 -> 0 -> 4 -> 5 -> 4 -> 2 -> 4 -> 5 -> 4 -> 3 -> 4 -> 0 -> 4 -> 3 -> 4 -> 0 -> 4 -> 0 -> 4 -> 2 -> 5 -> 4 -> 5
Fig. 2. Translation of Scenario 1 (LARa Dataset) to a Sequence of Activities for Recognition
ascertain the most appropriate algorithm to be used for the targeted task as well as the most appropriate feature set to be used. It is important to note that sensor data from all five locations on the body were utilized in these experiments. The implementations of support vector machine (SVM), and random forest (RF), decision tree (DT) and Extreme Gradient Boost (XGBoost) present in the scikit-learn toolkit1have been
used. Training is performed with a train-test split of 75-25 using five fold cross validation.
1https://scikit-learn.org
A. Experiment with Time and Frequency Features
In this experiment both frequency and time domain features were used as input to the classification algorithms. Tests were conducted using both accelerometer and gyroscope values. For the case of using features from both the time and frequency domains, a total of sixteen parameters were computed for each sensor modality present as given in Table II. The length of the feature vector for this experiment was 480.
Table IV presents the results from this experiment. This work reports on the accuracies achieved for activity classes. From the table, it can be observed that the best performing algorithm is XGBoost with a mean accuracy of 78.61%, followed by 76.67% for SVM. The mean accuracy achieved by
TABLE IV. SUMMARY OF RESULTS: TIME ANDFREQUENCY DOMAIN FEATURES
Activity Algorithm (Accuracy %)
SVM RF DT XGB Stand 78 74 60 80 Walk 83.33 66.66 50 75 Cart 66.66 50 50 83.33 Hand Up 75 56.25 37.5 75 Hand Center 73.07 80.76 66.66 74.35 Hand Down 84 84 68 84 Average Accuracy 76.67667 68.61167 55.36 78.61333
using RF and DT are 68.61% and 55.36% respectively which are significantly less than the best performing results. This result is in agreement with the works of [22] who also find gradient boosted trees to work well for use in human activity recognition applications.
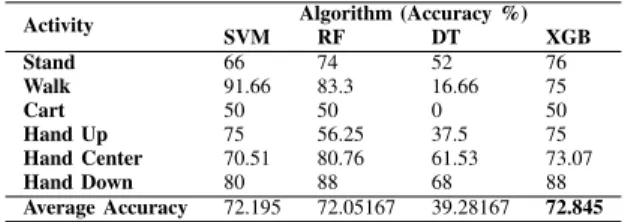
B. Experiment with Time Domain Features Only
The second experiment consisted of using only time do-main features for logistics activity recognition. A total of twelve time domain features were computed from the sensor readings. This resulted in a total of 360 features being used for the classification stage. The results for each classifier are shown in Table V. Taking from average accuracy, SVM, RF and XGBoost provide similar performances with mean accuracies of around 72% with DT performing very poorly (a mean accuracy of only 39.61%). Another point to note from Table V is that all classifiers have performed poorly for the activityCart. This indicates that the time domain features used in this work are unable to represent this activity well.
TABLE V. SUMMARY OF RESULTS: TIME DOMAIN FEATURES ONLY
Activity Algorithm (Accuracy %)
SVM RF DT XGB Stand 66 74 52 76 Walk 91.66 83.3 16.66 75 Cart 50 50 0 50 Hand Up 75 56.25 37.5 75 Hand Center 70.51 80.76 61.53 73.07 Hand Down 80 88 68 88 Average Accuracy 72.195 72.05167 39.28167 72.845
C. Experiment with Frequency Domain Features Only
In this experiment, only frequency domain features were used for activity recognition. This resulted in a total of four features being computed for each sensor modality present. This resulted in a feature vector size of 90 for the classifiers. The results of the experiment are depicted in Table VI. The results indicate that the XGBoost performs the best among all the classifiers tested with a mean accuracy of 56.11% with the SVM achieving a mean accuracy of 54.495%. These results are a significant reduction from the results of experiments 1 and 2. Another point to note here is that the activity Hand up
has the least individual performance followed by the activity
Cart. This indicates that the frequency domain based features used here might not be enough to appropriately represent these activities for logistics activity recognition.
From the three experiments conducted, the most suitable combination of feature set and classifier is a combination of time and frequency domain features along with an XGBoost
TABLE VI. SUMMARY OF RESULTS: FREQUENCY DOMAIN FEATURES ONLY
Activity Algorithm (Accuracy %)
SVM RF DT XGB Stand 54 46 70 48 Walk 75 66.66 58.33 75 Cart 33.33 6.66 16.66 50 Hand Up 25 0 6.25 18.75 Hand Center 75.64 76.92 48 76.923 Hand Down 64 68 28 68 Average Accuracy 54.495 44.04 37.87333 56.11217
classifier. Table VII lists the precision, recall and F1 scores for the individual activities when using the best performing combination for activity recognition in a logistics scenario. It can be observed that the best scores are achieved for the activitiesCartandHand Downand the least scores are for the activitiesWalk andHand Center.
TABLE VII. SUMMARY OF BEST RESULTS: TIME+ FREQUENCY DOMAIN FEATURES ANDXGBOOST CLASSIFIER
Activity Accuracy Precision Recall F1
Stand 80 0.8 0.645161 0.714286 Walk 75 0.75 0.9 0.818182 Cart 83.33 0.833333 1 0.909091 Hand up 75 0.75 0.666667 0.705882 Hand Center 74.35 0.74359 0.816901 0.778523 Hand Down 84 0.84 1 0.913043 VI. CONCLUSION
In this study the problem of activity recognition in a logistic scenario is addressed. In this regard, this research makes use of IMU sensor data from the novel LARa dataset which contains OMOCap, video and IMU sensor recordings for individuals performing three different scenarios in an industrial setting. The experiments conducted in this work make use of several time and frequency domain based features which have been used in activity recognition/fall detection using wearable sen-sors along with popular machine learning frameworks which have also proved to perform well in such applications. From the conducted experiments, the XGBoost algorithm performed the best when used with the considered time and frequency domain features and the highest mean accuracy achieved was 78.61%.
VII. FUTUREWORK
This work establishes a baseline for logistics human activ-ity recognition using inertial sensors on a novel dataset and can be used for optimization of logistics operations. Future work in this area will include using Deep Learning algorithms such as Convolutional Neural Networks and Recurrent Neural Networks which are able to capture information in sensor readings more intricately. Another scope of research is the use of sensor fusion of OMOCap and/or Video data with wearable sensor data for classification between the different activities for such logistics applications.
REFERENCES
[1] T. Singh and D. K. Vishwakarma, “Human activity recognition in video benchmarks: A survey,” in Advances in Signal Processing and Communication. Springer, 2019, pp. 247–259.
[2] X. Luo, Q. Guan, H. Tan, L. Gao, Z. Wang, and X. Luo, “Simultaneous indoor tracking and activity recognition using pyroelectric infrared sensors,”Sensors, vol. 17, no. 8, p. 1738, 2017.
[3] F. Demrozi, G. Pravadelli, A. Bihorac, and P. Rashidi, “Human activity recognition using inertial, physiological and environmental sensors: a comprehensive survey,”arXiv preprint arXiv:2004.08821, 2020. [4] X. Zheng, M. Wang, and J. Ordieres-Mer´e, “Comparison of data
preprocessing approaches for applying deep learning to human activity recognition in the context of industry 4.0,”Sensors, vol. 18, no. 7, p. 2146, 2018.
[5] F. Niemann, C. Reining, F. M. Rueda, N. R. Nair, J. A. Steffens, G. A. Fink, and M. t. Hompel, “Lara: Creating a dataset for human activity recognition in logistics using semantic attributes,” Sensors, vol. 20, no. 15, p. 4083, 2020.
[6] J. A. Ward, P. Lukowicz, G. Troster, and T. E. Starner, “Activity recognition of assembly tasks using body-worn microphones and ac-celerometers,” IEEE transactions on pattern analysis and machine intelligence, vol. 28, no. 10, pp. 1553–1567, 2006.
[7] J. Zhao and E. Obonyo, “Towards a data-driven approach to injury prevention in construction,” inWorkshop of the European Group for Intelligent Computing in Engineering. Springer, 2018, pp. 385–411. [8] H. Koskim¨aki, V. Huikari, P. Siirtola, and J. R¨oning, “Behavior
model-ing in industrial assembly lines usmodel-ing a wrist-worn inertial measurement unit,” Journal of Ambient Intelligence and Humanized Computing, vol. 4, no. 2, pp. 187–194, 2013.
[9] M. Zeng, L. T. Nguyen, B. Yu, O. J. Mengshoel, J. Zhu, P. Wu, and J. Zhang, “Convolutional neural networks for human activity recognition using mobile sensors,” in 6th International Conference on Mobile Computing, Applications and Services. IEEE, 2014, pp. 197–205. [10] P. Zappi, C. Lombriser, T. Stiefmeier, E. Farella, D. Roggen, L. Benini,
and G. Tr¨oster, “Activity recognition from on-body sensors: accuracy-power trade-off by dynamic sensor selection,” inEuropean Conference on Wireless Sensor Networks. Springer, 2008, pp. 17–33.
[11] S. Feldhorst, M. Masoudenijad, M. ten Hompel, and G. A. Fink, “Motion classification for analyzing the order picking process using mobile sensors,” in Proc. Int. Conf. Pattern Recognition Applications and Methods, 2016, pp. 706–713.
[12] R. Grzeszick, J. M. Lenk, F. M. Rueda, G. A. Fink, S. Feldhorst, and M. ten Hompel, “Deep neural network based human activity recognition for the order picking process,” inProceedings of the 4th international Workshop on Sensor-based Activity Recognition and Interaction, 2017, pp. 1–6.
[13] T. Sztyler and H. Stuckenschmidt, “On-body localization of wearable devices: An investigation of position-aware activity recognition,” in 2016 IEEE International Conference on Pervasive Computing and Communications (PerCom). IEEE, 2016, pp. 1–9.
[14] C. Reining, M. Schlangen, L. Hissmann, M. ten Hompel, F. Moya, and G. A. Fink, “Attribute representation for human activity recognition of manual order picking activities,” inProceedings of the 5th international Workshop on Sensor-based Activity Recognition and Interaction, 2018, pp. 1–10.
[15] F. M. Rueda and G. A. Fink, “Learning attribute representation for human activity recognition,” in2018 24th International Conference on Pattern Recognition (ICPR). IEEE, 2018, pp. 523–528.
[16] C. Reining, F. Niemann, F. Moya Rueda, G. A. Fink, and M. ten Hompel, “Human activity recognition for production and logistics—a systematic literature review,”Information, vol. 10, no. 8, p. 245, 2019. [17] G. Bhat, R. Deb, V. V. Chaurasia, H. Shill, and U. Y. Ogras, “Online human activity recognition using low-power wearable devices,” in 2018 IEEE/ACM International Conference on Computer-Aided Design (ICCAD). IEEE, 2018, pp. 1–8.
[18] P. Sarcevic, S. Pletl, and Z. Kincses, “Comparison of time-and frequency-domain features for movement classification using data from wrist-worn sensors,” in2017 IEEE 15th International Symposium on Intelligent Systems and Informatics (SISY). IEEE, 2017, pp. 000 261– 000 266.
[19] A. Ignatov, “Real-time human activity recognition from accelerometer data using convolutional neural networks,” Applied Soft Computing, vol. 62, pp. 915–922, 2018.
[20] A. A. Badawi, A. Al-Kabbany, and H. A. Shaban, “Sensor type, axis, and position-based fusion and feature selection for multimodal human daily activity recognition in wearable body sensor networks,”Journal of Healthcare Engineering, vol. 2020, 2020.
[21] S. Rosati, G. Balestra, and M. Knaflitz, “Comparison of different sets of features for human activity recognition by wearable sensors,”Sensors, vol. 18, no. 12, p. 4189, 2018.
[22] N. Zurbuchen, P. Bruegger, and A. Wilde, “A comparison of machine learning algorithms for fall detection using wearable sensors,” in2020 International Conference on Artificial Intelligence in Information and Communication (ICAIIC). IEEE, 2020, pp. 427–431.
[23] I. Bustoni, I. Hidayatulloh, A. Ningtyas, A. Purwaningsih, and S. Azhari, “Classification methods performance on human activity recognition,” inJournal of Physics: Conference Series, vol. 1456, no. 1. IOP Publishing, 2020, p. 012027.