Content-based Three-dimensional Engineering Shape Search
K. Lou, S. Prabhakar*, and K. Ramani
Purdue Research and Education Center of Information Systems in Engineering (PRECISE)
School of Mechanical Engineering
*Department of Computer Science
Purdue University, West Lafayette, IN 47907
{
[email protected]
,
[email protected]
,
[email protected]
}
Abstract
In this paper, we discuss the design and implementation of a prototype 3D Engineering Shape Search system. The system incorporates multiple feature vectors, relevance feedback, and query by example and browsing, flexible definition of shape similarity, and efficient execution through multi-dimensional indexing and clustering. In order to offer more information for a user to determine similarity of 3D engineering shape, a 3D interface that allows users to manipulate shapes is proposed and implemented to present the search results. The system allows users to specify which feature vectors should be used to perform the search.
The system is used to conduct extensive experimentation real data to test the effectiveness of various feature vectors for shape – the first such comparison of this type. The test results show that the descending order of the average precision of feature vectors is: principal moments, moment invariants, geometric parameters, and eigenvalues. In addition, a multi-step similarity search strategy is proposed and tested in this paper to improve the effectiveness of 3D engineering shape search. It is shown that the multi-step approach is more effective than the one-shot search approach, when a fixed number of shapes are retrieved.
1.
Introduction
The development of information technology, coupled with the rapid decrease of the cost of computer hardware, has resulted in the proliferation of computer technologies in engineering applications. Recently, traditional Computer-Aided Design (CAD) systems have been evolving to more integrated product developing systems, such as Product Data Management
(PDM) systems and Product Lifecycle Management (PLM) Systems. These advanced systems manage product information through their lifecycle, from conception, operation, to disposal [1]. Product information, including materials, process, analysis, tooling, molding, suppliers, cost, assembly, and maintenance, constitutes corporate intellectual capital. Reusing the corporate intellectual capital has been triggering substantial changes [2-5] for product design and development in the data-intensive environment. For example, it enables variant/automated process planning [3], fast cost evaluation, and case-based reasoning [2]. These changes are critical to develop products with high quality at low cost and shorter lead-time, which impact competitiveness and survivability in the globally competitive environment of the information age [7].
As the backbone of the product description in product developing systems, the geometric models are associated with large amount of engineering and business information. Searching 3D shapes to retrieve associated information is critical for product development [2-5, 8]. Furthermore, in the areas of bioinformatics and medical image processing, this topic has attracted substantial research interest [9-11].
Content-based 3D shape search is still a relatively new research area, although research in the field of 2D objects has made progress in efficiency and effectiveness. In content-based 3D shape search systems, 3D models are represented by feature vectors, which are obtained through a process called “feature extraction”. These representations are stored in a database. Most of shape search systems, if not all, work as follows [27]. A query is usually submitted as an example, such as a 2D drawing or 3D model. Feature vector are automatically extracted as searchable “numerical fingerprints” that represent shape content. These feature vectors are compared with those stored in the database. The difference of feature vectors of two shapes is quantified to stand for the dissimilarity of
two models. The system orders the models by the differences and presents the most similar models to the user as search results.
Based on the representation of the 3D shape, prior search systems can be classified as those based on moment invariants, Fourier coefficients, shape histogram, shape distribution, spherical harmonics, aspect graph, and graph. The use of moments for shape description was initiated by Hu [12] for 2D visual pattern reorganization. Sadjadi and Hall [13] extended the use of moment in shape search to 3D applications. Vranic & Saupe [28] used the Fourier coefficient of discrete Fourier transformation to represent as a 3D shape description. Ankerst et al. used shape histograms [14] that are based on complete and disjointed partitioning of the space in which the objects reside into cells. Osada et al. proposed shape distribution [15] consisting of the probability distribution of geometric properties of the randomly sampled surface points. Kazhdan and Funckhouser [30] investigated decomposing 3D models into a collection of functions defined on concentric spheres and using spherical harmonics as shape signature. Cyr and Kimia used aspect graph [16] to match 3D objects by 2D views. El-Mehalawi and Miller studied to the use of graphs extracted from the B-rep representation of 3D models for shape search.
The related work listed above focused on shape representation, which is crucial for searching 3D models. However, there is no systematic testing that has been done to investigate the effectiveness of searching engineering shapes with these feature vectors. Let alone to compare the effectiveness of different feature vectors with the same dataset. The performance of these search systems is usually presented with very limited search results. A one-shot search approach is commonly employed for searching the database without employing user’s knowledge and preference about shape similarity. Furthermore, the graphical interface using 2D images to present the search results or to browse the database is not satisfactory. Although this approach suits the requirement for 2D image search, it is not adequate for 3D engineering shape search, because the depth information of 3D shapes can not be presented.
We introduce a prototype of a 3D Engineering Shape Search System - 3DESS. It serves as a test-bed for the concept and algorithms of engineering shape search. The system extracts four feature vectors – moment invariants, geometric ratios, principal moments, and eigenvalues of the adjacency matrix of skeletal graph, to represent 3D engineering shapes. We extensively tested and characterized the effectiveness of the system based on different feature vectors. Two methods are employed for comparing the effectiveness
in this paper. One method is to test five representative shapes and draw the precision-recall curve for each query shape. The other is to compare the average precision of a relatively large number of retrievals for each feature vector. In addition, a multi-step similarity search strategy is proposed and tested in this paper for improving the effectiveness of 3D engineering shape search Seidel and Kriegel [31] used multi-step k-nearest neighbor search for improving the efficiency of the index, here multi-step is a strategy for effectivness). Furthermore, in order to offer more information for a user to determine similarity of 3D shapes, a 3D interface allowing users to manipulate the presented shapes is proposed and implemented, while, to the best of our knowledge, all other content-based 3D shape search systems use 2D images to present search results. The system is implemented as three-tier architecture. A database of 113 engineering shapes is employed to test the effectiveness of the shape descriptors. The shapes in the database are manually classified into 26 similar groups. They are mixed with some noisy shapes that do not belong to any group. An R-tree based multidimensional index access method is implemented to improve the search efficiency.
The rest of the paper is organized as follows. Section 2 describes the system architecture of 3DESS. Section 3 presents the feature extraction and feature vectors representing shape content. Section 4 is devoted to the experiments and discussion on the effectiveness of feature vectors. The multi-step search strategy is also evaluated in this section. We conclude the paper and propose some future work in section 5.
2.
System architecture
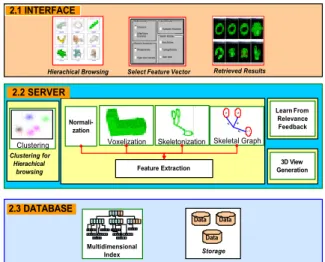
2.3 DATABASE Multidimensional Index 7812 26 34914 15101113 P 0 P 1 P 0P1P3P2 P0P1P2P3P4 P 0P 1P 2P 3P4P0P1P2P3 P0P1P3P2 P0P1 P 0 P 1 P 0P 1P 2P 3P 4 P0P1P 2P 3P 4Select Feature Vector
Voxel Attributes Voxelization Parameters Basic Entities Topology Relations Graph based Skeleton Attributes Model Geometry Dimensions Surface/Volume Parameters Moments / Invariants Principal moments Higher order invariants
Hierachical Browsing Retrieved Results
Skeletonization Voxelization L1 L2 L 3 E1 E2 E3 Skeletal Graph 2.2 SERVER 0 Clustering Clustering for Hierachical browsing Storage Data Data Data Feature Extraction Learn From Relevance Feedback 2.1 INTERFACE Normali-zation 3D View Generation
The architecture of our 3D engineering shape search system is illustrated in Fig. 1. The system is implemented as three-tier architecture that consists of INTERFACE, SERVER and DATABASE, which are described as follows.
2.1 Interface
The INTERFACE layer includes the interfaces to submit a shape as a query example, to select feature vector(s) that will be used for shape representation, to search the database by browsing, and to present the search results and to interact with a user to get relevance feedback.
It is difficult to describe the shape content using words or numbers. Thus the system is mainly implemented as query by example [17]. Users can create a geometric model using most of the independent modeling tools, save it as a 3D CAD file, and submit it as a query through an interface similar to the file explorer in Windows. However, not all users are good at arts and sometimes, it is not easy to draw a complex shape even for artists, therefore, we implement an interface that presents the shapes sampled from the database. Users can pick a model and submit it as an initial query model. Thus they are not required to build the model.
In addition, a search-by-browsing interface is also implemented in the system. The shapes in the database are classified into groups using clustering algorithms based on their similarity. They are organized hierarchically. Users search the database by drilling down the hierarchical organization of the shapes. The algorithms regarding the classification of the shapes are described in the next section.
In order to test the effectiveness of different shape descriptors, the system offers an interface to specify which feature vector is going to be tested. In fact, this interface has more meaning than this purpose. It enables users to configure the system’s similarity view so as to align it with that of the user’s. It is important because the similarity of geometric shapes is subjective [6]. All users do not necessarily use the same features to describe shapes. By using this interface, they can configure the system with different feature vectors.
Two-dimensional (2D) images have been used in content-based image systems. This mechanism has been commonly transplanted in content-based 3D shape search systems. However, a 2D image is a lossy representation of 3D shapes. Users can not manipulate the represented image to retrieve depth information in order to determine if two shapes are indeed similar. Therefore, a 3D interface based on JAVA 3D is employed in our system to offer more information to users to judge similarity. The interface for relevance
feedback is embedded in the interface. Users mark on the interface the relevant and irrelevant shapes and let the system redo the search.
2.2 Server
The SERVER layer consists of modules that deal with computation-intensive tasks. There are mainly four modules that serve for shape clustering, feature extraction, 3D view generation, and weights reconfiguration.
Different algorithms for clustering shapes were implemented in the system, including Self-Organization Map (SOM), Genetic Algorithms (GA), and k-Means clustering. These algorithms organize the shapes in the database hierarchically. Based on the clustering and the browsing interface, users can drill down to retrieve models. Based on different feature vector, the classification of shapes in the database might be different. Thus, we build the classification map for each feature vector. Building a dynamic, user-specific classification hierarchy is a better approach. Efficiently classifying the shape is a major challenge.
Feature extraction is a critical module in the server. It consists of shape normalization, voxelization, skeletonization, and skeletal graph construction. Feature vectors are acquired from the geometric models after the processing. In Section 3, these processes and algorithms for feature extraction are described in more detail.
The 3D view generation module is responsible for presenting search results in a 3D view interface, which allows users to manipulate the model. When the search systems identify the shapes that are most similar to a query model, the database IDs of these models are inserted into a list. The server uses these IDs to locate the files that define the shapes. It generates a triangulated view of the original model and passes it to the user interface. The task is done using the Application Programming Interface (API) of JAVA 3D and the geometric kernel – ACIS.
Learning from the relevance feedback makes the system more adaptive and intelligent. This module improves the interaction between a user and system. When search results are presented on the interface, a user can mark on the screen relevant and irrelevant shapes. The system analyzes the feedback, identifies the patterns from the feedback, and makes changes for the query processing. Two mechanisms have been implemented in the system – query reconstruction and weights reconfiguration [6]. Query reconstruction means to adjust the query vector so that it better represents the user’s search intention. Weight reconfiguration updates the weights for each feature vector based on relevance feedback. Relevance
feedback is a way to deal with the subjectivity of shape similarity. For the tests of this paper, the relevance feedback was turned off.
2.3 Database
The DATABASE layer consists of two primary modules – multidimensional index and database. Due to the difficulty of implementing multidimensional indexes in current commercial databases, the multi-dimensional index is built on top of database. Future plans are to extend a COTS database with multidimensional indexing. The database employed in the system is Oracle 8i. It contains the geometric model and all other information, such as feature vectors. Whenever a shape is inserted in the database, a database ID is generated for it and all the feature vectors are extracted and stored in the database. Then the index is updated with the ID and feature vectors accordingly.
3D shapes are usually represented by some features that consist of a number of attributes. A Search retrieves shapes with overall similarity based on all attributes rather than an individual attribute. Multidimensional index structures are more suitable than one-dimensional indexes, such as ubiquitously used B+ tree [18, 32]. The index structure used in the system is an R-tree based index [19, 25]. In such an index, points in feature space are clustered in groups and a group is represented by a bounding rectangle/hyper-rectangle [19, 25, 33] containing the points. The bounding hyper-rectangle is a tight bounding box that is represented by the coordinates of its two diagonal vertices. To answer a query, the query point is compared with the bounding box in order to prune the sub-tree rooted at this hyper-rectangle. In [6], we tested the R-tree index for searching 3D engineering shapes. Real and synthetic databases were employed in the testing. The results showed that the search was almost optimal for small real databases and efficient for large synthetic databases.
2.4 Query Processing
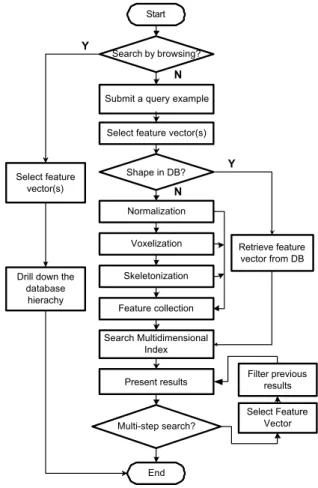
Figure 2 is a flow chart that illustrates how the query is processed by the search system. There are two ways a user can use this system. For query by browsing, it is simple to use. A user browses the hierarchically organized database to choose models satisfy the requirements. For query by example (QBE), a user submits a shape model, either created using modeling tools or picked from the interface presenting shapes sampled from database, as a query example, specify the features to represent shape content; the system then goes through the feature extraction process
and uses the feature vector as a key to search the multi-dimensional index; the results are shown in the interface; at this point, the user can choose whether to do multi-step search. Relevance feedback can be started from here, although it is not used for the tests in this paper.
Submit a query example
Shape in DB? Normalization Voxelization Skeletonization Feature collection Retrieve feature vector from DB Search Multidimensional Index Present results Select feature vector(s)
Multi-step search? End Select Feature Vector Filter previous results Start Search by browsing?
Drill down the database hierachy Select feature vector(s) Y N Y N
Figure 2 Flow chart of query processing
3.
Feature extraction
3D shapes are transformed into different forms, in order to extract feature vectors. These transformations include normalization, voxelization, skeletonization, and graph construction. They are roughly described as follows. More information can be found in our previous papers [8] and other publication [20].
3.1 Normalization
Normalization is the process of transformation of a 3D model into a standardized or canonical form that retains all the relevant geometrical information of the original model. The standardized form is embodied as
set of conditions called the normalization criteria [22]. The normalization criteria are imposed on the moments of the objects. For a 3D model, which is characterized by a density function of f(x,y,z), The moment of 3D models is defined in Equation 3.1. The sum of l, m, and n is the order of the moment, thus mlmn is the
(l m n+ + )th
order moment of the model.
( , , ) l m n lmn m x y z f x y z dxdydz −∞ =
∫∫∫
⋅ ⋅ ⋅ (3.1) With the above definition of the moment, the normalization criteria set can be defined by Equation 3.2-3.4. 100 010 001 0 m =m =m = (3.2) 000 m =consant (3.3) 110 101 011 0 m =m =m = (3.4)These three criteria specify the translation, orientation, and scale normalization, respectively. In geometrical terms, the canonical version of a model is characterized by a specific position, orientation, and size. Equation 3.2 requires aligning the shapes centroid to the coordinate origin. Equation 3.3 is satisfied by adjusting the volume of the models to some constant value C. Equation 3.4 is satisfied by rotating the model through some angle such that the axis of coordinates coincide with the principal axis of the models, i.e.µxy=µxz=µyz=0; In order to reduce the ambiguity,
two more constraints are usually used to normalize the 3D shapes: (1) the principal axis of the moment with largest moment coincide with X-axis, Y-axis with the second largest, and Z-axis with the smallest, i.e.µxx>µyy>µzz; and (2) the maximum extent of the
object is greater in each positive half-space [20, 22].
3.2 Voxelization
Voxelization is the process of converting a representation of a 3D shape into a set of small volume elements (voxels) [1]. The procedure of voxelization is as follows: (1) bound the model with a bounding box; (2) divide the bounding box into N3 small boxes (voxels) with equal volume; and (3) assign one to a voxel if it contains a part of the CAD model, and zero otherwise. Thus, the voxel model can be expressed by a discrete density function as expression 3.5.
( , , ) { ijk| ijk , , , 0,1...( 1)}
f i j k = p p ∈ℜi j k= N− (3.5)
where: pijk =1 if voxel intersects CAD model; pijk=0, otherwise.
3.3 Skeletionization
3D skeletonization is the process of extracting a skeleton from a 3D binary representation - voxel model. The notion of a skeleton was introduced by Blum [49]. In order to represent the original voxel model, the skeletons are required to preserver topology and to be invariant to translation, rotation, and scaling of original model. In this paper, we use a thinning algorithm [52]. The thinning algorithm retains the topology of the original model but is not always invariant to translation, rotation and scaling. In this paper, skeleton is primarily used to construct the skeletal graph to represent original 3D shape. Topological information is sufficient to construct skeletal graphs.
3.4 Skeletal Graph Construction
The skeletal graph is constructed based on the skeleton of 3D shapes. Skeletal graphs consist of nodes and edges. The nodes are of three types – line, loop, and curve. An edge represents the connectivity between two nodes. In [21], the graph constructed based on B-REP of 3D CAD models have been employed for shape search. However, B-REP is sensitive to trivial changes of the CAD model. Furthermore, the size of B-REP graph is much larger than that of skeletal graph. Since graph search is NP complete, it is not efficient to use large-size graphs.
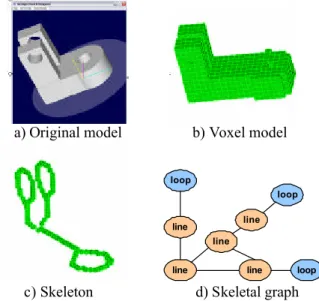
Figure 3 shows the shape representation at different stage of feature extraction, from original shape, to voxel model, skeletal model, and skeletal graph.
a) Original model b) Voxel model
loop line loop loop line line line line
c) Skeleton d) Skeletal graph
Figure 3 Shape representations at processing stages3.5 Feature vectors
There are four types of feature vectors that are used in this paper. They are moment invariants, geometric parameters, principal moments, and eigenvalues of adjacency graph of skeletal graph of 3D shapes. They are extracted from model representations after different transformation.
3.5.1 Moment invariants Moment invariants are derived from second order moments and are invariant to translation, scaling, and orientation [22]. The invariant property is realized through the following steps: (1) Align the centroid of the shape to the origin or coordinate system; compute the central moment (µlmn) that is invariant to translation; (2) Compute the volume of the shape, eliminate scaling impact on the central moments by dividing them by a volume term, the expression 5 / 3
000
lmn lmn
I =µ µ is scaling invariant (µ000 is the volume of the model), and (3) Construct a matrix of Ilmn (Equation 3.6), the coefficients of the characteristic equation of the matrix is orientation invariant. F1, F2, and F3 in equation 3.7-3.10 are moment invariants, which are used to construct a feature vector in this paper.
200 110 101 3 2 110 020 011 101 011 002 ( ) I I I P a b c I I I I I I λ λ λ λ λ λ λ − = + + + = − − (3.6) 200 020 002 1 F =I +I +I (3.7) 2 2 2 002 200 002 020 020 200 101 110 011 2 F =I I +I I +I I −I −I −I (3.8) 2 2 2 002 200 020 110 011 101 101 020 011 200 110 002 3 2 F =I I I + I I I −I I −I I −I I (3.9)
3.5.2 Geometric parameters Geometric parameters are retrieved from the original 3D shape and the normalized model. These parameters include two aspect ratios, the ratio of overall surface area to volume, the scaling factor used to normalize the model, and the overall volume. Among all the feature vectors, the aspect ratio and the ratio of surface to volume are important design parameters. If the aspect ratio is large, it usually means that the part is slim. If the ratio of surface over the volume is large, it usually implies that the shape is shell-like. This information is important for product design and development, especially for material selection and process planning.
3.5.3 Principal moments Moments represent the distribution of the models in the coordinate system.
The combination of all order moments can accurately describe the density function of CAD models and vice versa. In [23], it is reported that 4-7th order moments have been used. However, higher order moments are sensitive to noise. In this paper, principal moments that are second order are used as a feature vector. They are invariant to translation and orientation but dependent on scaling. The impact of scaling can be reduced by using the principal moments of normalized models.
The method to compute the principal moments is illustrated in Equation 3.10. Following the definition of Equation 3.1, we can get all the second order moments. The eigenvalues ( ( )p ( )p ( )p)
xx yy z z
µ µ µ of the moment matrix
are the principal moments.
→ = = ) ( ) ( ) ( 002 011 101 011 020 110 101 110 200 0 0 0 0 0 0 , , , , , , , , , , , , p zz p yy p xx zz yz xz yz yy xy xz xy xx M µ µ µ µ µ µ µ µ µ µ µ µ µ µ µ µ µ µ µ µ µ (3.10) The feature elements from the principal moments and the moment invariants have different advantages. The moment invariants are calculated from the moments of the model, of which centroid is aligned with the origin. It does not require scale normalization and rotation normalization. This avoids the errors resulted from the scaling process. These errors can be a serious problem that introduces large noise to CAD models (see [22] for details). The elements of this feature vector, however, have undergone complicated computation. It is difficult to relate them with geometrical characteristics of the models.
The principal moments directly reflect the distribution of the density function of a model. Furthermore, these three feature elements are of the same order. This makes the relevance feedback more meaningful and simpler, especially when linear combinations of similarity based on different feature vectors are used as the overall similarity.
3.5.4 Eigenvalues Skeletal graphs are built upon the skeletons of 3D shapes. However, it is difficult to directly search graphs efficiently, since it is NP complete. We use the adjacency matrix to represent the matrix. The eigenvalues of the adjacency matrix are indexed for searching graphs efficiently.
Each element in the matrix represents the relationship between two nodes. The value of the element is computed based on the type of relationship, for example, loop-to-loop connection and loop-to-line connection have different values. More information about this topic is available in [30].
4.
Experiments and discussion
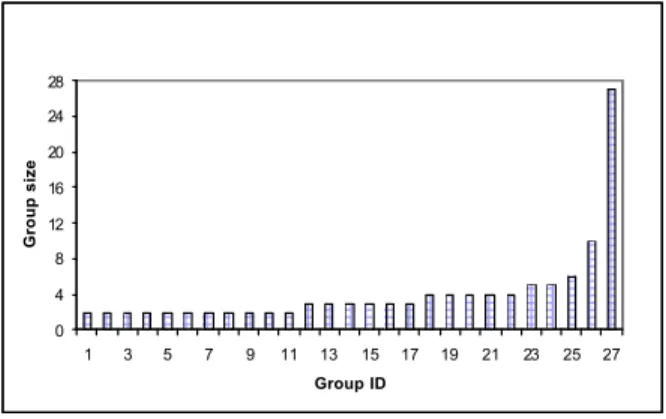
The database used for testing consists of one hundred thirteen 3D engineering shapes. Eighty-six of the shapes are manually classified into twenty-six groups. The sizes of the groups vary from two to eight. There are also twenty-seven “noisy shapes” that do not belong to any group. Figure 4 shows the sizes of each group in the ascending order.
0 4 8 12 16 20 24 28 1 3 5 7 9 11 13 15 17 19 21 23 25 27 Group ID Group size
Figure 4 Size of groups of 113 models
In this paper, we used two methods to compare the effectiveness of the search system. One method uses precision-recall curves, and the other method uses the average precision of a large number of queries with a fixed number of retrieved shapes. They are explained depicted in detail below.
4.1 Precision-recall curves
The most widely used measures of performance in information retrieval are precision and recall. Suppose that the true set of shapes in the database similar to the query is A and the retrieved shape set is R. Precision (Pr) is the ratio of the number of the relevant records retrieved (AnR) to the total number of shapes retrieved (R). Recall (Re) is the ratio of the number of retrieved relevant shapes to the number of all relevant shapes in the database. Figure 5 illustrates the relationship of A, R and An R. The mathematic definition of precision and recall are as Equation 4.1 and 4.2.
Figure 5 Illustration of precision and recall definition
R R A | | Pr= I (4.1) A R A | | Re= I (4.2)
An ideal search system retrieves the dataset exactly the same as all the similar shapes in the database, i.e. R=A, which make Pr = Re = 1.0. However, because of the complexity of presenting shape content in low level features, it has been a challenge for years to develop an ideal search system. It is impossible to ensure Pr = Re = 1.0 for all queries. In reality, the precision and recall have an inverse relationship. Usually one of the two parameters can grow at the expense of the other. Thus, precision and recall are usually used simultaneously to characterize the search performance. Neither of them can independently characterize the performance of the system. For example, if we set the threshold for similarity to a small value (close to 0), then the system could retrieve all the shapes from the database. In this case, the recall is 1, however the precision is low. If we have a strict measure on similarity (threshold close to 1), the system probably retrieves a very limited number of shapes. In this case the precision will be high; and the recall is however low.
The combination of precision and recall is sometimes termed as effectiveness. In order to characterize the effectiveness of shape feature vectors, we plot the precision-recall curve for queries with five 3D models, respectively. The five models are chosen from the twenty-six groups and no two models are from same group. Figure 6 shows the models that were employed for this test. They are number sequentially from 1 to 5.
1 2 3 4 5
Figure 6 Sample shapes tested for Precision-recall curves In our search system, the similarity measure is defined based on a weighted Euclidean distance. The weighted Euclidean distance is shown by Equation 4.3. Equation 4.4 is used to compute the similarity.
∑
− = − • = dim1 0 2 ) ( i i i i q x w d (4.3)where: d is the weighted Euclidean distance; q is feature vector of query shape; x is the feature vector of a shape in DB; dim is the dimensionality of f eature vector.
max ) , ( 1 d x q d s= − (4.4)
where: s is the similarity measure;
dmax is maximum distance of feature space q, x, and d are as above.
In the above equation, the Euclidean distance (d) is a measure of dissimilarity between two shapes. It is normalized by the maximum distance of points in the feature space. The normalization ensures the similarity between two shapes is from 0 to 1.
When users submit a query, they need to choose a feature vector and specify a threshold to filter shapes. The shapes that have a larger similarity measure than the threshold are regarded as similar by the system and presented to the user. The precision and recall for this query are then evaluated using the known classification map.
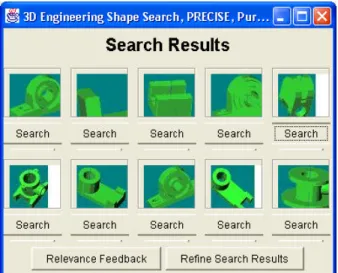
Figure 7 illustrates the results of a query. The top-left part is the query shape, which belongs to a group of five similar shapes. The feature vector used for this query is moment invariants. The similarity threshold is 0.85. The precision for this query is 0.50; and the recall is 0.22. When we compute the precision and recall, we do not count the query shape itself, because it is guaranteed to be retrieved.
Figure 7 An example of shape search with threshold 0.85
Figures 8 – 12 show the results for the five representative shapes listed in Figure 6. In each figure, there are four precision-recall curves that correspond to moment invariants, geometric parameters, principal moments, and eigenvalues, respectively.
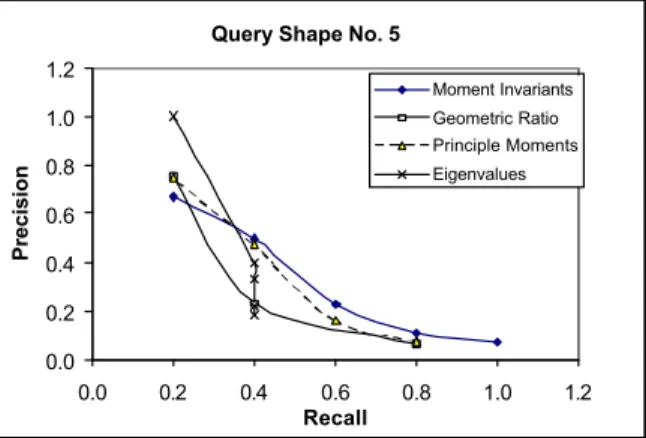
It can be seen from the figures that for all the five query shapes, the precision and recall curves of moment invariants, geometric parameters, and principal moments have clear inverse relationship that has been observed for information retrieval systems. The only exception is the case of geometric parameters for shape No.3, for which the recall stays at one and does not change with precision.
The precision-recall curves of the moment invariants are similar to those of principal moments. This implies that these two feature vectors have similar effectiveness in shape search.
For almost all of the query shapes, the precision-recall curves of eigenvalues do not have standard inverse relationship. Three of them have recalls that stay at a fixed number or change little; two other curves have precisions that vary little. The performance of search with eigenvalues is quite dependent on the query shape. Thus, the eigenvalues of the adjacency matrix are not suitable for generic shape descriptors for shape search. One of the reasons could be that the size of the skeletal graph is small, thus the eigenvalues can not differentiate different shapes. This will become worse when the database becomes larger. Therefore, the use other local geometric information to improve selectiveness of the eigenvalues of the adjacency matrix of skeletal graph is necessary.
Query Shape No. 1
0.0 0.2 0.4 0.6 0.8 1.0 1.2 0 0.2 0.4 0.6 0.8 1 1.2 Recall Precision Moment Invariants Geometric Ratio Principle Moments Eigenvalues
Query Shape No. 2 0.0 0.2 0.4 0.6 0.8 1.0 1.2 0.0 0.2 0.4 0.6 0.8 1.0 1.2 Recall Precision Moment Invariants Geometric Ratio Principle Moments Eigenvalues
Figure 9 Precision-recall curves for shape No. 2
Query Shape No. 3
0.0 0.2 0.4 0.6 0.8 1.0 1.2 0 0.2 0.4 0.6 0.8 1 1.2 Recall Precision Moment Invariants Geometric Ratio Principle Moments Eigenvalues
Figure 10 Precision-recall curves for shape No. 3
Query Shape No. 4
0.0 0.2 0.4 0.6 0.8 1.0 1.2 0.0 0.2 0.4 0.6 0.8 1.0 1.2 Recall Precision Moment Invariants Geometric Ratio Principle Moments Eigenvalues
Figure 11 Precision-recall curves for shape No. 4
Query Shape No. 5
0.0 0.2 0.4 0.6 0.8 1.0 1.2 0.0 0.2 0.4 0.6 0.8 1.0 1.2 Recall Precision Moment Invariants Geometric Ratio Principle Moments Eigenvalues
Figure 12 Precision-recall curves for shape No. 5
4.2 Average effectiveness
The test for average precision is mainly conducted to compare the effectiveness of the multi-step search strategy and one-shot search method.
The tests to compare the precision and recall in the previous section were conducted with a one-shot searching approach. However, the semantic gap [6, 26] between the low-level feature vectors and high-level shapes greatly affects the effectiveness of content-based shape search systems. In 2D image search systems, relevance feedback has been applied to bridge the semantic gap. It is a mechanism to improve the interaction between users and the system, so as to adjust the system’s similarity view to users’ view. The core part of the relevance feedback is the pattern recognition from the relevant and irrelevant dataset. This is difficult when the system only presents limited number of shapes. Furthermore, it does not give the user sufficient privilege to manipulate the search system. This is critical for the users with good understanding of 3D engineering shapes.
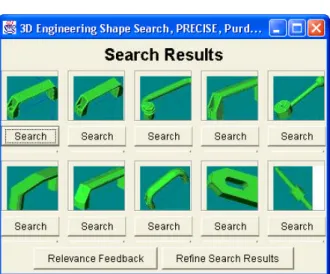
Thus, in this paper, we propose and implement a multi-step search strategy. Different from the relevance feedback, this approach gives a user more flexibility to employ her expertise to determine how to filter search results. After the search system presents the search results to the user, she observes the results and determines if she would like to further filter the previous results with other feature vectors. In our experiments, we observed many cases that the system retrieved more similar shapes using multi-step search than using individual or combined feature vectors. Figures 13 and 14 are examples using one-shot and multi-step, respectively. Figure 13 shows the best results using individual feature vector. Figure shows the results using moment invariants first and geometric parameters second. In either of these cases, the system retrieves thirty shapes and presents the ten most similar
shapes to users. Thus, for the multi-step search, the system first retrieves thirty shapes based on moment invariants, uses the geometric parameters to reorder these thirty shapes and then presents ten most similar shapes. The precision and recall of Figure 13 is 0.3 and 0.43, respectively, while for Figure 14, they are 0.5 and 0.71.
Figure 13 Search results using principal moments
Figure 14 Multi-step search results
In general, multi-step strategy outperformed the one-shot search. Nevertheless, there were also queries that multi-step search strategy did not outperform the one-shot strategy. In order to get an overall evaluation of the effectiveness of the multi-step search strategy, we conducted following experiments: from each of the twenty six groups, choose one shape as query model; submit the search and let the system present only a fixed number of shapes; compute the precision of the search results. The experiments were done with the number of the retrieved shape fixed to ten and the size of the group to which the query shape belongs, respectively.
Figure 15 illustrates the average recall of twenty six queries with different feature vectors. It can be seen that among the individual feature vectors, the descending order of the recall is: principal moments, moment invariants, geometric parameters, and eigenvalues. The multi-step search strategy has better performance than any one-shot search with individual feature vector. The precision of multi-step search is 51% higher than the best individual feature vector – principal moments.
For the tests that retrieve as many shapes (|R|) as the size (|A|) of the group that the query shape belongs to, the precision and recall are the same. Thus, figure 15 actually compares the effectiveness (both recall and precision) for these queries with |A| = |R|.
0 0.1 0.2 0.3 0.4 0.5 0.6 0.7 0.8 0.9 1 2 3 4 5 Feature Vectors Average Recall
retrieved as many shapes as group size Retrieved 10 shapes for every query 1 - Moment invariants
2 - Geometric parameters 3 - Principle moments 4 - Eigenvalues 5 - Multi-step
Figure 15 Average recalls with different feature vectors For the tests that the number of retrieved shape equals ten, the precision and recall are different. Figure 16 presents the average precision and recall of twenty six queries. It can be seen that the precision of the queries for which ten shapes were retrieved is much smaller than the queries for which only as many as group sizes are retrieved. In addition, it seems that the precisions are scaled from the recalls. One of the reasons for this could be that the sizes of the groups (|A|) are smaller than the number (|R|) of the retrieved.
0 0.1 0.2 0.3 0.4 0.5 0.6 0.7 0.8 0.9 1 2 3 4 5
Shape represenation and search strategy
Average precision
Average recall Average precision 1 - Moment invariants, one-shot
2 - Geometric parameters, one-shot 3 - Principle moments, one-shot 4 - Eigenvalues, one-shot 5 - Multi-step
5.
Conclusion and future work
In this paper, we presented the design and implementation of a 3D Engineering Shape Search system. The system incorporates multiple feature vectors, relevance feedback, and query by example and browsing, flexible definition of shape similarity, and efficient execution through multi-dimensional indexing and clustering. In order to offer more information for a user to determine similarity of 3D engineering shape, a 3D interface that allows users to manipulate shapes is proposed and implemented to present the search results. The system allows users to specify which feature vectors should be used to perform the search.
We extensively tested the effectiveness of a content-based 3D engineering shape search systems using different shape descriptors. It is more effective to use moment invariants, principal moments, and geometric parameters as shape descriptors for 3D engineering shape search. From the precision-recall curves of the shape descriptors, we conclude that the eigenvalues of the adjacency matrix of the skeletal graph is not a satisfactory to search similar shapes independently. Other information is required to improve the selectiveness of the eigenvalues of the adjacency matrix of skeletal graph.
Based on the tests of a relatively large number of queries that retrieve a fixed number of shapes from the database, the descending order of average recalls of feature vectors is: principal moments, moment invariants, geometric parameters, and eigenvalues.
A multi-step search strategy significantly improves the recall of the search system. The average recall of multi-step search is 51% higher than that of the best one-shot search that uses principal moments.
Acknowledgements
Initial funding for this project came from the 21st Century Research and Technology Fund award from the state of Indiana. We also acknowledge the support from the Innovation Realization Lab at Purdue University and the University Faculty Scholar Award from Purdue University, which seeded this project. We would like to thank Prof. Christoph M. Hoffmann in Computer Science and Prof. Zygmunt Pizlo in Psychological Science, Purdue University, for their invaluable suggestions. We also would like to thank Mahendra Babu for the implementation of 3D interface.
References
[1] D. Connor, M. Gutknecht, “Helping Clients Harness Knowledge to Drive Innovation,” Proc. of the Second International Conference, Basel, Switzerland, October 29-30, 1998.
[2] W.F. Lu, X.F. Liu, H. Chang, L. Dong, “Feature-based Representation and Indexing of Axisymmetric Parts in Machining Process Planning using Case-Based Reasoning,” 9th International Conference on Tools with Artificial Intelligence (ICTAI '97) , Nov.3-8, 1997, Newport Beach, CA [3] M.M. Ramesh, D. Yip-Hoi, D. Dutta, “Feature Based Shape Similarity Measurement for Retrieval of Mechanical Parts,” Vol. 1, No. 3, pp. 205-280, Sept. 2001
[4] V. Cicirello, W.C. Regli, "Machining Feature-Based Comparisons of Mechanical Parts," Int'l Conf. on Shape Modeling and Applications, sponsored by ACM SIGGRAPH, the Computer Graphics Society and EUROGRAPHICS. IEEE Computer Society Press, Genova, Italy, 07-11 May 2001, pp.176-185.
[5] A. Elinson, D.S. Nau, and W.C. Regli. Featurebased similarity assessment of solid models. In Christoph Hoffman and Wim Bronsvoort, editors, Fourth Symposium on Solid Modeling and Applications, pages 297--310, New York, NY, USA, May 14-16 1995. ACM, ACM Press. Atlanta, GA. [6] K. Lou, S. Jayanti, N. Iyer, Y. Kalyanaraman, S. Prabhakar, K. Ramani, "A Reconfigurable, Intelligent 3D Engineering Shape Search System Part II: Database Indexing, Retrieval and Clustering", to appear in ASME DETC' 03, 23rd Computers and Information in Engineering (CIE) Conference, September 2-6, 2003, Chicago, Illinois. [7] J.R. Hartly, Concurrent Engineering: Shortening Lead Times, Raising Quality, and Lowering Costs, Productivity Press, 1992
[8] N. Iyer, Y. Kalyanaraman, K. Lou, S. Jayanti, K. Ramani, "A Reconfigurable, Intelligent 3D Engineering Shape Search System Part I: Shape Representation", to appear in ASME DETC' 03, 23rd , Computers and Information in Engineering (CIE) Conference, September 2-6, 2003, Chicago, Illinois.
[9] Kelley LA, MacCallum RM & Sternberg MJE (2000). Enhanced Genome Annotation using Structural Profiles in the Program 3D-PSSM. J. Mol. Biol. 299(2), 501-522 [10] G. Kastenmüller, H.-P. Kriegel, T. Seidl, “Similarity Search in 3D Protein Databases,” Proc. German Conf. on Bioinformatics (GCB), Cologne, Germany, 1998
[11] J.-P. Thiran and T. Butz, "Fast non-rigid resistration and model-based segmentation of 3D images using mutual information," SPIE; San Diego; USA, 3979, (2), 2000, pp. 1504-1515.
[12] M.K. Hu, “Visual Pattern Recognition by Moment Invariants,” IRE Trans. Information Theory, Vol. 8, pp. 179-182.
[13] F.A. Sadjadi, and E.L. Hall, “Three-dimensional Moment Invariants,” IEEE Trans. Pattern Analysis Mach. Intell. PAMI-2, pp.127-137.
[14] M. Ankerst, G. Kasternmuller, H.P. Kriegel, and T. Seidl, 1999, “3D Shape Histograms for Similarity Search and Classification in Spatial Databases,” Proc. Int’l Symposium on Spatial Databases (SSD’99), Hong Kong, China.
[15] Osada, R., Funkhouser, T., Chazelle, B., and Dobkin, D., 2002, " Matching 3D Models with Shape Distributions," Shape Modeling International, Genova, Italy, May 2001. [16] Cyr, C.M., and Kimia, B.B., 2001 “3D Object Recognition Using Shape Similarity-Based Aspect Graph,” Proc. of IEEE International Conference on Computer Vision, Vol. 1, pp. 254-261.
[17] M. Zloof, `Query By Example', Proc. of AFIPS Conference, 44, 431--432, 1975.
[18] J.M. Hellerstein, E. Koutsoupias, C.H. Papadimitriou, “On the Analysis of Indexing Schemes,” SIGMOD-SIGART Symposim on Principles of Database Systems, pp 249-256, 1997.
[19] N. Roussopoulos, S. Kelley, and F. Vincent, “Nearest neighbor Queries,” SIGMOD Conference, pp71-79, 1995. [20] G. Cybenko, and A. Bhasin, and D. Kurt, K.D. Cohen, “Pattern Recognition of 3D CAD Objects: Towards an Electronic Yellow Pages of Mechanical Parts,” Vol.1, Smart Engineering Systems Design, pp.1-13, 1997.
[21] K. Palagyi, and A. Kuba, “A 3D 6-subiteration Thinning Algorithm for Extracting Medial Lines,” Pattern Recognition Letters, Vol. 19, pp. 613-627, 1998.
[22] Cohen, D.K, “Feature Extraction and Pattern Analysis of Three-Dimensional Objects”, Master Thesis, Thayer School of Engineering, Dartmouth College
[23] M. Elad, A. Tal, and S. Ar, “Content based Retrieval of VRML Objects - An iterative and Interactive Approach,” The
6th Eurographics workshop in Multimedia, Manchester UK, September 2001.
[24] D. McWherter, M. Peabody, A. Shokoufandeh, and W. C. Regli, "Database Techniques for Archival of Solid Models," 6th ACM/SIGGRAPH Symp. on Solid Modeling and Applications, Ann Arbor, MI, 06 Jun 2001, pp. 78-87. [25] T. Guttman, “R-trees: a dynamic index structure for spatial searching, Proc. of the SIGMOD Conference, Boston, MA, June 1984, pp. 47-57.
[26] Santini, S., 2001, Exploratory Image Databases: Content-Based Retrieval, Academic Presses.
[27] S. Santini and R. Jain , “Beyond query by example ,” Proc. of the Sixth ACM International Multimedia Conference, Bristol, England, 1998, pp. 345—350.
[28] D.V. Vranic, and D. Saupe, “3D Shape Descriptor Based on 3D Fourier Transform,” Proc. The EURASIP Conference on Digital Signal Processing for Multimedia Communications and Services (ECMCS 2001), Budapest, Hungary, 2001, pp. 271-274.
[29] M. Kazhdan, and T. Funkhouser, " Harmonic 3D Shape Matching," to appear as a SIGGRAPH 2002 Technical Sketch.
[30] El-Mehalawi, M., and Miller, R.A., in Press, “A Database System of Mechanical Components Based on Geometric and Topological Similarity. Part I: Representation,” Computer-Aided Design, Vol. 35, Issue 1, Jan, 2003, pp. 83-94.
[31] T. Seidl, H-P. Kriegel, “Optimal Multi-Step k-Nearest Neighbor Search,” ACM SIGMOD, 154-165, 1998.
[32] H. V. Jagadish, “A Retrieval Technique for Similar Shapes,” In SIGMOD, 1991, pp. 208-217.
[33] C. Faloutsos, M. Ranganathan, and Y. Manolopoulos, “Fast Subsequence Matching in Time-series Databases,” ACM SIGMOD Conference, Minneapolis, MN, 1994pp. 419-429