A
University
of
Sussex
PhD
thesis
Available
online
via
Sussex
Research
Online:
http://sro.sussex.ac.uk/
This
thesis
is
protected
by
copyright
which
belongs
to
the
author.
This
thesis
cannot
be
reproduced
or
quoted
extensively
from
without
first
obtaining
permission
in
writing
from
the
Author
The
content
must
not
be
changed
in
any
way
or
sold
commercially
in
any
format
or
medium
without
the
formal
permission
of
the
Author
When
referring
to
this
work,
full
bibliographic
details
including
the
author,
title,
awarding
institution
and
date
of
the
thesis
must
be
given
us
University of Sussex
Essays on the Role of Public Infrastructure and
Medium-term Growth Strategies in Developing
Countries
(with
particular
Emphasis
on
Ethiopia)
Yohannes Ayalew Birru
Submitted for the degree of Doctor of Philosophy
Department of Economics
University of Sussex
June 2016
Acknowledgements
Many individuals have, in one way or another, helped me in finalizing this thesis. I would like to take this opportunity to thank some of them. First and foremost, my deepest gratitude goes to my supervisor, Professor L. Alan Winters, for his relentless help and intellectual guidance throughout my study. This thesis would not have been completed if it were not for his constant encouragement, push and understanding. In the early phase of the thesis, I benefited from discussions with professor Sherman Robinson. I am thankful to him.
Members of the economics department also deserves my sincere thanks for making the Department an inspiring and friendly learning and research environment. Thanks, in particular, to Professor Andy Newell, Professor Andy McKay, Professor Richard Dickens, Professor Richard Tol and Janet French.
I am indebted to my many student friends who, through stimulating discussion over lunch coffee and other occasions, made my stay at Sussex fun and enlightening. I am especially grateful to Tsegay Gebrekidan and Giulia Mascagni.
I wish to thank Mekdes Seware, Selam, Haimanot and other Ethiopian community in the United Kingdom for being great hosts when it is time for me from the long hours of work on thesis.
I am grateful to the Ethiopian government, particularly to H.E. Ato Hailemariam Desalegn, Prime Minister of the Federal Democratic Republic of Ethiopia, for his support by allowing me to take education leaves whenever it was necessary to make advances on my research, at the time when every minute is important in the implementation of the Growth and Transformation Plan (GTP).
I am also indebted to the National Bank of Ethiopia, EDRI and IDS for financial support for the study. I am, in particular, thankful to H. E. Ato Neway Gebre-ab, Economic Advisor to the Prime Minister and Director of EDRI and
H.E. Ato Teklewold Atnafu, Governor of the National Bank of Ethiopia, Ato Mezgebe Mehretu.
I would like to thank research staff of the National Bank of Ethiopia, particularly Muluneh Ayalew, Fikru Gezahegn, Woinshet Zeberga, Fekadu Degafe, Eskinder Worku and Zewdu Haile-Gebriel for their unreserved assistance in proofreading and organizing data for my thesis.
Finally, special thanks to my wife, Asnakech Dechasa and my sons and daughters, Yishak, Edom, Abraham, Fiker, and Estifanos; my mother, the late Alemnesh Gelaw; and bother and sisters Zewdu Ayalew, Mehiret Ayalew, for their unreserved help and understanding when I am spending time away from them.
UNIVERSITY OF SUSSEX
YOHANNES AYALEW BIRRU, DOCTOR OF PHILOSOPHY ESSAYS ON THE ROLE OF PUBLIC INFRASTRUCTURE AND
MEDIUM-TERM GROWTH STRATEGIES IN DEVELOPING COUNTRIES (WITH PARTICULAR EMPHASIS TO ETHIOPIA)
SUMMARY
Ethiopia’s Five–Years Growth and Transformation Plan (GTP) (2009/10-2014/15) was an ambitious economic growth strategy. The plan relied on huge investment on infrastructure, health and education to achieve a minimum average annual rate of growth of 11 percent and transform the economy from agriculture to manufacturing base. This thesis analyzes internal consistency of Ethiopia’s medium-term growth strategy, and the challenges posed by the structural transformation process on monetary policymaking.
The first chapter examines the link between infrastructure capital
accumulation and growth, and explores complementarities between
infrastructure development and export growth strategy. To this end, a three-sector analytical model that is built from the production functions of three separate sectors, i.e., the infrastructure, exports and non-export private sectors, is developed as an analytical framework to address the gap in the literature. The estimation results indicate that public infrastructure has a strong spill-over effect on the export and non-export sectors, and differences in marginal productivities of labour and capital between export and non-export sectors range from 12.5 percent in East Asia to 250 percent in Latin America.
The second chapter explores whether the structural transformation process in developing countries affects the stability of demand for money and the effectiveness of monetary policy. The chapter applies a panel co-integration analyses on selected fast-growing African countries including Ethiopia. It is found that, given aggregate national income, a-one-percent increase in rural per-capita income, a proxy to structural transformation, boosts the demand for money by more than 0.3 percent.
In the third chapter, Ethiopia’s five year Growth and Transformation plan is evaluated for internal consistency using a modified financial programming model. Given the low level of savings, the planned boost in investment on infrastructure is expected to face financing challenges. This potentially threatens the country’s macroeconomic stability. The estimation results indicate that the baseline scenario is not sustainable in the long run indicating the need to reconsider current policies and strategies. Based on simulation results of six alternative policy scenarios, the exchange rate is found to be the most effective policy instruments in terms of addressing both the foreign exchange and saving-investment gaps forecasted by the baseline scenario.
Contents
List of Tables... x
List of Figures ...xii
Abbreviations... xiv
Introduction... 1
1. Public infrastructure, Exports and Growth: The Experiences of Selected African, Latin American and East Asian Countries... 9
1.1 Introduction ... 9
1.2 Theoretical Framework ... 12
1.2.1 Infrastructure-Economic Growth Nexus ... 12
1.2.2 Exports-Economic Growth nexus ... 14
1.2.3 Infrastructure-Export Performance-Growth Nexus ... 15
1.3 Limitations of Existing Analytical Frameworks ... 17
1.3.1 A One-Sector Growth Regression Model ... 17
1.3.2 The Growth Accounting Equation ... 18
1.4 Structure and Theoretical Foundation of the Three-sector Model ... 20
1.5 Data Sources and Analysis ... 26
1.5.1 Data Description and Variable definition ... 26
1.5.2 Unit Root Analysis ... 30
1.5.3 Analysis of Covariance ... 34
1.6 Methodology of Estimation ... 35
1.7 Estimation Results ... 37
1.7.1. The One-sector model ... 37
1.7.2 The Three-Sector Model ... 39
2. Stability and Determinants of the Demand for Money in Low Income African Countries with Structural Transformation: Theory and Evidence (A
Co-integration Analysis)...46
2.1 Introduction ... 46
2.2 Motivation of the Paper ... 49
2.3 Literature Review ... 51
2.3.1 The Mainstream Theories of the Demand for Money ... 51
2.3.2 Criticisms of the Mainstream Theories of the Demand for Money ... 57
2.4 The Theoretical Framework of the Augmented Model ... 59
2.5 The Link between Structural Transformation and the Demand for Money ... 61
2.6 Data Description and Analysis ... 65
2.6.1 Description of Data ... 65
2.6.2 The Choice between Permanent and Measured Income ... 66
2.7 Structure of the ARDL Models and Estimation Results ... 67
2.7.1 The Economic Estimation Procedure ... 67
2.7.2 Panel Co-integration Results ... 70
2.8 Summary and Recommendation ... 75
3. Evaluating Internal Consistency of Medium-Term Growth Strategies Using a Modified Financing Programming Model: The Case of Ethiopia ... 77
3.1 Introduction ... 77
3.2 Motivations of the Research ... 83
3.3 Brief Historical Background of the Economy ... 86
3.3.1 The Socialist Regime (1975 – 1991) ... 86
3.3.2 IMF Supported Economic Reform (1993 -2002) ... 88
3.3.3 Pre-GTP-I Development Programs: 2003 – 2010... 89
3.3.4 The First Five-Year Growth and Transformation Plan: 2011-2015 ... 91
3.4 The Basic Theoretical Foundation of Financial Programming Model ... 92
3.5 The Modified Financial Programming (MFP) Model ... 96
3.5.1 The Goods and Services Market ... 99
3.5.2 The Money Market ... 105
3.5.3 The Government Sector ... 108
3.5.4 The Foreign Exchange Market ... 109
3.5.5 Saving and Investment Equilibrium ... 110
3.5.6 Aggregate Supply and Prices ... 111
3.5.7 Model Closure... 114
3.6 Data and Estimation Methodology ... 115
3.6.1 Data ... 115
3.6.2 Methodology ... 121
3.6.3 Simulation Model ... 126
3.6.4 Structure of the model... 126
3.6.5 The Structure of the Model in Simultaneous Equations Form ... 127
3.7 Estimation Results of Individual Equations ... 132
3.7.1 Potential Output ... 133
3.7.2 Human Capital Development... 141
3.7.3 Public Infrastructure ... 142
3.7.4 Exports ... 144
3.7.5 Private Consumption... 145
3.7.6 Imports ... 146
3.7.7 The Demand for Money ... 147
3.8 Model Simulation Results ... 153
3.8.1 Within Sample Simulation: 2006 - 2013 ... 154
3.8.2 Out-of-Sample Simulation Exercises: 2014-2025 ... 172
3.9 Conclusion ... 209
Annex 1.1 Derivation of the Three-Sector Model with Expected Infrastructure
Output Growth ... 227
Annex 2.1 Variable definition and descriptions ... 231
Annex 2.2. Unit Root Test Results ... 232
Annex 2-3 Permanent Income ... 233
Annex 3.1. Empirical Simulation Model of the Modified Financial Programming ... 234
Annex 3.2. Definition of Variables used in the MFP Model and Sources of Data... 241
Annex 3.3. Real Effective Exchange Rate and Nominal Effective Exchange Rate ... 249
Annex 3.4. Definition of Variables used in the REER and NEER Model ... 253
Annex 3.5 Determining Long-term Growth Target Consistent Government Borrowing ... 257
Annex 3.6: Asymptotic critical value bounds for the F-statistic ... 259
Annex 3.7: Asymptotic critical value bounds of the t-statistic ... 261
List of Tables
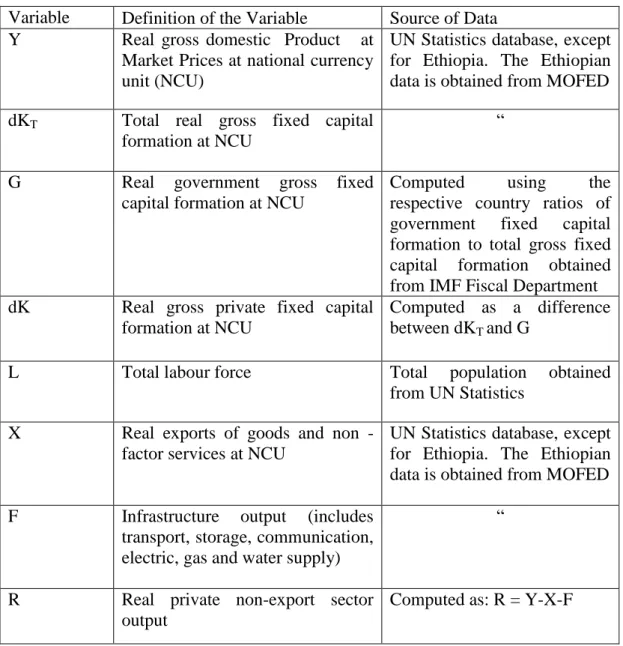
Table 1-1. Data Sources and Variable Definitions 1/ ... 27
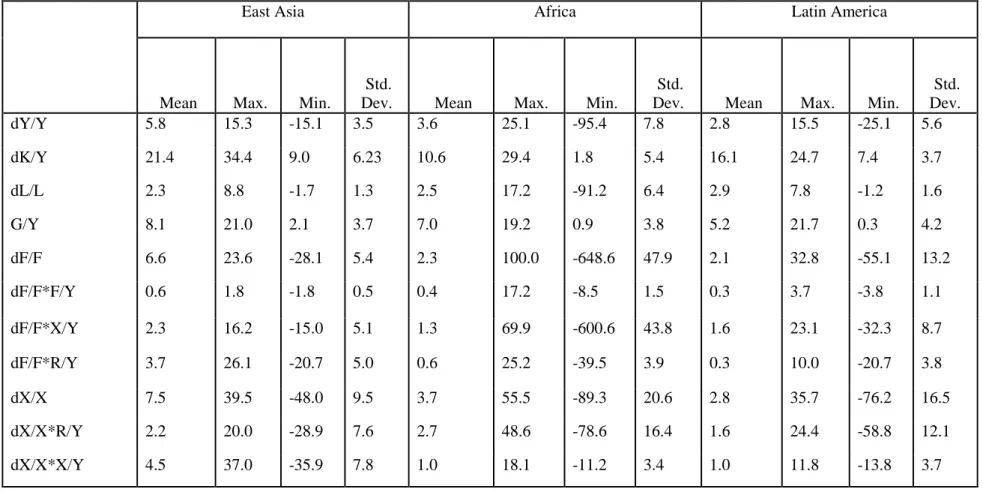
Table 1-2. Descriptive Analysis of Variables unused in the Model: 1982-2011 ... 28
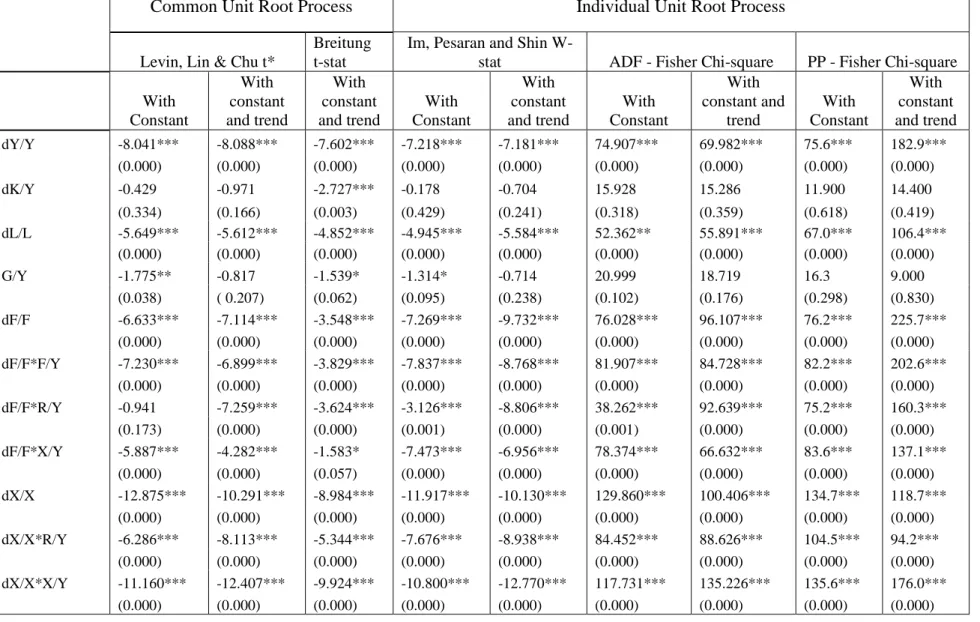
Table 1-3: East Asia - Unit Root Test Results at Level ... 31
Table 1-4: Africa - Unit Root Test Results at Level ... 32
Table1-5: Latin America - Unit Root Test Results at Level ... 33
Table 1-6. Analysis of Covariance ... 35
Table 1-7: One-sector Model with Infrastructure Capital Stock ... 38
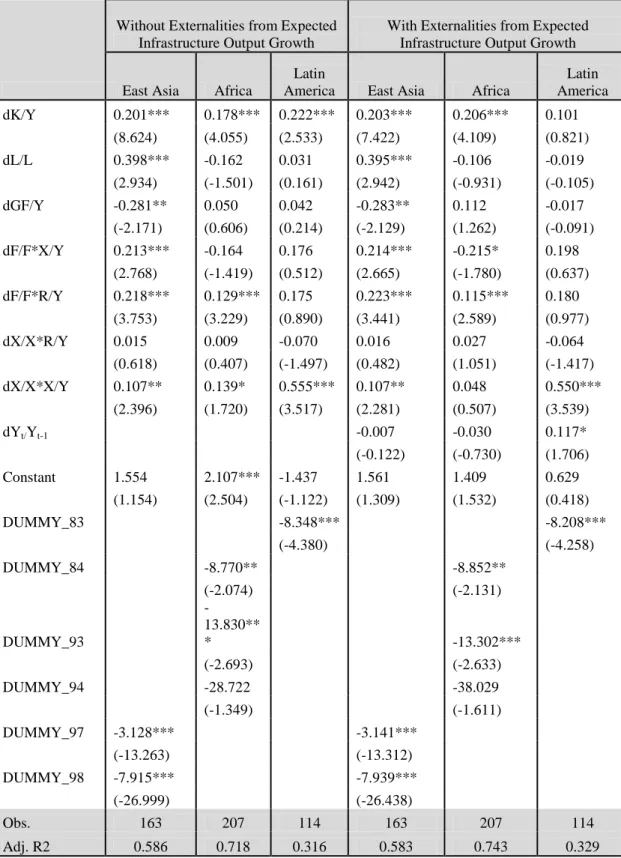
Table 1-8. Three Sector-Infrastructure and Export Spillover Models ... 40
Table 1-9. Spillover Effects of Public Infrastructure and Export Growth, and Marginal Productivity Differences ... 43
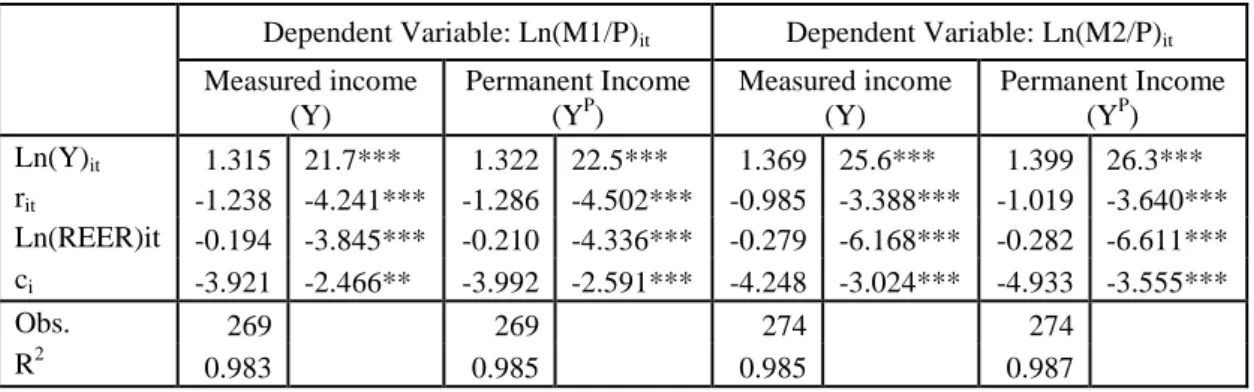
Table 2-1: Estimation Results of the Long run equation of the Conventional Model ... 66
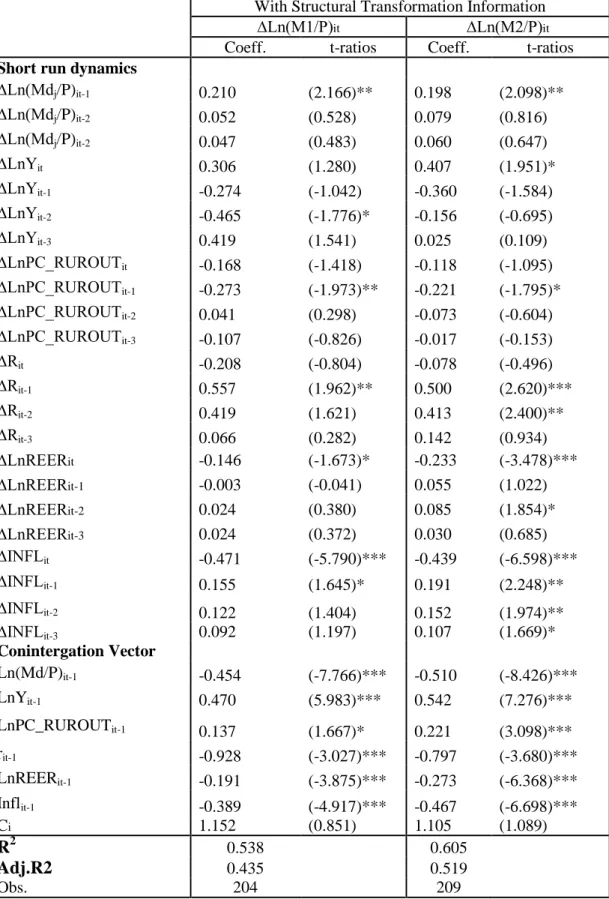
Table 2-2: Short Run Dynamic Cointegration Estimation Results of the Augmented Non-Conventional Model ... 71
Table 2-3: The Long-run Coefficients of the Augmented Non-Conventional Model ... 72
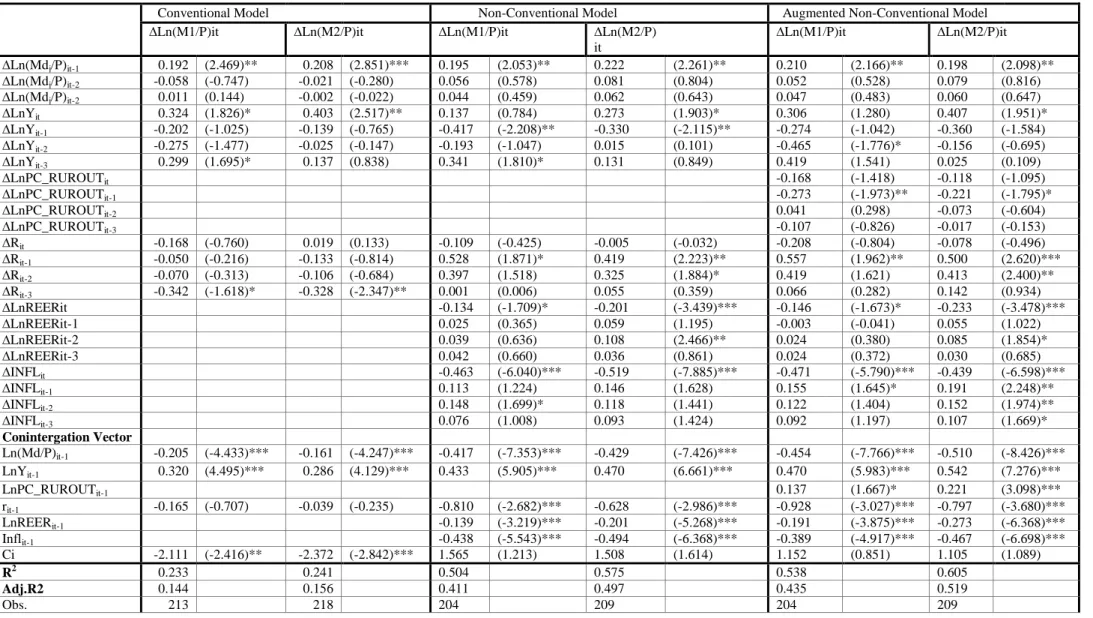
Table 2-4: Estimation Results of ARDL Based Short Run Dynamic Cointegration Models .... 74
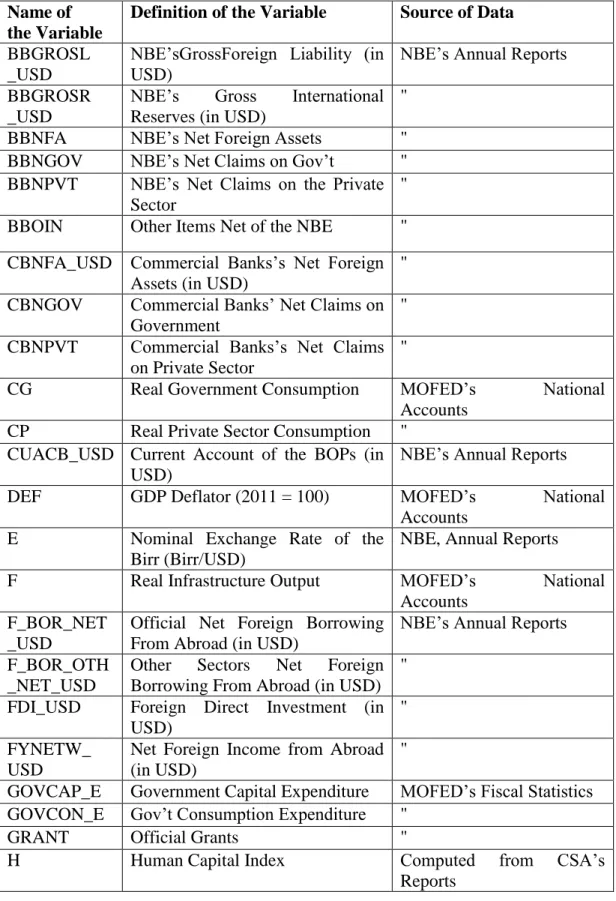
Table 3-1: Definition of Variables and Sources of Data ... 116
Table 3-2: The Basic Structure of the Model ... 127
Table 3-3: Definitions of Variables ... 128
Table 3-4: Contribution of Each Variable to Output Growth ... 136
Table 3-5: Diagnostic test results ... 137
Table 3-6: Tests for structural break point in potential output equation ... 139
Table 3-7: Diagnostic Test results ... 142
Table 3-8: Diagnostic Test results ... 144
Table 3-9: Diagnostic Test Results ... 145
Table 3-10: Diagnostic Test Results ... 146
Table 3-11: Diagnostic Test Results ... 147
Table 3-12: Diagnostic Test Results ... 152
Table 3-13: Main Macroeconomic Policy Targets of GTP I: 2011-2015... 168
Table 3-14: Main Macroeconomic Policy Instruments in GTP I: 2011-2015 ... 168
Table 3-15: Comparison of the Plan against Model Simulation Results and Actuals ... 169
Table 3-16: Projections of Main Exogenous Variables and Policy Targets ... 175
Table 3-17: Simulation Forecast Results for Baseline Scenario: 2014-2015(for Selected Goods, Money and External Markets Variables) 1/ ... 178
Table 3-18: Simulation Results Assuming a 40 Percent Devaluation of the Birr (for Selected
Goods Market, Money Market and External Sector Variables: 2014 – 20251/) . 184
Table 3-19:Forecast Simulation Results Assuming a Forced Saving: 2014-2025 ... 189
Table 3-20: Forecast Simulation Results Assuming 9 percent Potential Growth Target ... 193
Table 3-21: Simulation Forecast Results Assuming 9 Percent Growth and 20 Percent
Devaluation ... 197
Table 3-22: Simulation Forecast Results Assuming Lower Reserve Money Growth ... 201
Table 3-23: Exchange Rate Simulation Results for Zero Foreign Exchange Gap ... 205
Table 3-24: Forecast Simulation Results by Forcing the Model to Solve for the Exchange
List of Figures
Figure 3-1: Plots of Selected Variables of the Model for the Period (1971-2013) ... 119
Figure 3-2: Impulse response of output (Q) for a 10 percent increase in physical capital stock (K) in 2014 ... 135
Figure 3-3: Annual Real Per-capita Rural Income (1971-2013) in thousand Birr... 136
Figure 3-4: CUSUM: 1971–2006 ... 140
Figure 3-5: CUSUM: 2007–2013 ... 140
Figure 3-6: CUSUMSQ: 1971-2006 ... 140
Figure 3-7: CUSUMSQ: 2007-2013 ... 140
Figure 3-8: Impulse response function for a 40 percent increase in public capital formation (Ig) ... 142
Figure 3-9: Impulse response function for a 40 percent increase in public capital formation ... 143
Figure 3-10: Impulse response function for a 10 percent increase in real GDP (Q) in 2014 ... 145
Figure 3-11: Impulse response function for a 10 percent increase in real YDI ... 146
Figure 3-12: Impulse response function for a 10 percent increase in real GDP ... 147
Figure 3-13: Quarterly Trend of Food Inflation in Ethiopia during 1981(QI) - 2006(QIV) ... 149
Figure 3-14: Quarterly Trend of Food Inflation in Ethiopia during 2007(QI)-2013(QIV) ... 150
Figure 3-15 Impulse response function for a 10 percent increase in real GDP ... 151
Figure 3-16: Impulse response function for a 40 percent increase in rural per-capita income in 2015 ... 151
Figure3-17: Impulse response function for a 10 percent appreciation REER in 2014 151 Figure 3-18: CUSUM ... 152
Figure 3-19: CUSUMSQ ... 152
Figures 3-20: Within-Sample (2006 -2013) Simulation Results: Baseline vs. Actual 155 Figures 3-21: Within Sample (2008-2013) Forecasts – The Effects of a 10 Percent Devaluation of the Birr in 2012 ... 159
Figures 3-22: Within-Sample (2008-2013) Forecasts – The Effects of a 10 Percent Increase in Public Sector Investment ... 162
Figures 3-23: Assuming Governemnt Finances the Deficit by Borrowing from the
Centeral Bank ... 165
Figures 3-24: Baseline forecasts (2014 – 2025) ... 180
Figures 3-25: Effects of a 40 Percent Devaluation of the Birr in 2015... 186
Figures 3-26: Effects of Government Forced Savings Measures... 190
Figures 3-27: Effects of Lowering Potential Growth Assumption to 9 percent ... 194
Figures 3-28: Effects of Lowering Potential Growth Assumption to 9 percent and Devaluation of the Birr by 20 Percent Simultaneously. ... 198
Figures 3-29: Effects of Central Bank Decision to Reduce Base Money ... 202
Figures 3-30: Solving for Exchange Rate Policy that Bring Foreign Exchange Gap (FX-Gap) to zero ... 207
Abbreviations
BOP – Balance of Payments
FDI – Foreign Direct Investment
FPF – Financial Programming Framework
GTP – Growth and Transformation Plan
GDP – Gross Domestic Product
GMM – General Method of Moment
IMF – International Monetary Fund
LDC – Least Developed Country
LSDV – Least Square Dummy Variable
MEDAC – Ministry of Economic Development and Cooperation
MFI – Microfinance Institution
MOFEC – Ministry of Finance and Economic Cooperation
MPPL – Marginal Physical Product of Labour
MPPK – Marginal Physical Product of Capital
NBE – National Bank of Ethiopia
SDPRP – Sustainable Development and Poverty Reduction Program
TFP – Total Factor Productivity
UN – United Nations
UNCTAD – United Nations Conference on Trade and Development
USD – United States Dollar
Introduction
This thesis analyzes the current challenges of a medium-term growth strategy in developing countries and the role of public infrastructure investment with particular emphasis given to Ethiopia. The research originally stems from a personal interest on the challenges of the design of an appropriate medium-term growth strategy and a monetary policy framework in developing countries. For instance, in the late 1980s and 1990s, economists, particularly those affiliated to the World Bank advocated that developing countries, particularly Sub-Saharan Africa, should emulate the successful experiences of East Asian countries, such as South Korea and Taiwan. Hence, the structural adjustment programs implemented in the 1980s and 1990s aimed at urging African countries to reform and open up their economies, and take macroeconomic stabilization and structural policy measures that allocate resources in favour of the export sector. The Bank identified exports as the most efficient sector of the economy. However, the reform experiences of most developing countries in the wake of structural adjustment programs were disappointing. After two decades of reform experiences, most African countries found themselves poorer than they were in the 1970s.
Large disparities have been observed between the economies of East Asia, on the one hand, and economies of African and Latin American countries, on the other. In the last three decades, between 1980 and 2011, East Asian countries were growing, on average, 1.6 times and and twice as fast as Africa and Latin America, respectively. During this period, East Asian countries registered an average growth rate of 5.8 percent, compared with 3.6 percent and 2.8 percent, in Africa and Latin America, respectively. One of the main reasons for the success of East Asian economies is that they managed to attract more private investments than their African and Latin American counterparts did. For instance, the annual average private gross fixed investment to GDP ratio was 21.4 percent, which was more than twice the average registered by the
nine fast growing African countries (10.6 percent) in the panel, and more than 1.3 times the growth rate registered in Latin America (16.1 percent).
East Asian countries have also preformed far better than Africa and Latin America in terms of export growth. Therefore, they have been successfully transformed from being mainly primary commodity exporters to manufacturing goods and services exporters. Consequently, their average export-to-GDP ratio was 63 percent between 1980 and 2011, compared with 17.3 percent and 22.2 percent, in Africa and Latin America, respectively. The East Asian countries were also much more successful in terms of macroeconomic management and poverty reduction. They registered the lowest average inflation rate and the fastest reduction in poverty incidence in the last three decades, between 1975 and 2005 compared with their African and Latin American counterparts [Todaro and Smith, 2009]. These divergences in the relative performances of countries in terms of economic growth and poverty reduction have aroused interest for macroeconomists and policy makers in the developing world.
This thesis is organized in three chapters. Each chapter develops a theoretical and analytical framework to deal with three different challenges and empirically test using data drawn from secondary sources. The first challenge is to isolate the impact of infrastructure accumulation on economic growth. Even though various studies have been conducted to understand the strength of the effect of infrastructure capital accumulation on growth, the jury is still out there on the issue. The second challenge relates to understanding the effect of structural transformation on the stability of money demand function. The third challenge has to do with designing a plausible medium-term growth strategy with the right mix of policies. In the first two chapters, the thesis employs a panel data analysis on selected developing countries while the third chapter exclusively deals with the Ethiopian data. The empirical findings are used to forward policy recommendations. In the empirical analysis sections, the major challenge of the thesis was getting a continuous and sufficiently long time series data for countries in the panel, particularly for the African countries. The thesis heavily draws on data from the United Nations, IMF and World Economic Development databases for most countries. The thesis also utilizes data from the National Bank of Ethiopia, the former Ministry of Finance Economic Development (now the Ministry of Finance and Economic Cooperation) and the Central Statistics Authority reports in the Ethiopian case. The
following paragraphs briefly present the objectives and the main findings of the three chapters in the thesis.
The first chapter examines whether increasing investment on infrastructure enhances economic growth using the panel data on selected developing countries from Asia, Africa and Latin America, and tries to draw lessons to Ethiopia. In recent years, the role of infrastructure capital accumulation in enhancing economic growth has gained increased acceptance due to the increased positive outcomes from studies on the area. These studies claim that infrastructure affects long-term growth by enhancing productivities of factors input and generating positive externalities to the rest of the economies through different channels. However, there are researchers that still doubt infrastructure’s growth enhancing role. The latter argues that infrastructure plays only a transitory role. It enhances growth only during the transition dynamics when the economy is moving towards the steady state equilibrium.
The chapter finds that the source of such controversies has been lack of a suitable analytical framework that allows researchers to conduct empirical test on the claims of each group. For the analysis of the role of public infrastructure on economic growth, most empirical researches rely on the conventional one-sector growth model, by adding public infrastructure capital as an additional factor input (Straub 2008a). The estimation results that come out of this model are usually controversial because the magnitude and the sign of the coefficient depend on: one, the initial stock of infrastructure capital, and two, the degree of its utilization. For instance, while researchers such as Limao and Veneables (2001), De, et al (2008), Djankov, et al (2006) who employ either micro approach or gravity models find a strong link between infrastructure capital and growth, many of the studies including Hulten and Schwab (1991), Neuser (1993), Poret (1991) and Canning and Pedroni (2004) who used a one-sector growth modelling approach found little empirical evidences on the link. Wang (2002) argues that, in countries where infrastructure investment accounts for a significant portion of the national output, empirical studies tend to find negative elasticity for real gross domestic product with respect to infrastructure capital input. Moreover, Canning and Pedroni (2004, p.19) argue, “below a growth maximizing level of infrastructure, increases in infrastructure
provision increase long run income, while above this level an increase in infrastructure reduces long run income1”.
The main criticism on the conventional one-sector model is that it cannot capture the inter-sectoral flows of externalities in the economy. For instance, increase in infrastructure services affects aggregate output through three channels. First, infrastructure services enter the national accounts calculation as measures of final product such as electricity, water, transport and communication services. Second, public infrastructure and private factors of production have a high degree of complementarities. The provision of infrastructure services such as electric power, road network and telecom services enhances the productivity of land, labour and physical capital. This leads to higher accumulation of capital in the economy [Wang, 2002 and Straub 2008a]. Third, public infrastructure generates positive externalities to private sector output2, as argued in the new growth theory. One of the distinguishing features of public infrastructure from private capital is that provision of its services is subject to market imperfection and, therefore, the accumulation and operation of infrastructure capital needs government intervention. As a result, the aggregate production function exhibits diminishing returns to capital and increasing returns to scale. The conventional one-sector model captures only the first channel. It cannot capture the other two channels by design as capturing the second and the third channels require splitting the aggregate production into a sector that generates externalities and a sector that benefits from the externalities.
This chapter also argues that infrastructure capital accumulation is not the only source of externalities that create market failure in developing countries. Using empirical analysis, it finds that export growth generates strong externalities to private sector production consistent with previous studies by Feder (1983), Krueger (1980) and Ram (1987). Therefore, the thesis finds that even the two sector model developed by Feder (1983) that is designed to capture inter-sectoral flow of externalities is not able to address the criticism. Therefore, I developed a three-sector model that splits the production function into three sectors: infrastructure sector, the export sector and
1Negative elsaticites coefficients imply overpovisioning of public infrastructure capital in the economy.
2
Agenor and Montiel (1999, p.679) explain that “the presence of externalities implies that if, say, one firm doubles its inputs, the productivity of the inputs of other firms will also increase. Introducing spillover effects leads to a relaxation of the assumption of diminishing returns to capital”.
export private sector. The model is tested on panel of countries drawn from Africa, East Asia and Latin America. The major findings of the model are: one, both the infrastructure and the export sectors generate positive externalities to the rest of the economy. Two, infrastructure capital accumulation and export development strategy are complementary to each other.
In the second chapter, the thesis explores whether structural transformation affects the stability of demand for money and the effectiveness of monetary policy. Available evidences indicate that rapid economic growth in many African countries since the late 1990s has resulted in rapid urbanization and increased integration of the rural people into the modern (monetized) economy. The latter affects the stability of demand for money in at least in the following two ways: first, during the structural transformation process the structure of production and trade shifts in favour of the modern sectors. Therefore, the share of national output used to be produced by family labour (in subsistence agriculture) continues to be replaced by a monetized production system. This, in turn, enhances specialization and division of labour in the rural area. Second, given rural income, increase in the availability of infrastructure services such as electricity, transport and telecommunication, raise the demand for money by the rural population. Therefore, ignoring the effect of monetization implies that, in the long run, monetary policy could potentially underestimate the extent of the demand for money, and the economy could be underprovided with long-term liquidity, which could potentially be translated into real assets.
To address this challenge, the thesis develops a demand for money model that incorporates the impact of structural transformation. Applying the model on a panel of nine fast-growing African countries including Ethiopia, the chapter finds that, given aggregate national income, a-one-percent increase in rural per-capita income, a proxy to structural transformation, boosts the demand for money by more than 0.3 percent.
The third chapter provides an empirical analysis of the medium-term growth strategy in Ethiopia using a financial programming framework. The chapter identifies two major limitations on the traditional financial programming framework. First, the model relies on the neoclassical assumption that the production function exhibits constant returns to scale with capital assumed to exhibit diminishing marginal returns [Romer, 2006, Agenor and Montiel, 1999 and Chen, 1997]. This implies that factor inputs other than
labor and capital are relatively unimportant in the production function and government policies such as investment in public goods do not have growth effects. Second, the model also relies on the extreme assumption of constant income velocity of money based on the quantity theory of money [Reinhart, 1991]. This contradicts findings of the studies that argue that in high growth countries with a rapid monetization process, the income velocity of money exhibits a continuous decline [Reinhart, 1991 pp.22-23]. Therefore, before proceeding to the empirical analysis exercise, the chapter finds it necessary to modify the exiting financial programming framework based on the theoretical and empirical analyses presented in chapter 1 and chapter 2 of the thesis.
The First Five-year Growth and Transformation (GTP I) (2011-2015) announces an annual average growth target of 11.2 percent and the vision statement indicates that the government will continue to target double digit growth in the Second and the Third Five-year Growth and Transformation Plans, to make sure that the country joins the lower middle income countries club by 2025. GTP I envisaged raising the total investment to GDP ratio from 22.3 percent in 2010 to 28.1 percent by 2013. And, the ratio is expected to grow in the Second and Third Five-year Plan periods. Given the low domestic-savings-to-GDP ratio, which was 9.5 percent in 2010, the first question that comes to mind for planers and economists is how the strategy could be sustainable in the medium term. Heavy reliance on public infrastructure investment to enhance long-term growth poses significant challenges on the sustainability of the balance of payments and the government budget. In the First Five-Year Growth and Transformation Plan, annual average foreign exchange demand to finance major manufacturing and infrastructure investment projects in the private and public sectors (excluding agriculture, services, other private manufacturing sectors and government budget)3 is projected at Birr 315.4 billion (USD 24.5 billion) [Federal Democratic Republic of Ethiopia, 2010]. The latter is about four-fifth of the entire foreign exchange that the economy generated in the recent five years prior to the plan, i.e., 2006 to 2010.
Using the modified model, six alternative policy scenarios were run for the period 2014-2025 to see the responses of the various markets and to test how the policy shocks address the resource gaps. The model responds very positively to an exchange rate
3The National Bank of Ethiopia forecasted additional foreign exchange equivalent to USD 54 billion the
projected amount for major sectors is needed in GTP I period to finance agriculture sector, services sectors, government budget and other non-priority public investment projects [NBE, 2011].
shock. A 40 percent one-time devaluation increases average exports to 18.4 percent of GDP during the period from 13.8 percent in the baseline. Consequently, the average annual current account deficit shrinks to USD 9.8 billion from USD 19.9 billion and the foreign exchange gap turns to a surplus for the first four years (2014-2017) of the forecast period. The saving-investment gap also sees a significant reduction, from 9.6 percent of GDP in the baseline to 6.1 percent. The second policy scenario, which aims at increasing private savings through forced savings scheme, on the other hand, seems to be less effective, although it produces the expected results in terms of the reaction of the various markets. The third scenario, which assumes a potential GDP growth rate that is 2 percentage point lower than the baseline, also produced mixed results, although the responses in terms of the narrowing of the foreign exchange and saving-investment gaps are positive. Exports see slight declines from the baseline while average inflation rises marginally to 13.2 percent from 12.9 percent in the baseline. Lower aggregate supply growth is the main reason behind the depressed export growth and rising inflation. On the other hand, the current account deficit narrows down from USD19.9 billion in the baseline to USD15.8 billion mainly due to a decline in imports.
The simulation, which runs a lower potential growth assumption combined with a 20 percent devaluation of the Birr, gets positive responses in almost all markets considered except in the money market. Notwithstanding a 2-percentage points reduction in potential GDP growth, the 20 percent devaluation boosts exports to 15.2 percent of GDP from 13.4 percent in the baseline. Consequently, the average annual current account deficit goes down to USD 11.1 billion from USD19.9 billion. The saving-investment gap experiences a significant improvement, narrowing to 3 percent of GDP. Therefore, the lesson drawn from this exercise is that use of combined policies produces better results than taking one policy measure at a time. The contractionary monetary policy scenario that aims at addressing the money market disequilibrium by reducing the base money, also produced the expected results. Inflation goes down, resulting in a real deprecation of the exchange rate.
Last but not the least is the lesson from the sixth scenario, which solves for the equilibrium exchange rate. The simulation that targets a zero foreign exchange gap throughout the projection period has demonstrated that exchange rate is an effective policy instrument in addressing the resource gap problem. It illustrates that exchange
rate adjustment does not need to be a one-time big shock, but instead must be a carefully designed series of depreciations that takes into account the projected resource gaps in individual years. One issue with this policy conclusion is to ask whether a steady and anticipated depreciation will have the same effects as the essentially unforeseen surprise devaluation that the financial programming model presumes.
To conclude, the analysis of this chapter shows that the targets in the Growth and Transformation Plans could be achieved only if the inconsistencies observed in the baseline scenario between the targets and the policy mixes and, the consequent widening resources gaps are properly addressed. This demands the government to re-examine its current policy mixes.
Chapter 1
Public infrastructure, Exports and Growth:
The Experiences of Selected African,
Latin American and East Asian Countries
1.1 Introduction
This chapter provides an analytical framework to empirically examine the link between public infrastructure capital accumulation and economic growth. Using a growth accounting framework, a three-sector model is developed in an endogenous growth framework that allows capturing spillover effects from infrastructure to the export and non-export private sectors4 and from the export to non-export private sector. Moreover, the model helps to empirically address the puzzle that ‘why opening up of economies to international markets were successful in some countries, particularly in East Asian countries, in terms of enhancing economic growth, and not in others’ [Todaro and Smith, 2009]. Moreover, the chapter tries to draw policy lessons to Ethiopia’s Five-year Growth and Transformation Plan (GTP), which gives heavy emphasis on big pubic infrastructure projects.
4
The link between infrastructure and economic growth has been a subject of considerable interest to development economists in recent years. Since the seminal paper by Aschauer (1989), a large number of studies have been published on the area, some for and some against the infrastructure-growth nexus hypothesis.5 In recent years, literature seems to converge to the idea that infrastructure indeed has a significant growth enhancing effect [Agenor, et al 2005; Caldaron and Serven, 2003; Liamo and Venables, 2001; and Esfahani and Ramirez, 2003]. This view has, however, been contested by Neuser (1993), Poret (1991) and Canning and Pedroni (2004), which claim that recent studies have overstated the contribution of infrastructure to long-term growth6. For instance, Canning and Pedroni (2004) use an error-correction model to estimate the bidirectional causation effects. They find no effect of infrastructure on long-term growth on average, although they do find that it is not universally true for all countries and that in some there is evidence of overprovision while in others there is evidence of under-provision.
Currently, there is a general consensus that infrastructure capital accumulation enhances long-term growth. The recent debate seems to focus on whether it is quantity or quality of infrastructure that matters most in developing countries. The poor quality of infrastructure capital could arise due to either over-provisioning of infrastructure capital or underfunding of operations and maintenance expenditures [Wang, 2002; Calderon and Serven, 2008; and Adam and Bevan, 2015]. Focus on investment in new infrastructure capital, without paying proper attention to the quality of its services, ‘has a powerful macroeconomic consequence, in particular for the sustainability of growth’ [Adam and Bevan, 2015]7. Moreover, a study by Calderon and Serven (2008, p. 29) finds a “robust evidence that infrastructure development – as measured by an increased volume of infrastructure stocks and an improved quality of infrastructure services – has a positive impact on long-run growth and a negative impact on income inequality”.
5
For instance, studies by Aschauer (1989), Calderon and Serven (2004), Agenor et al (2004) and Calderon (2009) argue that infrastructure accelerates growth. On the other hand, Hulten and Schwab (1991), Hulten (1996), Holtz_Eakin and Schwartz (1995), Rodriguez (2006) and Straub et al (2008) tend to argue that infrastructure has only a transitory effect on growth.
6
These studies argue that infrastructure capital accumulation relaxes growth constraints and increases the level of output by expanding the economy’s capacity to absorb more private capital. For instance, in electric power constrained economies, improving the capacity of electric power generation allows more new private investment and also full capacity utilization of existing firms. However, long term growth remains unaffected.
7 Adam and Bevan (2015, p.ii16) argue, “what matters for growth is the sustained flow of productive services
provided by the public capital stock to private factors of production, which in turn requires that the capital stock is efficiently operated and maintained”.
This chapter also argues that infrastructure capital accumulation is not the only source of externalities that create market failure in developing countries. Using empirical analysis, it finds that export growth generates strong externalities to private sector production consistent with previous studies by Feder (1983), Kruger (1980) and Ram (1987). Concerning the contribution of exports, Kruger (1980, p.401) asserts that, “time-series and cross-section data have been pooled, so that deviations of countries’ growth from their trends have been estimated as a function of the growth of export earnings. In all of these specifications, the rate of growth of exports has turned out to be a highly significant variable”. In the late 1980s and1990s, economists, particularly those from the World Bank, advocated to developing countries, particularly to Sub-Saharan Africa, to emulate the successful experiences of East Asian countries, such as South Korea and Taiwan. So, the structural adjustment programs implemented in the 1980s and 1990s were urging the reforming African countries to open up their economies and take macroeconomic stabilization and structural policy measures that allocate resources in favour of the export sector, which is identified as the most efficient sector. The reform experiences of most of developing countries in the wake of structural adjustment programs were not, however, encouraging.
A number of studies tend to argue that, in the 1980s and 1990s, the main explanation for the growing divergence between East Asian countries, on the one hand, and African and Latin American countries, on the other, was the gap in the state of social and physical infrastructure. While East Asian countries undertook extensive infrastructure development programmes8, investment in infrastructure declined significantly in most African and Latin American countries (see the discussions in Todaro and Smith, 2009; Cudmore and Whalley’s, 2002 and Straub, 2008a). For instance, Straub (2008a, p.33) indicates, “While in recent years major Latin American countries have invested less than 3% of GDP on average [quoted from Fay and Morrison, 2007], some East Asian countries like China and Vietnam are investing around 10% of their GDP in infrastructure [quoted from Straub, Vellutini and Walters, 2008]”.
Despite the general consensus in the literature that public infrastructure capital accumulation has a growth enhancing effect, there is a gap in the available analytical
8
For instance, Todaro and Smith (2009) states that, ‘Taiwan inherited an infrastructure system far superior to that of most poor countries from the period of Japanese colonial rule (1905-1945). And, the Taiwanese government supplemented this by undertaking extensive infrastructure development program in the 1950 and 1960s’.
macro frameworks to test the conjecture. Particularly, the existing analytical frameworks are not capable of incorporating externalities generated from more than one sector9. Therefore, this chapter tries to fill this gap by providing theoretical and analytical frameworks that explain the presence of complementarities between the three sectors - the infrastructure, the export and the private domestic output sectors.
The remaining part of the chapter is organized as follows: section 1.2 presents the theoretical framework for the three-sector model. Section 1.3 analyzes limitations of the existing analytical frameworks. The structure and theoretical foundation of the three-sector model is presented in section 1.4. Section 1.5 and section 1.6 describe data sources and methodology of estimation, respectively, while section 1.7 presents the estimation results. Finally, the chapter concludes by giving summary and policy implications in section 1.8.
1.2 Theoretical Framework
1.2.1 Infrastructure-Economic Growth Nexus
Recently, growth literature on developing countries has shown considerable interest in analyzing the role of public infrastructure capital accumulation on economic growth. A number of studies argue that investment in public infrastructure boosts private sector productivity, and entice the private sector to accumulate more capital.
Wang (2002) categorizes the effects of infrastructure on aggregate output into three. First, infrastructure services enter the national accounts calculation as measures of final product such as electricity, water, transport and communication services. Second, public infrastructure and private factors of production have a high degree of complementarities. The provision of infrastructure services such as electric power, road network and telecom services enhances the productivity of land, labour and physical capital. Agenor (2005, p.6) argues that “by raising the marginal productivity of private inputs (both labour and capital), public infrastructure raises the perceived rate of return
9 The existing theoretical and analytical frameworks fail to recognize the inter-sector spillover effects, particularly the
presence of complementarities between the infrastructure and the export sectors. As a result, it becomes difficult for policy makers to design policies that enhance the inter-sector spillover effects and give particular focus on the sector that produces optimal results.
on, and increases the demand for, physical capital by the private sector”. This leads to higher accumulation of capital in the economy [Wang, 2002 and Straub 2008a].
The third channel is the positive externalities that public infrastructure generates to private sector output10, as argued in the new growth theory. As a result, the aggregate production function exhibits diminishing returns to capital and increasing returns to scale [Agenor and Montiel, 1999 and Acemelugu, 2009]. Growth literature treats infrastructure as a public good, which has general characteristics of being non-rival and non-excludable [Agenor, 2005]. One of the distinguishing features of public infrastructure from private capital is that provision of its services is subject to market imperfection and, therefore, the accumulation and operation of infrastructure capital needs government intervention. Ramirez and Esfahani (1999, p.5) argue, “Infrastructure services often entail economies of scale due to network externalities. And, cost recovery from users tends to be more difficult and inefficient because often the marginal cost is declining, the services are viewed as basic needs (e.g. water), or exclusion of non-paying users is too costly (e.g. urban streets and rural roads).”
In a purely competitive economy, the presence of such externalities leads to an underinvestment in infrastructure capital because private agents do not take into account the external benefits of infrastructure capital accumulation. Therefore, for the equilibrium growth rate to be close to optimal, government needs to invest in infrastructure capital, and, thereby, reduce the production costs of the economy, particularly the private sector11 [Agenor and Montiel, 1999]. A study by Albala-Bertrand and Mamatzakis (2004) on the Chilean economy finds that an increased infrastructure capital reduces the production cost of the economy, thereby increasing productivity. Moreover, Easterly and Servén (2003) argue that the growing divergence between East Asia and Latin America could be attributed to the growing gap in infrastructure investment between the two regions. They found that public infrastructure investment declined significantly in a number of Latin American countries in the 1980s and 1990s due to fiscal adjustments.
10Agenor and Montiel (199, p.679) explain that “the presence of externalities implies that if, say, one firm doubles its
inputs, the productivity of the inputs of other firms will also increase. Introducing spillover effects leads to a relaxation of the assumption of diminishing returns to capital”.
11
As an intermediate input public infrastructure services enters into the private sector production and enhances the productivity of all other inputs [Agenor, 2005 and Caldaron and Serven, 2003]. For instance, an expansion in road networks reduces commuting time thereby enhancing labour productivity indirectly; reduces the cost of transporting goods to and from ports or other towns, and improves private capital durability [Straub, 2008a].
1.2.2 Exports-Economic Growth nexus
In the late 1970s and 1980s, even before the advent of the new growth theory and infrastructure-growth nexus starts to gain wider acceptance in the literature, export growth and out-ward oriented economic policies began to arouse the interests of economists, particularly the World Bank, following the success stories of East Asian countries such as South Korea and Taiwan, and the failures of import substitution strategies in most Latin American and African countries [Clarcq, et al, 2006; Rodríguez, 2006; Bruton, 1998; Krueger, 1980; Chenery, 1986; and Feder, 1983; and Todaro and Smith, 2009]. The central arguments in favour of export-growth linkage are: first, there are differences in the marginal productivities of factor inputs between the export and non-export sectors. Countries that follow policies that favour exports tend to have closer-to-optimal resource allocation and higher rates of growth of national income. Competitive pressures in the international market make them spend a significant portion of their resources on innovation and R&D: Caldera (2009), using panel data analysis on Spanish manufacturing industry, found that after controlling for size, temporal and industry differences, exporters appear to spend more in innovation (20 percent) than non-exporters, and introduce more product innovations (13 percent) and process innovations (7 percent).
Secondly, apart from factor allocation effect, exports also generate externalities to the rest of the economy by facilitating “development of efficient and internationally competitive management, the introduction of improved production technique, training of higher quality labour, steadier flow of improved inputs, etc” [Feder, 1983 p.61]. Clercq, et al (2006, p.40), using unbalanced dataset for 34 countries for the period from 2002 to 2005, found that “entrepreneurs’ export orientation functions as a catalyst for the emergence of new businesses within a country’s borders, and that such export orientation by itself is influenced by a country’s levels of outward foreign direct investment (FDI), export and import”. In fact, in developing countries, the externalities would be more through technology adaption and reverse-engineering than through invention of new ideas [Grossman and Helpman, 1991].
Thirdly, countries with export-oriented economic strategies contribute to economic growth by offering greater economies of scale due to enlargement of the effective size of the market (Ram, 1987). This in turn widens market opportunities to non-export
sectors and allows them to enjoy all other benefits of economies of scale such as improved managerial skill, specialization and division of labour [Feder, 1983].
Fourthly, export oriented policies increase the rate of growth of domestic savings12 by increasing corporate savings and encouraging governments of developing countries to adopt prudent macro-economic policies that boost personal savings. A sustainable increase in the rate of growth of exports implies a continuous improvement in the country’s competitiveness in the international market (thereby, profit margins of firms increase). Second, retaining a competitive position in the international market entails government commitment to maintain macro-economic stability through prudent monetary and fiscal policies. For instance, Krueger (1980 p.403) argues, “... an export-oriented strategy imposes constraints on policy makers. Policy makers receive feedback in a relatively short time period as to the cost of their policies”. There is now a general consensus that the most important reason for the East Asian economies success is the adoption of an export oriented industrial strategy [Chen, 1997; Todaro and Smith, 2009; and Feder, 1983]
1.2.3 Infrastructure-Export Performance-Growth Nexus
In growth literature, the link between infrastructure capital accumulation and export growth is less controversial than the link between infrastructure and growth or exports and growth [De, Khan and Chaturvedi, 2008; Fedderke and Bogetic, 2006; and Limao and Venables, 2001]. But, what has not been explicitly dealt with in the literature is the presence of complementarities between infrastructure capital accumulation and export growth and their role in realizing optimal long-term growth. The complementarities between infrastructure capital and export growth strategy arise from the necessity to exploit the opportunities of economies of scale and scope. Infrastructure, as has been described in section 1.2.1 above, increases the productivity of factor inputs and generates additional externalities to private firms through improved transport and communication network, lower transport and financial transaction costs and creating
Domestic savings is a reflection of the performance of the current account balance of the BOPs: X-M = (S-I) + (T-G). The identity is derived from the domestic aggregate demand and aggregate supply relationships: C+I+G+X-M = C+S+T, where
X is exports of goods and services, M is imports of goods and services; S is private savings; I is private investment; T is government total tax revenue; G is government total expenditure; Yd is aggregate demand; and Ys is aggregate supply.
greater economies of scale for private firms [Straub, 2008a]. In developing countries, with a narrow domestic market, the benefits of infrastructure capital could not be fully utilized and translated to long-term growth benefit if the countries are not ready to take advantage of the wider market opportunities available outside their borders.
A number of studies confirm that investments in transport, ports, electricity and/or telecommunication reduce trade and transaction costs thereby enhancing a (developing) country’s participation in international trade and accelerating regional integration efforts [De, Khan and Chaturvedi, 2008; Djankov, Freund and Pham, 2006; Fedderke and Bogetic, 2006; and Limao and Venables, 2001]. For instance, Limao and Venables (2001), using a cross-section model, found that a 10-percentage-point increase in transport costs typically reduces trade volume by approximately 20 percent.
In fact, as a strategy, improvements in transport, telecommunication and/or port infrastructure are more effective in terms of making the country open to international trade than the traditional trade liberalization measures such as tariff and non-tariff barrier reduction and exchange rate adjustments in developing countries [De, 2007; Das and Pohit, 2006; Cudmore and Whalley, 2002; and Djankov, Freund and Pham, 2006]. The study by Cudmore and Whalley’s (2002) has found that trade liberalization, before relaxing major trade-related infrastructure constraints, such as transport and ports infrastructure, is welfare worsening13. These findings imply that in developing countries where transport and logistics costs make up a significant portion of production costs, an export growth strategy, without an adequate strategy to address deficiencies in domestic infrastructure services, could not make exports successfully competitive in the world market. Citing World Bank (2001), De (2007, p.3), discusses that for “the majority of Sub-Saharan African countries, Latin American and Caribbean, and a large part of Asia, transport cost incidence for exports is five times higher than tariff cost incidences”14
. Moreover, Limao and Venables (2001) estimate that intra-Africa transport costs are 136 percent higher than predicted by a standard gravitational model, and 59 percent of these costs is attributed to poor infrastructure.
13This goes with Rodrik’s (2006) argument that reforming countries have to undertake serious diagnostic measures,
and prioritize the reform areas. Referring to the East Asian Development experience, hesuggests that developing countries need to identify the most binding constraints and work with that first.
14
Rodriguez (2006) also finds that despite market-oriented reforms during the 1980s and 1990s, disparities between the incomes of poor and rich countries continue to widen. Using empirical evidence, he asserts that decline in infrastructure investment that has occurred in many developing countries in the 1980s and 1990s was one of the major explanations for this great divergence in world incomes. All these imply that there are strong complementarities between infrastructure and export growth. Therefore, an export growth strategy, without infrastructure development policies or vice versa, would produce sub-optimal results, and is expected to be less successful in enhancing long-term growth.
1.3 Limitations of Existing Analytical
Frameworks
1.3.1 A One-Sector Growth Regression Model
Most macro literature employ a one-sector production function similar to equation (1.1) as a framework to analyse the contribution of infrastructure to growth [Straub, 2008a; Straub, et al 2008b; Esfahani and Ramirez, 1999; Button, 1998; Canning and Pedroni, 2004].
Y = AGα Lβ K1-α-β ... 1.1
where Y is real aggregate output, K is the (non-infrastructure) aggregate capital stock, L the labour force, G the infrastructure capital stock, and A is a parameter that captures factors affecting the level of technology or what is called exogenous technical progress; and α, β Є (0, 1). Thus, the production function exhibits constant returns to scale in all factors [Agenor and Montiel, 1999].
Multiplying equation (1.1) by K/K and collecting similar terms together, we get the following equation [Agenor and Montiel, 1999].
Y = A(G/K)α (L/K)βK... 1.2
At the steady-state, (G/K) and (L/K) are constant. Therefore, output exhibits linearity in the stock of private capital and, therefore, the production function exhibits constant returns to scale in all factors of inputs – including G [Agenor and Montiel, 1999]. In
equation (1.2), all factor inputs are viewed as some form of reproducible capital (human and physical capital) with an AK-type technology. In this framework, infrastructure has labour and capital augmenting effect.
The above framework is subject to the following two limitations: One, the model captures only the direct (factor productivity effects) of infrastructure capital accumulation. Capturing the indirect (externalities) effect requires making total factor productivity (or the technical progress term A) as a function of externalities such as road and power network, use of improved technology, and economies of scale, among others. However, these externalities are difficult to incorporate in a one-sector production function framework because capturing externalities requires splitting the production functions between the sector that generates externalities and the sector that benefits (from the former). This is because outputs of the sector that generates externalities would be used as additional factor inputs in production function of the sector which benefits from the externalities15 [Wang, 2002; Feder, 1983 and Agenor and Montiel, 1999].
Two, inherent in the one-sector production function is the assumption that factor (labour and capital) productivities are equal across sectors in the economy. So, the framework does not accommodate factor reallocation externalities between sectors. A number of studies argue that factor reallocation to the most productive sectors could be an important source of growth in least developed countries.
1.3.2 The Growth Accounting Equation
Taking total derivative of equation (1.1), we can derive the following growth accounting equation:
dY/Y = α*dG/G + β*dL/L + (1-α-β)*dK/K... 1.3 Then, by adding a constant and an error term, we can use equation (1.3) for empirical analysis as follows:
dYt/Yt = α0+ α1*dGt/Gt+ α2*dLt/Lt+ α3dKt/Kt + ut... 1.4
15
When both the direct and indirect effects of infrastructure capital are captured, the production function exhibits increasing returns to scale, instead of constant returns to scale [Agenor and Montiel, 1999].
α1 is the elasticity of output with respect to public infrastructure, α2 is the elasticity of output with respect to labour and α3 is the elasticity of output with respect to private capital. The elasiticities are estimated using data on the shares of income that go to the respective factor inputs. From equation (1.4), we can derive the Solow residual (Rt) as follows:
Rt = dYt/Yt – (α0+ α1*dGt/Gt+ α2*dLt/Lt+ α3dKt/Kt) ... 1.5 In equation (1.5), R measures anything but the private returns of factor inputs, i.e., G, L and K, such as economies of scale, export growth, human capital development, and other factors that affect technological changes [Chenery, 1986; Romer, 2006; Feder, 1983; and Agenor and Montiel, 1999]. The large unexplained residuals16 in growth accounting, and the empirical challenge that countries actually grow at a speed higher than that could potentially be predicted by the neo-classical model for a longer period, and growing divergence of growth between countries17 have been mentioned as evidences of the presence of externalities that could not be explained by a change in the quality or quantity of factors of production18 [Agenor and Montiel, 1999].
Quite a number of studies apply a growth accounting technique to know the proximate determinants of growth, particularly the contributions of factor inputs such as labour, capital and other inputs over some period, without going deeper into the analysis of what causes the changes in the determinants themselves19 [Romer, 2006; Arslanalp et
16Harberger (1989, p. 94) explains that “the residual was initially thought of as a coefficient of technical advance
(since it effectively measured the growth of output per unit of input), but it was quickly recognized to be a composite of the effects of many different foreces: (i) improvements in the quality of labour through education, experience, and on the job training; (ii) reallocation of resources from low-productivity to high-productivity uses, either through normal market forces, or through the reduction of barriers or distortions; (iii) expoitation of economies of scale; and (iv) improved ways of combining resources to produce goods and services, not just at the level of new machines or processes, but also by relatively mundane adjustments at the level of the factory or the farm.”.
17
Agenor and Montiel (1999, p. 669) states that “in 1960 average real per capita incomes in Asian and African countries were roughly similar. Thirty years later, income per capita had more than tripled in Asia while it had risen only moderately in Africa”.
18Straub (2008b, pp 4-5) describes that “An important feature of East Asia’s infrastructure history has been the
construction of major transport links between cities. Korea’s Seoul-Pusan highway built in the 1960s, Malaysia’s road network built in the 1970s and 1980s, China’s rail network and more recent express ways development, and Vietnam’s Hanoi-Ho Chi Minh city and Hanoi-Haiphery have all enlarged and integrated domestic markets, as well as providing the logistical connections for access to port and international markets. Further investment in these transport networks may not give the same boost to productivity, but it is possible that the larger markets they facilitate the exploitation of economies of scale within firms, the production of more specialized skills match between employers and workers.”
19 The growth accounting framework has been widely applied in individual country growth analysis and
cross-country growth comparisons [Arslanalp et al, 2010; and Straub et al, 2008;Young, 1995; Feder, 1983; Ram, 1987; Agenor and Montiel, 1999; Wang and Yao, 2003; and Wang, 2002].
al, 2010; and Straub et al, 2008]. Romer (2006) argues that growth accounting does not get at the underlying sources of growth. It only examines its immediate determinants. He argues that assuming an economy on its balanced path described in the Solow growth model, it is known that, in this case, growth is coming entirely from growth in A. However, growth accounting attributes only a fraction to the residual (R). The other fractions are attributed to growth in factor inputs20.
1.4 Structure and Theoretical Foundation of the
Three-sector Model
This section presents the structure and theoretical foundations of the three-sector model that is believed to address the shortcomings of existing macro approach growth accounting models. The model is developed following Feder (1983) and Wang (2002) two-sector production function approaches. The main assumptions of the model are: First, infrastructure and export sectors have spill-over effects. While infrastructure generates externalities to exports and non-export sectors through productivity and capital accumulation effects, exports generate externalities to the non-export private sector through productivity and capital accumulation. Two, there are productivity differences between the export sector and non-export sectors. As a result, factor allocation in favour of the export sector improves factor productivity and enhances economic growth. Third, due to positive externalities from infrastructure and export sectors, aggregate output exhibits increasing returns to scale.
Basic structure of the model is as follows:
F = F(LF, KF, GF)
X = X(LX, KX ; F)... 1.6 R = R(LR, KR,; F, X)
Y = F + R + X
where, Y is total output (GDP) at factor cost; F is infrastructure service outputs; R is non-export private sector output; X is exports of goods and services; KF and LF are private capital stock and labour inputs in public infrastructure sector respectively; KR
20
Hence, Barro (1998, p.1) argues that the growth accounting technique could be particularly useful if the fundamental determinants of that matter for factor growth are substantially independent from those that matter for technological change.