A comprehensive comparison of RNA-Seq-based
transcriptome analysis from reads to differential
gene expression and cross-comparison with
microarrays: a case study in
Saccharomyces
cerevisiae
Intawat Nookaew
1, Marta Papini
1, Natapol Pornputtapong
1, Gionata Scalcinati
1,
Linn Fagerberg
2, Matthias Uhle´n
2,3and Jens Nielsen
1,3,*
1
Novo Nordisk Foundation Center for Biosustainability, Department of Chemical and Biological Engineering, Chalmers University of Technology, SE-41296, Gothenburg, Sweden,2Novo Nordisk Foundation Center for Biosustainability, Department of Biotechnology, Royal Institute of Technology, SE-10691, Stockholm, Sweden and 3Novo Nordisk Foundation Center for Biosustainability, Technical University of Denmark, DK-2970 Hørsholm, Denmark
Received May 9, 2012; Revised and Accepted July 31, 2012
ABSTRACT
RNA-seq, has recently become an attractive method of choice in the studies of transcriptomes, pro-mising several advantages compared with micro-arrays. In this study, we sought to assess the contribution of the different analytical steps involved in the analysis of RNA-seq data generated with the Illumina platform, and to perform a cross-platform comparison based on the results obtained through Affymetrix microarray. As a case study for our work we, used the Saccharomyces cerevisiaestrain CEN.PK 113-7D, grown under two different conditions (batch and chemostat). Here, we asses the influence of genetic variation on the estimation of gene expression level using three dif-ferent aligners for read-mapping (Gsnap, Stampy and TopHat) on S288c genome, the capabilities of five different statistical methods to detect differen-tial gene expression (baySeq, Cuffdiff, DESeq, edgeR and NOISeq) and we explored the consist-ency between RNA-seq analysis using reference genome and de novo assembly approach. High re-producibility among biological replicates (correl-ation0.99) and high consistency between the two platforms for analysis of gene expression levels (correlation 0.91) are reported. The results from differential gene expression identification derived
from the different statistical methods, as well as their integrated analysis results based on gene ontology annotation are in good agreement. Overall, our study provides a useful and comprehen-sive comparison between the two platforms (RNA-seq and microrrays) for gene expression analysis and addresses the contribution of the dif-ferent steps involved in the analysis of RNA-seq data.
INTRODUCTION
In the field of functional genomics, transcriptome analysis has always played a central role for unraveling the com-plexity of gene expression regulation. After decades of extensive investigations based on the characterization of genome-wide gene expression through oligonucleotide-based array technologies, transcriptomics has gained new momentum, thanks to the advent of Next Generation Sequencing (NGS). NGS has enabled high-throughput of nucleic acid molecule sequencing such as DNA (DNA-seq) and RNA (RNA-seq) (1). The establishment of RNA-seq as an attractive analytical tool in trancriptomics, led to a fast development of this tech-nology, decreasing the running cost and offering the pos-sibility to uncover novel transcriptional-related events. Compared with hybridization-based transcriptome studies, where only difference in expression of the ORFs can be addressed, RNA-seq allows to analyze
*To whom correspondence should be addressed. Tel: +46 031 772 3804; Fax: +46 031 772 3801; Email: nielsenj@chalmers.se The authors wish it to be known that, in their opinion, the first two authors should be regarded as joint First Authors.
ßThe Author(s) 2012. Published by Oxford University Press.
This is an Open Access article distributed under the terms of the Creative Commons Attribution Non-Commercial License (http://creativecommons.org/licenses/ by-nc/3.0), which permits unrestricted non-commercial use, distribution, and reproduction in any medium, provided the original work is properly cited.
genome-wide transcription, thus providing additional features such as, analysis of novel transcripts, smRNA, miRNA and alternative splicing events. Furthermore, RNA-seq allows the analysis of transcribed but non-translated regions that may act in regulating gene expres-sion, e.g. UTR (2). Other advantages of RNA-seq compared with microarrays are its high resolution, better dynamic range of detection and lower technical variation (3). Nevertheless, microarrays represent a well established technology and have been widely used in the last decades, leading to availability of extensive informa-tion. More than 900 000 published microarray assays are available in repository databases like Gene Expression Omnibus or ArrayExpress and have been shared within the research community.
To date, several studies comparing RNA-seq and hy-bridization arrays have been performed. Comparison between the two techniques have been reported in
Candida parapsilolis(4),Candida albicans(5), on the fission
yeast Schizosaccharomyces pombe (6), Drosophila
mela-nogaster (7), Caenorhabditis elegans (8), in mice tissues
(8,9) and in several human cells and cell lines (5,10–15). Several studies based on RNA-seq analysis of the well known eukaryotic model microorganism Saccharomyces
cerevisiae, have been performed (16–20) and evaluation
of the performances of different library construction methods for RNA-seq was also addressed using S.
cerevisiaeas a model organism (19). The reported
correl-ations between microarrays and RNA-seq in detecting normalized expression signal are in different ranges (1), suggesting possible inconsistency of different processing methods. Higher correlation is overall observed in differ-ential gene expression (DGE) analysis; however, up to date, a comprehensive description of the performances of RNA-seq data in detecting DGE has not been ad-dressed in detail.
There are two major approaches to process RNA-seq data from short reads in order to identify DGEs (21). With the first approach, which is the most widely used in RNA-seq analysis, reads are mapped onto a reference genome (22,23) and the results of gene expression level are dependent on the aligner used in the analysis. Recently, different aligners and algorithm for RNA-seq analysis were compared, based on their mapping quality and splice junctions (24). The second approach is de novo
assembly of the short reads (25–27) that does not require a reference genome. Recently, the performances of different transcriptome assemblers have been compared, based on their capability to identify full-length transcripts and on computational demand (28), however, statistical analysis for DGE identification and comparison between the two approaches was not covered.
In recent years, many statistical methods have been de-veloped to identify DGE through different statistical models based on discrete probability distribution. The edgeR method proposed by Robinson et al. (29) has been developed based on an overdispersed Poisson model to explain the variation in the read count data, then the evaluation of the differences across transcripts are estimated using Empirical Bayes method. Trapnell
et al. (23) presented the Cuffdiff method that relies on
beta negative binomial model to estimate the variance of the RNA-seq data for DGE analysis by t-like statistics from FPKM values. In addition, different transcript isoforms can also be evaluated for their differential expres-sion using Jensen Shannon entropy. Anders and Huber (30) showed that negative binomial was superior for esti-mation of variability in read count type data and imple-mented the method as a DESeq package showing better results in DGE identification, when compared their method with edgeR. Following this, Hardcastle and Kelly (31) proposed another algorithm to identify DGE from a count data based on the combination of negative binomial distribution and Empirical Bayes approach to estimate posterior probability of DGE. This method also provides the ability to analyze complex experimental setups that can be useful for several biological applica-tions. Last, Tarazona et al. (32) proposed the NOISeq method based on non-parametric statistics and empirical models on the noise distribution of count data, and this method was shown to be non-sensitive to the sequencing depth of the data. In addition, this method also has a better control of false discoveries. The development of several statistical methods indicates the maturity in using RNA-seq data for transcriptomics. However, a thorough comparison of DGE analysis among different methods is required in order to increase the understanding of the dif-ferent steps involved in the analysis of RNA-seq data.
We thus undertook a study with the objective to evaluate the contribution of different factors affecting the detection of gene expression levels during the several steps involved in analysis of RNA-seq data and compare the capability of different statistical methods to capture DGE. Figure 1 provides an overview of our study. We performed RNA-seq data from the cultivations of S.
cerevisisae under two different metabolic conditions. For
each condition, in parallel, we also performed traditional transcriptome analysis based on the microarray platform and, additionally, we sequenced the genome (DNA-seq) of the strain from the same initial culture in order to detect eventual genetic variance such as single nucleotide vari-ations (SNVs) and insertions–deletions (indels). Whereas previous genome-wide transcriptomic studies using RNA-seq of S. cerevisiae were based on the reference strain S288c, we based our analysis on the widely used laboratory strain CEN.PK 113-7D, as this allowed us to further investigate the influence of genetic variation on the gene expression levels estimations using the different methods. We first address the impact of different aligners in detecting DGE: Gsnap (33), Stampy (34) and TopHat (35) and successively evaluate the impact of using five different statistical methods: (i) baySeq (31), (ii) Cuffdiff (23), (iii) DESeq (30), (iv) edgeR (25) and (v) NOISeq (32). Additionally, we compared the results obtained with the ‘reference genome method’ with the de novo assembly using Trinity pipeline (26). To allow for visualization of the detected transcripts, we provide a ver-satile transcriptome browser that presents the results generated within this study, and integrates previously pub-lished RNA-seq data. This transcriptome browser may serve as a platform for future RNA-seq-based transcrip-tome analysis of S. cerevisiae.
MATERIALS AND METHODS
Microbial cultivations
The S. cerevisiae strain used for this study is CEN.
PK113-7D (MATa ura3-52 MAL2-8c SUC2, provided by P. Ko¨tter, University of Frankfurt, Germany). Minimal media as previously described (36) was used for all cultivations that were performed aerobically. For batch cultivations the medium was supplemented with 20 g l1
glucose. For chemostat cultivations, a glucose concentra-tion of 10 g l1
was used to maintain carbon-limited growth. Batch cultures were performed in 1.0 l DasGip stirrer-proÕ vessels with a working volume of 0.7 l. Agitation was maintained at 600 rpm using a magnetic stirrer integrated in the BioBlockÕ, which maintained
the temperature at 30C. The aeration was set to
0.5 l min1. The pH of the medium was maintained at 5.0 by automatic addition of 2 M KOH. Temperature, agitation, gassing, pH and offgas composition were moni-tored and controlled using the DasGip monitoring and control system. Dissolved oxygen was measured with an autoclavable polarographic oxygen electrode (Mettler Toledo, Columbus, OH, USA). The effluent gas from the fermentation was analyzed for real-time determination of O2 and CO2concentration by DasGip fedbatch proÕ
gas analysis systems with the off gas analyzer GA4 based on zirconium dioxide and two-beam infrared sensor. The chemostat cultures were initiated after the residual ethanol produced was depleted. The medium described above was fed with a constant dilution rate of 0.1 h1and aeration was set to 0.5 lmin1. The working volume was kept at 0.5 l by a peristaltic effluent pump. Samples were taken
Figure 1. Study design overview. The same initial culture ofS. cerevisiaestrain CEN.PK-113-7D was used for DNA-seq (gray line) and transcrip-tome analysis to reduce technical variation and polymorphism. The strain was cultivated under two different metabolic conditions, in well controlled batch (red line) and chemostat (blue line) fermentation. From the triplicates’ cultures, samples for extraction of DNA and RNA were extracted. The extracted RNA was used, in parallel, for microarray analysis through Affymetrix platform (dash lines) and for RNA-seq (solid line). DNA-seq and RNA-seq were performed with the Illumina platform. DNA-seq data were used to identify the genetic variation (SNVs and indels) between the strain CEN.PK 113-7D and the reference strain S288 and to identify genetic variations in the microarray probes. The RNA-seq data were analyzed with the
reference mapping approach andde novoassembly approach. The results obtained with different methods were compared and cross-compared with
after a steady state (defined by constant values of CO2and
O2 in the off-gas, as well as a constant biomass
concen-tration for at least five residence periods) was achieved.
DNA extraction
Samples from DNA extraction were taken in triplicates during steady state chemostat cultivations. The with-drawal sample was immediately cooled in ice and the pellet was harvested by centrifugation at 4C, washed
with cold water and the biomass stored at 80C until
further treatment. The genomic DNA was extracted based on conventional phenol-chloroform method.
RNA extractions from cultivations
Samples for RNA extractions were taken from mid-expo-nential phase during batch cultivations and after steady state during chemostat cultivations. Samples were taken in three biological triplicates. The withdrawn sample was im-mediately cooled on ice and the pellet was harvested by centrifugation at 4C, washed with cold water and the
biomass stored at 80C until further treatment. The
total RNA was extracted from cells through mechanical disruption with glass beads, digested with DNAse and purified using the RNeasy kit (Qiagen, Hilden, Germany). The quality of the RNA was assayed using a BioAnalyzer (Agilent Technologies, Palo Alto, CA, USA). In total, 250 ng of the total RNA was used to synthesize cDNA using Affymetrix 30 IVT Express kit and
succes-sively cRNA was synthesized (Affymetrix Inc., Santa Clara, CA, USA). The same high quality RNAs were used for constructing the library that was used for sequencing.
Transcriptome analysis
For Microarray analysis, biotinylated RNA samples were fragmented and hybridized to Affymetrix Yeast Genome Array 2.0. The Arrays were washed using an Affymetrix GenChip Fluidic station 450 and scanned using a GeneChipÕ Scanner 3000 7 G (Affymetrix Inc.). CEL
files were generated using the Comand console software (Affymetrix). All CEL files were submitted to GEO database under accession number GSE37599. For RNA-seq analysis, Illumina HiSeq 2000 was used to perform paired-end sequencing of the same RNA samples of microarray using the standard Illumina RNA-seq protocol with a pair-end 100 bp under. All RNA-seq and DNA-seq data generated in this study were submitted to NCBI SRA database under accession number SRS307298
Microarray data acquisition and analysis
The CEL files were pre-processed and normalized together using Probe Logarithmic Intensity Error (PLIER) (37) and cubic spline method (38), respectively. Student’s
t-testusing linear models together with empirical Bayes was applied (39) on the normalized expression values using the limma R package. Calculated P-values were transformed to Q-values using the false discovery rate
(FDR) method to evaluate DGE between batch and chemostat cultivations.
NGS data acquisition and analysis
Pre-processing and quality assurance of the NGS reads
The raw reads form both RNA and DNA were first assessed for their quality using FASTX tool kit (http:// hannonlab.cshl.edu/fastx_toolkit). Bad quality reads (phred score <20) were trimmed using the BWA trimming algorithm (40) through the SolexaQA tool kit (41). Reads that has length >25 bp on both sides of pair-end format were keep for further analysis. All further analyses were performed based on default param-eters, the details are available in Supplementary Information. The versions of all software are also reported in Supplementary Information.
SNV and indel calling along chromosomes, ORFs and array probes
The quality reads of 150 coverage were first aligned on the reference genome ofS. cerevisiaestrain S288c using a high accuracy mapper Stampy (34) as recommended for NGS data (42). Then the SNVs and indels between the S288c and CENPK113-7 strains were identified along the chromosomes’ location using the ATLAS2 pipeline (43). Probe sequences of Yeast2 microarray were retrieved from NetAffyX then mapped on the reference genome to obtain the location of the probes along the chromosomes using Bowtie (43). The identified SNV(s) and/or indel(s) in the ORFs and microarray probes were checked for their overlap using BEDTools (44)
Transcriptome analysis using reference genome-based reads mapping
The genome sequence ofS. cerevisiaestrain S288c and its annotations were retrieved from the SGD databases and used for all analysis. Three different aligners for mapping the quality reads were chosen for this study: (i) Gsnap (33), which is a very fast mapping method, (ii) Stampy (34), which is a high sensitive mapping and (iii) TopHat (35), which is one of the most commonly used for RNA-seq analysis. The aligned records from the aligners in BAM/SAM format (45) were further examined for po-tential duplicate molecules in each record and removed using the Picard tool kit (46). After that, gene expression levels were estimated using FPKM values by the Cufflinks software (23).
Transcriptome analysis using de novo assembly of reads
The quality reads from all samples were pooled forde novo
assembly using the Trinity pipeline (26) to construct scriptional consensus contigs that can capture the tran-scriptions in both batch and chemostat cultivation conditions. The contigs were annotated against
S. cerevisiae S288c ORFs and also mapped back to the
chromosomes of S. cerevisiae S288c using GMAP (47). The quality reads of each sample were then mapped on the assembled contigs using TopHat (35). After removal of possible duplicate molecules from the aligned records by the Picard tool (46), the gene expression levels were estimated as FPKM values by the Cufflinks software (23).
Identification of differential gene expression
To identify differential gene expression between batch and chemostat cultivations, five statistical methods were employed and compared: Cuffdiff (23), baySeq (31), DESeq (30), edgeR (29) and NOISeq (32). For the last four methods, the number of reads mapped to each ORF was counted and reported using the HTseq package (30) and the output was used as input for statis-tical calculations. TheQ-value derived from all statistical methods were used to evaluate differential gene expression between batch and chemostat cultivation except for the NOISeq (32) method where probability values (Pr) were considered instead.
Gene ontology enrichment analysis
The statistical Q-values and 1Pr (for NOISeq) of the comparison between batch and chemostat condition resulted from different statistical methods were used as inputs for gene set enrichment analysis based on Gene ontology (GO) annotations. The reporter algorithm (48,49) was then employed to evaluate the functional enrichment level of each GO term. The GO terms that have reporter P-values (enrichment score) <10e4, were considered for illustration as a heatmap.
All statistical analyses and illustrations were done under R suite software.
Visualizations by genome–transcriptome browser
The details of mapped reads, SNVs, indels, microarray probes position, contigs from transcriptome de novo
assembly and gene annotations were visualized using GBrowse (50) publicly available at http://sysbio.se/Yseq .Moreover, five published RNA-seq data of S. cerevisiae
grew under normal conditions in the study of Drinnenberg
et al. (20), Levinet al.(19), Nagalakshmiet al.(16), Skelly
et al. (18) and van Dijket al. (17) were collected according
to their accession numbers SRR332049, SRR059163, SRR059177, SRR002062, SRR309119 and SRR122177. Then the reads were processed in the same way as described previously using the TopHat (35) aligner.
RESULTS
Experimental setup
In our study, we sought to evaluate different processing methods, as well as statistical methods to identify DGE and cross-compare the results with microarray analysis; for this purpose, we used as case study the transcriptome
ofS. cerevisiae laboratory strain CEN.PK 113-7D under
two different metabolic conditions: respiro-fermentative (batch) or fully respiratory (chemostat) metabolism. The metabolism of yeast under these conditions has been ex-tensively characterized and it is known that S. cerevisiae
shows significant differences in gene expression levels under these conditions. It has been previously shown that CEN.PK113-7D shows 14% genetic variation in ORFs compared with the well characterizedS. cerevisiae
strain S288c (51). Recently, the complete genome of CEN.PK 113-7D was re-sequenced and assembled by Nijkampet al.(52). They reported 33% SNV in ORFs
compared with the S288c. To further investigate the effect of genetic variation on gene expression level when reads were mapped on the reference genome of S. cervisiae
strain S288c, the same initial cell culture of yeast CEN.PK113-7D was used for DNA-seq, RNA-seq and microarray analysis. To this purpose, the strain CEN.PK113-7D was cultivated in triplicates under batch and chemostat conditions and the DNA and the RNA were extracted. The RNA from each biological replicate was used, in parallel, for RNA-seq and microarray analysis. Analyzing the RNA extracted from the same biological sample should reduce technical variation coming from sample treatment, allowing us to perform a robust comparison between the two platforms for tran-scriptome analysis and for evaluation of different process-ing and statistical methods. In this study, 35.85 million of 100-bp paired-end reads were generated for the RNA-seq analysis, corresponding to 7.17 Gb. For each biological replicate, in average of 5.97 ± 1.2 million of 100 bp paired-end reads were generated corresponding to 1.19 ± 0.24 Gb (Supplementary Table S1).
SNVs and indels between the S. cerevisiae strains S288c and CENPK113-7D
For DNA-seq, a deep sequencing of 9.68 million of 100-bp paired-end reads corresponding to more than 150 coverage of the reference genome of S288c were generated. Based on the results from DNA sequencing of CEN.PK 113-7D, we identified 28 139 SNVs and 3520 indels compared with the reference strain S288c, as shown in Supplementary Table S2. About 61% of the total detected SNVs and 22% indels were found on the known coding regions. These correspond to around 34.35% and 5.07% of the ORFs containing SNV(s) and indel(s), respectively, in agreement that with the results recently reported by Nijkamp et al. (33.29 and 5.38% of ORFs containing SNVs and indels, respectively) (52). Nevertheless, when comparing the genome of the two strains, we found a higher genetic variation than previ-ously identified by Oteroet al. (51) probably as a conse-quence of deeper coverage and longer reads that were used in our study, as well as in Nijkamp’s study. To explore the effect of the genetic variations on microarray hybridiza-tion, we mapped all the designed probes on the reference genome, identifying 2472 probes with SNVs and 119 with indels. As a consequence, reduced or even lack of RNA hybridization on these probes might lead to an altered signal measurement through microarray analysis.
Sample-wise and gene-wise correlation of RNA-seq analysis with the reference genome approach
The reads obtained from sequencing were mapped on the reference genome ofS. cerevisaeS288c. For this purpose, the performances of three different aligners for read-mapping, TopHat (35), Stampy (34) and Gsnap (33), were evaluated and the results obtained were compared with microarray data. The rate of alignment based on our computing systems (Xeon E5520, 2.27 GHz) is ap-proximately 3511, 1762 and 315 reads/second for Gsnap, TopHat and Stampy, respectively. On average, >96% of
the high quality reads can be mapped on the reference genome by all three aligners (Supplementary Table S3). To assess the capabilities of the different aligners, we determined pairwise correlations both based on normalized expression levels and fold-changes as shown in Figure 2A and B, respectively. In Figure 2A the pairwise correlation between each biological replicate is shown based on the expression level. Here, it is possible to observe a high reproducibility among biological repli-cates with both microarray and RNA-seq platforms, indicated by a Pearson correlation 0.98. Moreover, when comparing the results among different aligners for the same biological condition, a Pearson correlation0.94 can be obtained. These results are in good agreement with previous works that reported high reproducibility among technical replicates of RNA-seq (Pearson correlation values>0.95) (5,11,15) and biological replicates (Pearson correlation values >0.82) (4). When comparing the per-formances of the two transcriptomics platforms to identify expression levels based on intensity, we found similar results (Pearson correlation 0.81), in agreement with previous report by Levin et al. (19). Interestingly, the cross-platform correlation values showed more consistent results than the correlation from comparison with differ-ent microarray platforms (8,53–55).
To evaluate the capability of the two platforms to capture the different response of gene expressions between the two conditions, we also performed a fold-change-based comparison. In Figure 2B, the scatter plots of fold changes generated with different aligners are shown. The remarkably high correlation values found (Pearson correlation 0.99), show the robustness of RNA-seq data, in agreement with what was previously observed (5,11,15). Interestingly, the value of the cross-platform correlation was improved by using fold changes (Pearson correlation0.93). Using linear regres-sion fitted on cross-platform fold changes, we obtained a model of RNA-seq = 1.29Microarray+0.25 with
P<1e16. This indicates an improvement in the dynamic range of RNA-seq data, compared with micro-array data, of 30%. Interestingly, the impact of potential duplicates arising from PCR amplification during library construction procedure, which were contained around 6–16% of total reads (Supplementary Table S3), was also examined, showing to have a minor influence on the correlation results (Supplementary Figure S1). Besides analyzing the correlation between samples, we evaluated whether gene-wise correlation across samples is dependent on their expression levels. The plot of gene-wise correlation between RNA-seq and Microarray data based on their average gene expression level is illustrated in Figure 2C. Most of the genes (70%) have a cross-platform correlation >0.7 as observed in the density plot. The distribution of the average gene expression signal of RNA-seq and microarray data, shown on the boxplots, also supports the better dynamic range of the RNAseq data. Interestingly, we found that cross-platform correlation is random and independent of the level of gene expression, meaning that a poor correlation does not imply that a certain gene is poorly expressed and
vice versa.
Evaluations of DGE of RNA-seq data through different statistical methods and cross comparison with
microarray data
As RNA-seq can be applied to capture differential expres-sion, we evaluated the impacts of using different reads– aligners and different statistical methods on the identifica-tion of DGE from RNA-seq data and performed a cross-comparison of these results with the DGE obtained using microarray analysis. The number of DGE derived from the results from the three different aligners and five different statistical methods (DESeq, edgeR, baySeq, Cuffdiff and NOISeq) at a specific cut-off, i.e. Q-value <1e5 for all methods and
Pr>0.875 for NOISeq, are provided in Supplementary Table S4. It is observed that edgeR identified more DGE than the other methods at the same condition. The potential PCR duplication has minor influence on the DGE identification. The performances of the five different statistical methods for DGE identification were compared based on the mapping results obtained with the Stampy aligner as a priori input for the statistical calculation. The comparison is illustrated in a Venn’s diagram of identified DGE between the two different biological conditions using each method and is shown in Figure 3A. In total, 963 genes were commonly identified as DGE by all the five methods; however, edgeR uniquely identified more DGE than Cuffdiff, baySeq, DESeq and NOISeq. To evaluate whether there is good consistency between the different statistical methods for analysis of RNAseq data also for other biological systems, we evaluated different methods for analysis of published data from mammalian experi-ments (5,56). The consistency as found in our yeast data set (Figure 3A) was still valid in the mammalian systems as shown in Supplementary Figure S4.
Next, we cross-compared the DGE identified from RNA-seq data (Cuffdiff, baySeq DESeq and NOISeq) with DGE identified through microarray analysis. Successively, in Figure 3B it is possible to observe that, whereas 828 genes were commonly identified as differen-tially expressed, only 145 genes could not be captured as DGE with RNA-seq analysis through the different statis-tical methods. On the contrary, 135 genes were commonly identified through RNA-seq with all statistical methods but not captured by microarray analysis. At this point, we sought to further address the impact of different aligners (Gsnap, Stampy and TopHat) on DGE identification.
Reads processed with the three aligners were analyzed using Cuffdiff and cross-compared with the microarray data. In Figure 3C, it is possible to observe that the DGE identified from the read-mapped results based on Stampy and TopHat aligners show high consistency. Impressively, 1130 DGEs were commonly identified with both aligners and the microarray data. About 364 genes were uniquely identified as DGE from microarray data and 512 genes (82 genes are not included in the micro-array) were commonly identified as DGE from RNA-seq data among the read-mapped result from the three aligners. Interestingly, when decreasing the stringency of the Q-value cut-off (<0.05), the number of commonly
Figure 2. Sample-wise and gene-wise correlation of transcriptome data from microarray and RNA-seq with different processing methods.
(A) Upper-right triangle matrix: pairwise correlation of different biological replicates from batch and chemostat cultivations (for microarray
analysis the normalized signals and for RNAseq analysis the FPKM valued were used). The color intensities (scale in the side bar) and the
numbers indicate the degree of pairwise correlation. (B) Lower-left triangle matrix: scatter plot based on fold changes of gene expression
(average values, batch vs chemostat). The red numbers indicate the level of pairwise correlation between different methods. On the diagonal of the triangle matrix, the distribution of fold changes of each processing methods is presented as histrograms. Array = microarray, Gsnap = process quality reads by Gsnap aligner after removal of potential PCR duplicate, n.Gsnap = process quality reads by Gsnap aligner without removing potential PCR duplicate, Stampy = process quality reads by Stampy aligner after removal of potential PCR duplicate, n.Stampy = process quality reads by Stampy aligner without removing potential PCR duplicate, TopHat = process quality reads by TopHat aligner after removal of potential
PCR duplicate, n.TopHat = process quality reads by TopHat aligner without removing potential PCR duplicate. (C) Yellow open circle, red open
triangle, cyan plus sign and blue cross sign represent the average gene expression values from microarray of batch and chemostat cultivation and from RNA-seq of batch and chemostat cultivation, respectively. On the left, the distribution of average expression values from microarray and RNA-seq analysis is presented as orange boxplot and dark cyan boxplot (combined batch and chemostat cultivation conditions), respectively. At the bottom, the distribution of the gene-wise correlation values is presented as a white boxplot and density plot.
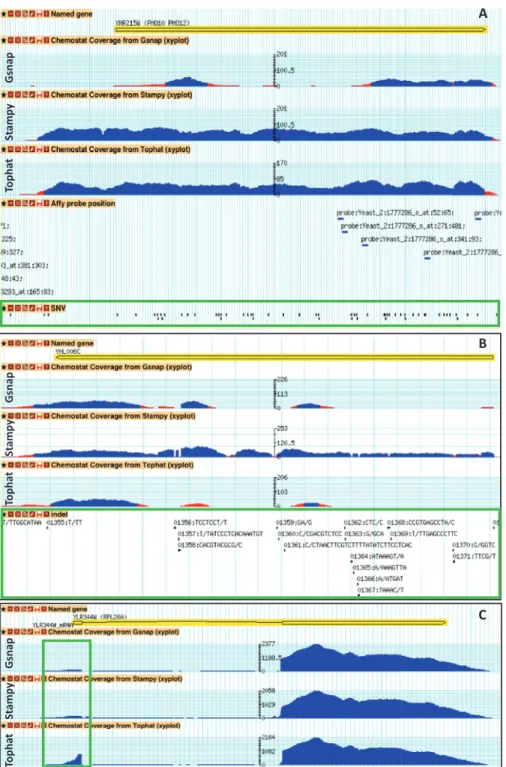
identified DGE increases to 49% (purple portion of the pie charts of Figure 3C) of the 364 genes uniquely identified from microarray data and 54% (purple portion of the pie charts of Figure 3C) of the 512 genes that uniquely identified from RNA-seq. Low expression genes also caused inconsistencies in DGE identifications, 6–7% (green portion of the pie charts of Figure 3C) of uniquely identified DGE from only microarray data (364 genes), the common of the three aligners (512 genes) and Gsnap aligner (278 genes). Around 17–18% (dodger blue portion of the pie charts of Figure 3C) of the inconsistencies were due to SNVs or/and indels in the microarray probes. 278 genes were uniquely identified as DGE using the Gsnap aligner, probably indicating differ-ent read-map performance compared with the other aligners. Noticeably, >36% (light gray–blue in the pie chart of Figure 3C) of the 278 genes contain SNVs or/ and indels in their ORFs, compared with the reference genome S288c. Subsequently, in Figure 4, we further address the inconsistencies by using our Transcriptome Browser that allows direct visual comparison of the per-formances of the different aligners to map ORF showing genetic variations with the reference genome of the strain S288c. An example of an ORF containing several SNVs
can be found in PHO11. In the Figure 4A, it is possible to see that Gsnap has problem to map reads in the coding region of PHO11. Only Stampy performed well in mapping reads on the ORF that contains many indels like YHL008C, as shown in Figure 4B. These results indicate superior capabilities of seed-based method when mapping reads on polymorphic region, in agreement with what previously observed (57). Figure 4C instead reports the good performance showed by TopHat in mapping small exons such RPL26A that indicates the benefit of spliced aligners.
De novoassembly versus reference mapping
An approach that can be used to sequence RNA (or DNA) when a reference genome is not available
is de novo assembly (25–28). Using this approach might
also eliminate the effects of genetic variations between the strains CEN.PK 113-7D and S288c that can potentially influence read mapping results in detecting inappropriate gene expression level estimation. For this purpose, we also evaluated the use of de novo assembly. As shown in Figure 5A, de novo assembly gave high reproducibility among biological replicates, as indicated by the Pearson correlation coefficient 0.98. The expression-based
Figure 3. Comparisons of number of DGE identified by different statistical methods of RNA-seq data and cross comparison with DGE identified
from microarray data. (A) Venn’s diagram of the comparison of differential gene expression based on RNA-seq data (result from Stampy aligner)
through five different statistical methods: Cuffdiff, DESeq, NOISeq, edgeR and baySeq. (B) Venn’s diagram of the cross comparison of differential
gene expression based on RNA-seq data (result from Stampy aligner) identified through Cuffdiff, NOISeq and DESeq method versus differential
gene expression from microarray data (see the other comparison in different method combination in Supplementary Figure S2.) (C) Venn’s diagram
of the cross comparison of DGE based on RNA-seq data identified through Cuffdiff method, using the three different aligners. The similar comparison using baySeq, DESeq, edgeR and NOISeq are provided in Supplementary Figure S3. The potential factors underlying the differences
in genes identified with each method are presented as percentages pie chart. All Venn’s diagrams were built based onQ-value<1e5 for all methods
comparison within the same platform and same sample gave a correlation0.87. Slightly reduced Pearson correl-ation values were observed when cross-comparing the FPKM values with the normalized microarray signals. Interestingly, the fold-change-based correlation increased to 0.96 and 0.91 when comparing the results fromde novo
assembly approach to these obtained when mapping to a reference genome and microarray, as reported in Figure 5B. The regression model based on fold changes
derived from de novo assembly and microarray (De novo= 1.21Microarray+0.24 with P<1e16) showed similar values to the previous regression model based on the fold changes derived with the approach based on a reference genome. When comparing the result from de novo assembly with reference genome approach (De novo= 0.96Ref. mapped+0 with
P<1e16), a minor difference can be found. Figure 5C summarizes the number of identified transcripts with the
A B C Gsnap St ampy Topha t Gsnap St ampy Topha t Gsnap St ampy Topha t
Figure 4. Coverage plots of mapped reads shows different capabilities of the three different aligners. (A) The ORF YHR215W (PHO11) contains
many SNVs on the coding region (green box). (B) The ORF YHL008C contains many INDELs on the coding region (green box). (C) The ORF
different platforms and the two different analysis approaches (reference genome andde novo). Interestingly, most of the protein coding genes in the genome can be detected by thede novoassembly approach. Only 67 genes could not be captured based on this method, as a conse-quence of their low expression (Supplementary Figure S5). The results from statistical analysis in capturing DGE showed good agreements when comparing the results obtained by processing RNA-seq data through de novo
assembly with reference genome approach and micro-array, as shown in Figure 5D. The comparison of DGE
identification results derived from the five different statis-tical methods (baySeq, Cuffdiff, DESeq, edgeR and NOISeq) when count data from the de novo assembly approach was used as a priori input, was also in good agreement as shown in Supplementary Figure S6.
GO enrichment analysis of transcriptome data
To evaluate whether the different statistical methods provide the same biological results, we analyzed the global response of the yeast transcriptome in the shift
Figure 5. Comparisons of transcriptome analysis throughde novoassembly and reference genome mapping approach and cross-comparison with
microarray data. (A) Upper-right triangle matrix: pairwise correlation of different biological replicates from batch and chemostat cultivations (for
microarray analysis the normalized signals and for RNA-seq analysis, the FPKM values were used). The color intensities (scale in the side bar) and
the numbers indicate the degree of pairwise correlation. (B) Lower-left triangle matrix: scatter plot based on fold changes of gene expression (average
values, batch versus chemostat). The red numbers indicate the level of pairwise correlation between different methods. On the diagonal of the triangle
matrix, the distribution of fold changes of each processing method is presented as histograms. Array = microarray,De novo=De novoassembly
approach, Ref. mapped = Reference genome reads mapping approach. The RNAseq by both the approaches were processed quality reads by
TopHat aligner with removing potential PCR duplicate. (C) Comparisions of number of transcripts detected by different approach (D) Comparison
of number of DGEs identified by different transcriptome analysis of RNA-seq data and cross-comparison with differential gene expression identified from microarray data.
from growth at glucose excess conditions (batch) to glucose-limited conditions (chemostat). For this purpose, we used the reporter feature algorithm [Patil and Nielsen (49) and Oliveiraet al. (48)] to integrate theQ-values of detected transcripts and identify significant GO terms. The algorithm was applied both on the statistical results from the microarray data and the RNA-seq data analyzed with baySeq, Cuffdiff, DESeq, edgeR, NOISeq and based onde novoassembly (using statistical results from Cuffdiff). As shown in Figure 6, 48 significant GO biolo-gical process terms were identified with a reporterP-value cut-off of 1e4. Despite a few differences, the analysis of significant GO terms identified using the results from dif-ferent statistical methods and approaches to analyze
RNA-seq data and the results from microarray data are generally in agreement, leading to similar biological con-clusions. Although all the methods were in agreement in identifying significant GO terms related to growth (a con-sequence of the increased specific growth rate during batch cultivations), GO terms known to be relevant during fully respiratory growth are not all in agreement with the dif-ferent methods. Specifically, edgeR showed some inconsistencies in capturing GO terms associated with fatty acid beta-oxidation terms (as well as DESeq), fatty acid metabolic process and TCA cycle, whereas baySeq weakly identify increased expression of ATP-coupled proton transport and ion transport. Interestingly, the results derived from NOISeq seem to give stronger
signals that explain the known differences between batch and chemostat growth better than the results derived from the other methods.
Transcriptome browser
To enable visualization of transcriptome data and combine this with genomic information of S. cerevisiae, we designed a genome/transcriptome browser. The scriptome browser gives the possibility to visualize tran-scriptional abundance levels (coverage mapped reads) of each ORF at different cultivation conditions and compare the results obtained using different aligners. Moreover, the browser also provides the location of indel and SNV derived from the genetic differences between CEN.PK113-7D and S288c. The transcriptional contigs
from de novo assembly analysis are also represented on
the browser mapped according to their position on the chromosome. Additionally, the positions where the Affymetrix microarray probes are designed on the chromosome are also included. To allow the direct com-parison between RNA-seq data generated in this study and the transcriptomic data of different S. cerevisiae
strains sequenced in other works, we included selected published RNA-seq data into the library of the browser. The browser is publicly available at http://sysbio.se/Yseq. The detailed screen shot of the transcriptome browser is shown in Supplementary Figure S7.
DISCUSSION
In our work, we present a comprehensive comparison of different methods for analysis of transcriptome data obtained through NGS technology and we present a cross-comparison between the two mostly used platforms for analysis of transcriptomic data: RNA-seq and micro-arrays. To our knowledge, this is the first time that RNA-seq generated data from Illumina platform are compared in depth with Affymetrix microarrays. An as-sessment of the contribution of different processing steps involved in analysis of RNA-seq data is performed in our work, addressing the impact of using different read-aligners and statistical methods to obtain biologically meaningful data. A good reproducibility among biological replicates and between the different platforms was found to be remarkably high and, generally, higher than previ-ously reported (4,5,7,11,14). The inconsistencies found in DGE identification between RNA-seq and microarrays were shown to be mainly due to genetic variation found on the ORF and on the microarray probes.
Overall, the good agreement found between the RNA-seq and microarray platforms of our study can be interpreted based on two major factors. First,S. cerevisiae
is an extremely well characterized microorganism, for which high quality genomic data are available. Furthermore, a very good annotation of gene structures allowed us to map a high portion of reads on the reference genome (>95%) and hereby, to estimate accurately gene expression level. The well-annotated gene structures also benefited from the accurate design probes of microarrays. Additionally, it also has to be considered that, for our
study, we used deep sequencing of more than 5 million paired reads, enabling the coverage of a wide range of gene expression levels.
What we concluded from the approach based on reads mapping on a reference genome, is that accurately mapping is of fundamental importance to estimate gene expression level and to identify DGE. Based on our com-parison of three different aligners, Stampy, the most time-consuming of the aligners, showed the highest mapping accuracy for ORFs with high genetic variation. This capability is useful when analyzing genomes and trascriptomes of higher eukaryote, usually containing high variation in the exome (40% of total) (58,59). However, a high-speed aligner like Gsnap, which has lower mapping accuracy compared with the other aligners, is also useful for analysis massive amount of data over the reference genome that contain low poly-morphisms. TopHat appears to compromise between accuracy and speed and it also performed well at mapping reads on small exons.
Our analysis on thede novoassembly approach, showed a high consistency with reference genome approach in terms of number of detected transcripts, expression values and DGE analysis. This shows that de novo assembly of the transcriptome provides a compelling and robust approach for analysis of RNA-seq data without using reference genome. This is a benefit for organisms whose genome sequence is not available. However, de novo assembly requires a lot of computational resources (for our study to obtain contigs from de novo assembly approach, it took almost 96 h on Opteron 6200, 3.0 GHz) and more complicated in terms of post-processing of the data.
In order to address the impact of different statistical methods on the identification of DGE, we found that Cuffdiff, baySeq, DESeq, edgeR and NOISeq generated consistent results. Additionally, the results obtained based on RNA-seq data were in good agreement with micro-array data. Interestingly, edgeR identified more DGE than the other methods at the same cut-off, which might infer less control of type 1 error with this method. Using results derived from different statistical methods of RNA-seq gave similar biological interpretations as is shown in GO enrichment analysis. This result strongly supports the robustness and reliability of different pro-cessing and analysis of RNA-seq data. Furthermore, we identified high consistency between microarray and RNA-seq platforms, thus encouraging the continual use of microarray as a versatile tool for differential gene expression analysis. In conclusion, our study provides a comprehensive comparison of different methods for analyses of S. cerevisiae transcriptome based on RNA-seq data using Illumina platform, elucidating the contri-bution of the different steps involved in analysis of RNA-seq data.
ACCESSION NUMBERS
GSE37599, SRS307298, SRR453566, SRR453567, SRR453568, SRR453569, SRR453570, SRR453571 and SRR453578.
SUPPLEMENTARY DATA
Supplementary Data are available at NAR Online: Supplementary Tables 1–4, Supplementary Figures 1–7 and Supplementary Information.
ACKNOWLEDGEMENTS
The authors thank Daniel Klevebring for technical assist-ance on DNA sequencing raw data preparation. The com-putational analyses were performed on resources provided by the Swedish National Infrastructure for Computing (SNIC) at C3SE. Gothenburg Bioinformatics Network (GOTBIN).
FUNDING
European Research Council [247013]; Novo Nordisk Foundation; Chalmers Foundation; Knut and Alice Wallenberg Foundation; Bioinformatics Infrastructure for Life Sciences (BILS). Funding for open access charge: Chalmers Library.
Conflict of interest statement. None declared.
REFERENCES
1. Wang,Z., Gerstein,M. and Snyder,M. (2009) RNA-Seq: a
revolutionary tool for transcriptomics.Nat. Rev. Genet.,10,
57–63.
2. Ozsolak,F. and Milos,P.M. (2011) RNA sequencing: advances,
challenges and opportunities.Nat. Rev. Genet.,12, 87–98.
3. Wilhelm,B.T. and Landry,J.R. (2009) RNA-Seq-quantitative measurement of expression through massively parallel
RNA-sequencing.Methods,48, 249–257.
4. Guida,A., Lindstadt,C., Maguire,S.L., Ding,C., Higgins,D.G., Corton,N.J., Berriman,M. and Butler,G. (2011) Using RNA-seq to determine the transcriptional landscape and the hypoxic
response of the pathogenic yeast Candida parapsilosis.BMC
Genomics,12, 628.
5. Marioni,J.C., Mason,C.E., Mane,S.M., Stephens,M. and Gilad,Y. (2008) RNA-seq: an assessment of technical reproducibility and
comparison with gene expression arrays.Genome Res.,18,
1509–1517.
6. Wilhelm,B.T., Marguerat,S., Goodhead,I. and Bahler,J. (2010)
Defining transcribed regions using RNA-seq.Nat. Protoc.,5,
255–266.
7. Malone,J.H. and Oliver,B. (2011) Microarrays, deep sequencing
and the true measure of the transcriptome.BMC Biol.,9, 34.
8. Liu,F., Jenssen,T.K., Trimarchi,J., Punzo,C., Cepko,C.L., Ohno-Machado,L., Hovig,E. and Kuo,W.P. (2007) Comparison of hybridization-based and sequencing-based gene expression
technologies on biological replicates.BMC Genomics,8, 153.
9. t Hoen,P.A., Ariyurek,Y., Thygesen,H.H., Vreugdenhil,E.,
Vossen,R.H., de Menezes,R.X., Boer,J.M., van Ommen,G.J. and den Dunnen,J.T. (2008) Deep sequencing-based expression analysis shows major advances in robustness, resolution and inter-lab portability
over five microarray platforms.Nucleic Acids Res.,36, e141.
10. Bradford,J.R., Hey,Y., Yates,T., Li,Y., Pepper,S.D. and Miller,C.J. (2010) A comparison of massively parallel nucleotide sequencing with oligonucleotide microarrays for global
transcription profiling.BMC Genomics,11, 282.
11. Asmann,Y.W., Klee,E.W., Thompson,E.A., Perez,E.A.,
Middha,S., Oberg,A.L., Therneau,T.M., Smith,D.I., Poland,G.A.,
Wieben,E.D.et al. (2009) 3’ tag digital gene expression profiling
of human brain and universal reference RNA using Illumina
Genome Analyzer.BMC Genomics,10, 531.
12. Sultan,M., Schulz,M.H., Richard,H., Magen,A., Klingenhoff,A., Scherf,M., Seifert,M., Borodina,T., Soldatov,A., Parkhomchuk,D.
et al. (2008) A global view of gene activity and alternative
splicing by deep sequencing of the human transcriptome.Science,
321, 956–960.
13. Cloonan,N., Forrest,A.R., Kolle,G., Gardiner,B.B., Faulkner,G.J.,
Brown,M.K., Taylor,D.F., Steptoe,A.L., Wani,S., Bethel,G.et al.
(2008) Stem cell transcriptome profiling via massive-scale mRNA
sequencing.Nat. Methods,5, 613–619.
14. Fu,X., Fu,N., Guo,S., Yan,Z., Xu,Y., Hu,H., Menzel,C.,
Chen,W., Li,Y., Zeng,R.et al. (2009) Estimating accuracy of
RNA-Seq and microarrays with proteomics.BMC Genomics,10,
161.
15. Mudge,J., Miller,N.A., Khrebtukova,I., Lindquist,I.E., May,G.D., Huntley,J.J., Luo,S., Zhang,L., van Velkinburgh,J.C.,
Farmer,A.D.et al. (2008) Genomic convergence analysis of
schizophrenia: mRNA sequencing reveals altered synaptic
vesicular transport in post-mortem cerebellum.PloS One,3,
e3625.
16. Nagalakshmi,U., Wang,Z., Waern,K., Shou,C., Raha,D., Gerstein,M. and Snyder,M. (2008) The transcriptional landscape
of the yeast genome defined by RNA sequencing.Science,320,
1344–1349.
17. van Dijk,E.L., Chen,C.L., d’Aubenton-Carafa,Y., Gourvennec,S., Kwapisz,M., Roche,V., Bertrand,C., Silvain,M., Legoix-Ne,P.,
Loeillet,S.et al. (2011) XUTs are a class of Xrn1-sensitive
antisense regulatory non-coding RNA in yeast.Nature,475,
114–117.
18. Skelly,D.A., Johansson,M., Madeoy,J., Wakefield,J. and Akey,J.M. (2011) A powerful and flexible statistical framework for testing hypotheses of allele-specific gene expression from
RNA-seq data.Genome Res.,21, 1728–1737.
19. Levin,J.Z., Yassour,M., Adiconis,X., Nusbaum,C.,
Thompson,D.A., Friedman,N., Gnirke,A. and Regev,A. (2010) Comprehensive comparative analysis of strand-specific RNA
sequencing methods.Nat. Methods,7, 709–715.
20. Drinnenberg,I.A., Fink,G.R. and Bartel,D.P. (2011) Compatibility with killer explains the rise of RNAi-deficient
fungi.Science,333, 1592.
21. Garber,M., Grabherr,M.G., Guttman,M. and Trapnell,C. (2011) Computational methods for transcriptome annotation and
quantification using RNA-seq.Nat. Methods,8, 469–477.
22. Mortazavi,A., Williams,B.A., McCue,K., Schaeffer,L. and Wold,B. (2008) Mapping and quantifying mammalian
transcriptomes by RNA-Seq.Nat. Methods,5, 621–628.
23. Trapnell,C., Williams,B.A., Pertea,G., Mortazavi,A., Kwan,G., van Baren,M.J., Salzberg,S.L., Wold,B.J. and Pachter,L. (2010) Transcript assembly and quantification by RNA-Seq reveals unannotated transcripts and isoform switching during cell
differentiation.Nat. Biotechnol.,28, 511–515.
24. Grant,G.R., Farkas,M.H., Pizarro,A.D., Lahens,N.F., Schug,J., Brunk,B.P., Stoeckert,C.J., Hogenesch,J.B. and Pierce,E.A. (2011) Comparative analysis of RNA-Seq alignment algorithms and
the RNA-Seq unified mapper (RUM).Bioinformatics,27,
2518–2528.
25. Robertson,G., Schein,J., Chiu,R., Corbett,R., Field,M.,
Jackman,S.D., Mungall,K., Lee,S., Okada,H.M., Qian,J.Q.et al.
(2010) De novo assembly and analysis of RNA-seq data.Nat
Methods,7, 909–912.
26. Grabherr,M.G., Haas,B.J., Yassour,M., Levin,J.Z.,
Thompson,D.A., Amit,I., Adiconis,X., Fan,L., Raychowdhury,R.,
Zeng,Q.et al. (2011) Full-length transcriptome assembly from
RNA-Seq data without a reference genome.Nat. Biotechnol.,29,
644–652.
27. Schulz,M.H., Zerbino,D.R., Vingron,M. and Birney,E. (2012) Oases: Robust de novo RNA-seq assembly across the dynamic
range of expression levels.Bioinformatics,28, 1086–1092.
28. Zhao,Q.Y., Wang,Y., Kong,Y.M., Luo,D., Li,X. and Hao,P. (2011) Optimizing de novo transcriptome assembly from
short-read RNA-Seq data: a comparative study.BMC
Bioinformatics,12(Suppl. 14), S2.
29. Robinson,M.D., McCarthy,D.J. and Smyth,G.K. (2010) edgeR: a Bioconductor package for differential expression analysis of
digital gene expression data.Bioinformatics,26, 139–140.
30. Anders,S. and Huber,W. (2010) Differential expression analysis
31. Hardcastle,T.J. and Kelly,K.A. (2010) baySeq: Empirical Bayesian methods for identifying differential expression in sequence count
data.BMC Bioinformatics,11, 422.
32. Tarazona,S., Garcia-Alcalde,F., Dopazo,J., Ferrer,A. and Conesa,A. (2011) Differential expression in RNA-seq: a matter of
depth.Genome Res.,21, 2213–2223.
33. Wu,T.D. and Nacu,S. (2010) Fast and SNP-tolerant detection of
complex variants and splicing in short reads.Bioinformatics,26,
873–881.
34. Lunter,G. and Goodson,M. (2011) Stampy: a statistical algorithm for sensitive and fast mapping of Illumina sequence reads. Genome Res.,21, 936–939.
35. Trapnell,C., Pachter,L. and Salzberg,S.L. (2009) TopHat:
discovering splice junctions with RNA-Seq.Bioinformatics,25,
1105–1111.
36. Verduyn,C., Postma,E., Scheffers,W.A. and Van Dijken,J.P. (1992) Effect of benzoic acid on metabolic fluxes in yeasts: a continuous-culture study on the regulation of respiration and
alcoholic fermentation.Yeast,8, 501–517.
37. Gyorffy,B., Molnar,B., Lage,H., Szallasi,Z. and Eklund,A.C. (2009) Evaluation of microarray preprocessing algorithms based
on concordance with RT-PCR in clinical samples.PLoS One, 4,
e5645.
38. Workman,C., Jensen,L.J., Jarmer,H., Berka,R., Gautier,L., Nielser,H.B., Saxild,H.H., Nielsen,C., Brunak,S. and Knudsen,S. (2002) A new non-linear normalization method for reducing
variability in DNA microarray experiments.Genome Biol.,3,
research0048.
39. Smyth,G.K. (2004) Linear models and empirical bayes methods for assessing differential expression in microarray experiments. Stat. Appl. Genet. Mol. Biol.,3, Article3.
40. Li,H. and Durbin,R. (2009) Fast and accurate short read
alignment with Burrows-Wheeler transform.Bioinformatics,25,
1754–1760.
41. Cox,M.P., Peterson,D.A. and Biggs,P.J. (2010) SolexaQA: At-a-glance quality assessment of Illumina second-generation
sequencing data.BMC Bioinformatics,11, 485.
42. Nielsen,R., Paul,J.S., Albrechtsen,A. and Song,Y.S. (2011) Genotype and SNP calling from next-generation sequencing data. Nat Rev. Genet.,12, 443–451.
43. Shen,Y., Wan,Z., Coarfa,C., Drabek,R., Chen,L., Ostrowski,E.A.,
Liu,Y., Weinstock,G.M., Wheeler,D.A., Gibbs,R.A. et al. (2010)
A SNP discovery method to assess variant allele probability
from next-generation resequencing data.Genome Res.,20,
273–280.
44. Quinlan,A.R. and Hall,I.M. (2010) BEDTools: a flexible suite of
utilities for comparing genomic features.Bioinformatics,26,
841–842.
45. Li,H., Handsaker,B., Wysoker,A., Fennell,T., Ruan,J., Homer,N., Marth,G., Abecasis,G. and Durbin,R. (2009) The Sequence
Alignment/Map format and SAMtools.Bioinformatics,25,
2078–2079.
46. McKenna,A., Hanna,M., Banks,E., Sivachenko,A., Cibulskis,K., Kernytsky,A., Garimella,K., Altshuler,D., Gabriel,S., Daly,M. et al. (2010) The Genome Analysis Toolkit: a MapReduce
framework for analyzing next-generation DNA sequencing data. Genome Res.,20, 1297–1303.
47. Wu,T.D. and Watanabe,C.K. (2005) GMAP: a genomic mapping and alignment program for mRNA and EST sequences. Bioinformatics,21, 1859–1875.
48. Oliveira,A.P., Patil,K.R. and Nielsen,J. (2008) Architecture of transcriptional regulatory circuits is knitted over the topology of
bio-molecular interaction networks.BMC Syst. Biol.,2, 17.
49. Patil,K.R. and Nielsen,J. (2005) Uncovering transcriptional regulation of metabolism by using metabolic network topology. Proc. Natl Acad. Sci. USA,102, 2685–2689.
50. Stein,L.D., Mungall,C., Shu,S., Caudy,M., Mangone,M., Day,A.,
Nickerson,E., Stajich,J.E., Harris,T.W., Arva,A.et al. (2002) The
generic genome browser: a building block for a model organism
system database.Genome Res.,12, 1599–1610.
51. Otero,J.M., Vongsangnak,W., Asadollahi,M.A., Olivares-Hernandes,R., Maury,J., Farinelli,L., Barlocher,L., Osteras,M.,
Schalk,M., Clark,A.et al. (2010) Whole genome sequencing of
Saccharomyces cerevisiae: from genotype to phenotype for
improved metabolic engineering applications.BMC genomics,11,
723.
52. Nijkamp,J.F., van den Broek,M., Datema,E., de Kok,S., Bosman,L., Luttik,M.A., DaranLapujade,P., Vongsangnak,W.,
Nielsen,J., Heijne,W.H.et al. (2012) De novo sequencing,
assembly and analysis of the genome of the laboratory strain Saccharomyces cerevisiae CEN.PK113-7D, a model for modern
industrial biotechnology.Microb. Cell Fact.,11, 36.
53. Shi,L., Campbell,G., Jones,W.D., Campagne,F., Wen,Z.,
Walker,S.J., Su,Z., Chu,T.M., Goodsaid,F.M., Pusztai,L.et al.
(2010) The MicroArray Quality Control (MAQC)-II study of common practices for the development and validation of
microarray-based predictive models.Nat. Biotechnol.,28, 827–838.
54. Jarvinen,A.K., Hautaniemi,S., Edgren,H., Auvinen,P., Saarela,J., Kallioniemi,O.P. and Monni,O. (2004) Are data from different
gene expression microarray platforms comparable?Genomics,83,
1164–1168.
55. Canelas,A.B., Harrison,N., Fazio,A., Zhang,J., Pitkanen,J.P., van den Brink,J., Bakker,B.M., Bogner,L., Bouwman,J., Castrillo,J.I. et al. (2010) Integrated multilaboratory systems biology reveals differences in protein metabolism between two reference yeast
strains.Nat. Commun.,1, 145.
56. Bullard,J.H., Purdom,E., Hansen,K.D. and Dudoit,S. (2010) Evaluation of statistical methods for normalization and
differential expression in mRNA-Seq experiments.BMC
Bioinformatics,11, 94.
57. Degner,J.F., Marioni,J.C., Pai,A.A., Pickrell,J.K., Nkadori,E., Gilad,Y. and Pritchard,J.K. (2009) Effect of read-mapping biases on detecting allele-specific expression from RNA-sequencing data. Bioinformatics,25, 3207–3212.
58. Gamazon,E.R., Zhang,W., Dolan,M.E. and Cox,N.J. (2010) Comprehensive survey of SNPs in the Affymetrix exon array
using the 1000 Genomes dataset.PloS One,5, e9366.
59. Frazer,K.A., Ballinger,D.G., Cox,D.R., Hinds,D.A., Stuve,L.L., Gibbs,R.A., Belmont,J.W., Boudreau,A., Hardenbol,P., Leal,S.M. et al. (2007) A second generation human haplotype map of over