White Rose Research Online URL for this paper:
http://eprints.whiterose.ac.uk/152266/
Version: Accepted Version
Article:
Guo, Y., Wang, L., Li, Y. et al. (2 more authors) (2019) The detection of freezing of gait in
Parkinson's disease using asymmetric basis function TV-ARMA time-frequency spectral
estimation method. IEEE Transactions on Neural Systems and Rehabilitation Engineering,
27 (10). pp. 2077-2086. ISSN 1534-4320
https://doi.org/10.1109/tnsre.2019.2938301
© 2019 IEEE. Personal use of this material is permitted. Permission from IEEE must be
obtained for all other users, including reprinting/ republishing this material for advertising or
promotional purposes, creating new collective works for resale or redistribution to servers
or lists, or reuse of any copyrighted components of this work in other works. Reproduced
in accordance with the publisher's self-archiving policy.
[email protected] https://eprints.whiterose.ac.uk/
Reuse
Items deposited in White Rose Research Online are protected by copyright, with all rights reserved unless indicated otherwise. They may be downloaded and/or printed for private study, or other acts as permitted by national copyright laws. The publisher or other rights holders may allow further reproduction and re-use of the full text version. This is indicated by the licence information on the White Rose Research Online record for the item.
Takedown
If you consider content in White Rose Research Online to be in breach of UK law, please notify us by
Abstract—Freezing of gait (FOG) is an episodic gait disturbance affecting locomotion in Parkinson’s disease. As a biomarker to detect FOG, the Freeze index (FI), which is defined as the ratio of the areas under power spectra in ‘freeze’ band and in ‘locomotion’ band, can negatively be affected by poor time and frequency resolution of time-frequency spectrum estimate when short-time Fourier transform (STFT) or Wavelet transform (WT) is used. In this study, a novel high-resolution parametric time-frequency spectral estimation method is proposed to improve the accuracy of FI. A time-varying autoregressive moving average model (TV-ARMA) is first identified where the time-varying parameters are estimated using an asymmetric basis function expansion method. The TV-ARMA model is then transformed into frequency domain to estimate the time-frequency spectrum and calculate the FI. Results evaluated on the Daphnet Freezing of Gait Dataset show that the new method improves the time and frequency resolutions of the time-frequency spectrum and the associate FI has better performance in the detection of FOG than its counterparts based on STFT and WT methods do. Moreover, FOGs can be predicted in advance of its occurrence in most cases using the new method.
Index Terms—Freezing of Gait (FOG), Freeze index (FI), time-frequency spectral estimation (TFSE), time-varying auto-regressive moving average (TV-ARMA) model, asymmetric basis function, wearable inertial sensor.
I. INTRODUCTION
S the world second prevalent neurodegenerative disease, Parkinson's disease (PD) impacts more than sixteen million peopleworldwide and this number is expected to double by 2050 [1]. Results of a survey of 6620 patients with PD showed that about half have the experience of regular gait freeze [2]. FOG is defined as an incapacity to coordinate the motion input and concurrent cognitive in the brain, resulting in that PD patients can’t move their feet in spite of the intention to move. This symptom commonly occurs in gait initiation, turning, passing through narrow space or approaching obstacles in patients’ daily life, which significantly increases the risk of falling during walking. The facts that FOG often happens suddenly, asymmetrically, and with a short duration [3-5] make This work was supported by the National Natural Science Foundation of China [61876015] (Corresponding authors: Yuzhu Guo.)
Yuzhu Guo, Lipeng Wang, Yang Li are with the Department of Automation Sciences and Electrical Engineering, Beihang University, Beijing, China (e-mail: [email protected]).
the clinical detection, tracking and evaluation of the onset of FOG a challenging task.
Clinical assessment to FOG based on questionnaires (UPDRS, NFOG-Q) and manual video analysis of in-lab activities by clinicians [6] may be subjective because of the dependence on the experience of clinicians and the description ability of patients. Therefore, an accurate and automatic FOG detection approach is desired to objectively detect or even predict the onset of FOG in advance. Recently, the development on wearable technologies makes it possible for researchers to objectively assess Parkinson’s disease severity [7], obtain insightful information on gait characteristics of patients with neurological disorders [8], and even accurately detect FOG in daily life. In comparison to electrophysiological signal such as Electroencephalography (EEG) [9], wearable devices are more suitable for long-term monitoring PD in living conditions because of its light in weight, unobtrusive and comfortable.
An increasing number of attempts based on wearable inertial sensors have been made to automatically detect FOG. In 2008, Moore et al. [10] proposed freeze index (FI) which was defined as the ratio of power spectral densities in freeze band (3-8 Hz) and locomotion band (0.5-3 Hz) to characterize FOG using frequency domain information. A simple threshold was determined to discriminate FOG from normal locomotion because more high frequency components were observed in FOG spectra. The FI is time-variant and instant FI can be calculated using a short time Fourier transform with a moving window of six seconds. The FI was extended by Bächlin et al [11], where an extra power index which represents the total energy in the range of 0.5-8 Hz was introduced to eliminate the effect of standing periods to the detection of FOG. Based on the FI, a wearable assistant system has been designed to automatically detect FOG and apply a rhythmic auditory intervention to help patients to resume walking while FOG is happening [12]. Many efforts have been made based on FI and wearable sensors to improve the classification accuracy [13-16].
The state-of-the-art machine learning methods have also been employed in the detection of FOG and a classification accuracy better than 80% has been achieved [17-20]. However, in many studies, a FOG event is marked as correctly detected only if the Lingzhong Guo are with Department of Automatic Control and Systems Engineering, The University of Sheffield, Mappin Street, Sheffield S1 3JD, UK(email:[email protected])
Fangang Meng is with Beijing Key Laboratory of Neuroelectric Stimulation Research and Treatment, Beijing Institute of Neurosurgery, Capital Medical University, Beijing, China(email: [email protected])
The Detection of Freezing of Gait in
Parkinson's Disease Using Asymmetric Basis
Function TV-ARMA Time-Frequency Spectral
Estimation Method
Yuzhu Guo*, Lipeng Wang, Yang Li, Lingzhong Guo and Fangang Meng
FOG duration is touched with the labelled FOG duration. That is, the FOG episodes have actually not been accurately located. This limits the application of FOG detection in real time intervention.
The time-varying FI is defined based on the time-frequency spectra of the vertical accelerations, so the quality of the time-frequency spectral estimation (TFSE) determines the reliability of the FI and the associated discrimination of FOG. Short time Fourier transform (STFT) which was used as the standard method in the estimation of the FI has its drawbacks in the time-frequency spectral estimation. The obtained TFSE highly depends on the size of the slide window in the STFT. A wide window produces a TFSE with good frequency resolution but this may blur the time resolution. However, decreasing the window size leads to a higher time resolution but spoils frequency resolution in the TFSE. Continuous wavelet transform (CWT) can be considered as a transform with multi-scales and can be adopted to the time-varying signal avoiding the determination of window size. However, the selection of a proper basis function can be difficult and CWT is known to suffer from a spread spectrum [21].
Time-varying auto-regressive moving average (TV-ARMA) model with basis function expansion has been developed for time-varying systems identification and the associated TFSE [22-26]. A time domain model is firstly identified and the time-frequency spectral is indirectly estimated by transforming the time domain model to alleviate the time-frequency dilemma Basis function expansion time-varying (nonlinear) autoregressive with exogenous input (TV-(N)ARX) model combined with orthogonal forward regression algorithms have been proved to be powerful in describing complex non-stationary processes [27-29]. Recently, Guo et al. showed that asymmetric basis function TV-NARX inspired by neuronal dynamics can significantly improve model’s ability in tracking both smooth trends and abrupt changes and improve the model sparsity [30].
In this study, the asymmetric basis method is extended to the identification of TV-ARMA models by introducing an extra iterative process for the moving average noise model and used to improve the time and frequency resolution of TFSE and the accuracy of FI. A novel two-step calculation method for FI is proposed. Firstly, a time-varying autoregressive moving average model (TV-ARMA) and the associated identification methods are developed for characterizing the nonstationary FOG accelerations in the time domain using the asymmetric basis function expansion method. The time-frequency spectrum (TFS) is then obtained by transforming the time domain time-varying model into frequency domain and an accurate FI can then be calculated.
The contribution of the paper includes: asymmetric basis function TV-ARMA model and the associated identification method is proposed for modelling nonstationary signals; a new indirect parametric TFSE method is proposed by transfer the TV-ARMA model into frequency domain; A more accurate and reliable FI is calculated based on the higher resolution TFSE. Combined with the wearable sensor technologies, the new findings can be useful for monitoring PD patients in real life conditions and for unattended nursing of advanced PD patients.
II. METHODS A. Dataset
The Daphnet public FOG dataset, which comprises 8.5 hours’ inertial signals data from idiopathic PD patients was used in this study. Ten advanced PD patients (7 males) who had the capacity in walking unassisted in the “OFF” period were recruited. These patients (66.5±4.8 years old, Hoehn-Yahr score (H&Y) [31] in ON is 2.6±0.65) were diagnosed as PD at 13.7±9.67 years ago, and only eight subjects manifested FOG episodes during the experimental tasks. Three tri-axial accelerometer sensors were placed at the ankle (shank), on the thigh just above the knee, and on the hip. Data were recorded in the lab at a sampling rate of 64 Hz.
More than 12 hours after their last anti-parkinsonian medication intake, participants were informed to perform three kinds of tasks: walking back and forth along a straight line hallway and performing several turns of 180°; walking in the lab room while executing initiated stops and turns of 360°; and, finally a more realistic activity of daily living (ADL) task, where subjects went into different rooms while fetching coffee, opening doors, etc. The tasks were designed with an emphasis on generating many freeze events. The digital video camera was adopted to implement synchronous video recording throughout the whole process of experiment. The movement data of patients were acquired in parallel with the video recording and synchronized at every start. Annotating and analyzing the video recording, the physiotherapists recognized a total of 237 FOG. There were three types of labels in the data processed by physiotherapists: FOG, normal movement, not belong to the experiment. A pre-screen was performed and the not motion-related data segments were removed. The duration of FOG ranged from 0.5 sec to 40.5 sec (7.3±6.7 seconds).
B. Asymmetric Basis Function TV-ARMA Model and Identification
In this study, a new indirect non-parametric time-frequency spectral estimation method is proposed. The new method essentially includes two steps: the system identification of TV-ARMA model from non-stationary time series and the estimation of the time-frequency spectrum from the obtained time domain model. The first step is crucially important because the TV-ARMA is needed to be capable of not only fitting the measurements but also accurately characterizing the time-varying system dynamics so that the associated frequency domain representation, namely, the frequency response function, well agrees with the time-frequency spectrum of the nonstationary process.
Consider the general TV-ARMA model [22]:
1 ( ) 1 ( ) ( ) p q i j i j y k a k y k i b k e k j e k
(1)where k1,2,N (Nis the length of samples) is the time index of observed data; ( )y k and ( )e k denote observed system output (time series) and noise, respectively, with maximum delays pandqrespectively, ( )e k is the model error that is a (i.i.d.) white noise sequence with zero mean and variance 2
e
In the model,a ki( ) and ( )b kj stand for the corresponding
time-varying coefficients which may change smoothly or abruptly in the process.
The time-varying coefficients a ki( ) and b kj( ) are
approximated as superposition of a set of over completed basis functions. Results [32] showed that a sparser representation can be obtained when postsynaptic current like asymmetric basis functions was used.
, 1 , 1 ( ) ( ) ( ) ( ) M i i m m m L j j l l l a k k b k k
(2)where M and L are the size of the two sets.i m, ,j l, denote the final time-independent parameters to be estimated after decomposition using asymmetric alpha basis function.
( ) ( ) ( ) ( ) 1 ( ) M L M L m l m l k
is a set of alpha basis function shaped
by: 1 1 ( ) ( , ) ( 0) (1 ) ( ) ( ) a b a b k a b k k a b (3)
where 1 a b, a b, are the parameters control the shape of the wavelet function. ( ) is the generalized factorial function of Euler. and are the translation and scale parameters of alpha basis function.
Substituting (2) into (1), the TV-ARMA model can thus be rewritten as:
,
,
1 1 1 1 ( ) ( ) ( ) p M q L i m m j l l i m j l y k k y k i k e k j e k
(4) Model (4) can be rearranged as a simple form:
, 1 1 , 1 1 ( ) ( ) ( ) p M i m m i m q L j l l j l y k k y k i k e k j e k
(5)A matrix form for the formula (5) is given as:
T
y e (6)
where the new variable
[ ( -1), , ( - )]y k y k p kN1M
1 ,[ ( -1), , ( - )]Nk L
e k e k q denotes the candidate dictionary,
where is the Kronecker product, and T indicates the
transpose of time-invariant parameter matrix
[ ,
1,1 1,2 1, , 1,1 1,2 1, ,, M, p M, , , M, q M]
,
y
ande
are themodel output data and noise error respectively.
As discussed above, the initial TV-ARMA model (1) can be treated as the system identification of time-invariant linear-in-the-parameter model (6) with model terms
and the associated constant coefficients . However, the over-complete basis functions may lead to the numerically ill-posed problem and the detection of the model structure is entwined with the estimation of the associated parameter. Tedious trial-and-error processesfor a parsimonious model structure need to re-estimate the parameters for each trial. The combinations can be enormous and the process is computationally infeasible. The LROFR algorithm family which decouples the model structure detection and the parameter estimation by orthogonalizing the model terms and selecting model terms stepwise has successfully used for the identification of different kinds of model. The LROFR algorithm can further enhance the capacity for model selection to produce a sparser model with good generalization performance. For the details about LROFR, refer to paper [32]. In order to identify the moving average noise model, an iterative process is employed because the noised terms
( -1), , ( - )
e k e k q are not known. In the process, a TV-AR model is firstly identified using LROFR algorithm and the residual series
1
k1 , ,
1
k q
are used to replace thenoise termse k( -1), , ( - ) e k q , respectively. A TV-ARMA model can then be identified and a new residual series
2
k 1 , ,
2
k q
is then obtained. Repeat the process until the model is converged. A similar identification technique has been used in the identification of time invariant NARMAX model [33].C. Time-Frequency Spectral Estimation
Once the TV-ARMA structure and the associated time-varying coefficients are determined using the LROFR algorithm, the time-frequency spectrum can then be estimated using the following rational spectral estimation formula [34]:
2 2 1 2 2 1 ˆ 1 ( ) ( , ) ˆ 1 ( ) s s h jf q f j j TDS e p h if f i i b t e P t f a t e
(7)where PTDS( , )t f is the TFSE value at time t and frequency f ,
ˆ ( )i
a t and b tˆ ( )j is the estimation of TV-ARMA model
parameters a k b ki( ), ( )j , 2
e
is the variance of model residual,s
f is the sampling frequency and h -1 denotes the
imaginary part of a complex number.
Formula (7) represents the frequency response function (FRF) of a time-varying ARMA process, which is a frequency domain description of the original time series. This description is sufficiently accurate when the time-varying coefficients change at a relatively slow rate [35]. It can be observed that poles and zeros of the FRF (7) correspond to peaks and valleys in the TFS respectively. The frequency spectrum, therefore, changes with the changes of the poles and zeros which are determined by the time-varying coefficients. The non-stationary dynamic process is characterized by the time-varying ARMA model and then by the time-varying FRF. There are several significant advantages in the indirect parametric TFSE method than the direct transforming methods, such as short-time-Fourier-transform and wavelet transforms. Firstly, the obtained TFS is robust to the effects of noise because the noise pollution has automatically be eliminated in the modelling process and only the most important system models (frequency components) remains in the simple model structure. Secondly, the obtained TFS is less spread and the most important frequency
components play a prominent role. Finally, smooth coefficients, which can change abruptly but still continuously over time, can be obtained when proper regularization techniques are used in the modelling process. A smoothly changing spectrum can then be obtained. These features can be observed from the results in Section III.
D. Calculation of Freeze Index
The freeze index (FI) at time
t
was defined as the ratio of the area under power spectra in the ‘freeze’ band (3-8 Hz) and the area under the spectra in the ‘locomotion’ band (0.5-3Hz)[10]. The instant power spectra are traditionally calculated using short time Fourier transform with a fixed window (centred at timet
) [10-12, 36, 37]. The calculated FI may be sensitive to the window size. For example, the power spectra cannot be accurately estimated based on a limited number of data in a narrow window whilst the power spectra can be blurred when a long window is used. This can be avoided using the method proposed in the previous subsections and accurate TFSE with simultaneously high time and frequency resolutions can be used to calculate the instant FI.Because STFT or WT was not able to well capture the time-frequency transient features resulting in poor performance for FI in detecting of FOG episodes, the FI is calculated using the TFSE obtained above. To reduce the effect of the window size, the instant FI is calculated employing the PTDS( , )t f as
8 3 3 0.5 ( , ) ( ) ( , ) TDS TDS P t f df FI t P t f df
(8)where the time as well as frequency are continuous independent variables.
The whole proposed processes for the calculation of FI and the automatic detection of FOG can be summarized as follows: Step 1: Data preprocess: preprocess the raw accelerometer data using low pass and zero lag filter with a 16 Hz cutoff frequency.
Step 2: Model Construction and asymmetric basis function expansion: construct the dictionary of TV-ARMA (p, q) model terms [ ( -1), , ( - ), ( -1), , ( - )]y k y k p e k e k q Nk1 and the over-complete alpha basis function basis
( )( ) ( ) ( ) 1 M L M L m l m l
, then
combine the two dictionaries by to generate the candidate term dictionary , the order of model p and q is determined by AIC criterion. And the initial error can be obtained in Step 4.
Step 3: Model terms selection and parameter estimation: use the LROFR algorithm to select the model terms and approximating the corresponding time-varying parameters.
Step 4: System identification of the noise model: firstly, apply LROFR algorithm to identify a TV-AR model, namely, set q0 in Step 2. Then replace the noise terms in TV-ARMA model with the residual series obtained in TV-AR model. Repeat the process until the model is converged.
Step 5: Time-frequency spectral estimation: estimate the high resolution time-frequency spectral using (7).
Step 6: Calculation of FI: calculate the high resolution TFSE and FI defined in (8).
Step 7: Automatic detection of FOG: select an optimal global threshold, which can match the predictions with the ground truth best, to classify the FOG and free-FOG automatically.
III. RESULTS A. Numeric Study
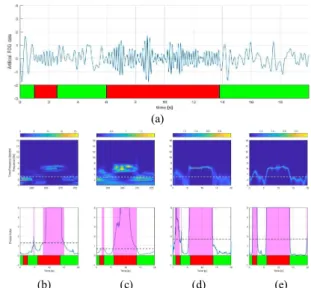
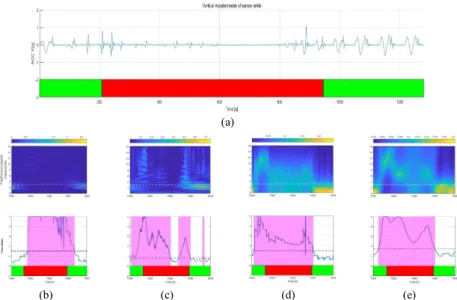
In the part, we performed a numerical experiment to prove the new indirect and high time-resolution TFSE method based on TV-ARMA model has a better performance than traditional methods in calculating a more powerful FI for FOG detection automatically. The normal locomotion and FOG segments were generated by filtering Gaussian white noise series which follows an i.i.d. Gaussian distribution N(0, 0.025) with band-pass filters with a band-pass bands 0.5-3Hz and 3-8Hz, respectively. The data was shown in Fig .1(a) and the TSFE and associated FI were displayed in Fig .1 (b), (c), (e), which are corresponding to the three methods STFT, CWT and the proposed TV-ARMA model with LROFR algorithm. The FIs for these methods were selected to best match the predictions with the ground truth in this case. In order to demonstrate the advantages of the proposed method in estimation of TFSE and the associated FI, twenty artificial data were analyzed using STFT, CWT and the proposed method, respectively. The typical TFSE and the FI are shown in Fig. 1. The average correctness of detection of FOG was evaluated by sensitivity (SEN), specificity (SPE), accuracy (ACC) and the average of sensitivity and specificity (ASS), which were listed in TABLE I.
(a)
(b) (c) (d) (e)
Fig. 1. Performance of four FI calculation methods on artificial data. (a) A 20s artificial FOG data. (b) TFSE and FI based on STFT, (c) CWT, (d) TVARMA with RLS algorithm and (e) asymmetric basis function TV-ARMA.The bar on the bottom shows the ground truth, where red color denotes the artificial FOG episodes and green the artificial FOG-free periods, respectively. The white horizontal broken lines in TFSEs indicates the boundary frequency (3 Hz) between normal locomotion band and FOG bands. The black horizontal broken line is the threshold which discriminates the FOG events from normal locomotion, particularly, the magenta shadowed area demonstrated the FOG episodes identified by the calculated FIs.
TABLEI
COMPARISON OF METHOD PERFORMANCES ON ARTIFICIAL DATA
Methods SEN(%) SPE(%) ACC(%) ASS(%) STFT 72.28 73.85 73.76 73.12 CWT 96.31 93.31 94.96 94.81 TV-ARMA with RLS 94.23 94.00 94.14 94.11 TV-ARMA with LROFR 99.20 94.59 96.86 96.90 where bold fonts indicate the best results.
B. Application to Typical FOG Segments
The Daphnet public dataset comprised of accelerometer signals of 10 subjects were used. Removing the two subjects who manifested no FOG events and the data matching with the annotation unrelated to three experimental tasks, four typical FOG patterns were selected from three patients (subject 02, 05 and 07) respectively with 20s data, namely, 1280 samples in each data fragment, to validate the algorithm. Results were compared with the literature [12] and [13]. For the reason of convenience in real applications, the vertical direction accelerations acquired at shank (above ankle) were adopted. These samples were filtered using low-pass Butterworth filter with a 16Hz cutoff frequency.
We first evaluated the performance of new TFSE and FI on a 20s data extracted from subject 02. The TV-ARMA model was initialized with the system ordersp4, 5q . An over-complete basis which consisted of time-shifted alpha basis functions was built by setting all the alpha functions to have the same shape parametersa3,b7in formula (7), the shift and
scale parameters512,- 1 N. For simplicity, a single scale basis function was used. The scale hyper-parameter was optimized in the identification by evaluating the model performances under different scales. These asymmetric basis functions were then combined with the process terms to form the time-varying dictionary for the forward term selection process. The LROFR algorithm was then employed to conduct the model selection and parameters estimation. Combined with the model error obtained by LROFR process, the APRESS criterion was applied to determine the appropriate model size (when to stop the model selection process). Two iterations were performed to ensure the condition given at Step 4 in Section (D). In the first iteration process, the model order was determined asp4, q0, in another word, a TV-AR model
was estimated. Thereafter the asymmetric basis function TV-ARMA model with the order p4, q5was built in the second
iteration because all the noise terms with a delay greater than 2 were not significant in the model structure detection.
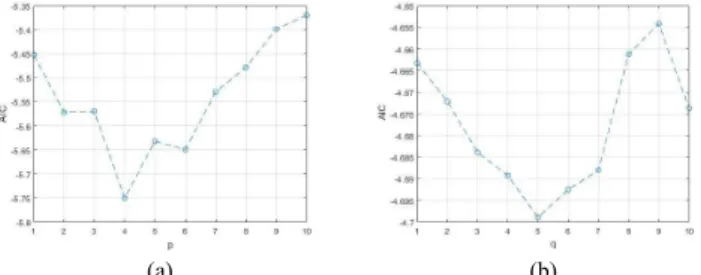
The model order was determined as p=4 and q=5 (as shown in Fig. 2) by criteria Akaike information criterion (AIC) [38] below: 2 , ˆ ( , ) ln( p q) p qln( ) AIC p q N N (9) where 2 , ˆp q
is the variance of the model residuals calculated from the associated p-th and q-th order model, N denotes the data size. Model performance is much less sensitive to q than to p because the MA(q) noise model describes the dynamics of the residuals which is obtained from the AR(p). Hence, the hyperparameters p and q is determined in a two-step procedure. In the first step, an AR(q) model is used to identify the non-stationary process and the model order p* which produced
minimum AIC value was selected as the AR model. In the second step, an ARMA(p*, q) model was used to further
improve the identification performance. The change of AIC with q is calculated and the q* which produced the minimum
AIC value is selected to construct the optimal ARMA(p*, q*).
In the paper, the AIC criterion was performed based on three different sets of 1280 data fragments from the patient 02, 05 and 07, respectively. The AIC curves were given in Fig. 2.
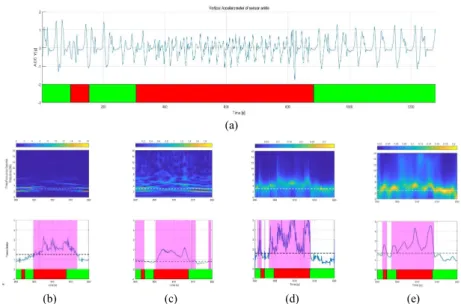
The obtained TV-ARMA model was then transformed into the frequency domain according to formula (7) and the associated TFSE was calculated. The FI was calculated by numerical integration of the power spectra of the TFSE over the freeze band and normal locomotion band. In order to assess the performance of the proposed method, the TFSE and FI calculated with STFT and CWT were also calculated and compared with the same settings in the literature [12], and [13]. It should be noted that complex Morlet wavelet was used in the CWT because of its capability in effectively handling nonstationary signals [39-41]. The results are shown in Fig. 3 (b, c, e). The thresholds for three FIs were 1.5, 0.8 and 1.7, respectively. The FI for STFT was set the same as in the literature. The FIs for CWT and the proposed method were selected to best match the predictions with the ground truth. These thresholds were fixed in the study of the other three data segments to evaluate the effect of inter and intra subject variability. In order to further compare the performance of three different TFSEs and FIs in terms of accuracy and specificity under the effects of inter and intra subject variability, other three 20s data fragments from subject 02, 05 and 07 were studied, respectively. All the three new fragments were analyzed with the same setting as in the first example and same thresholds for FIs were used in the FOG detection. The results are exhibited in Fig. 4 (b, c, e), Fig. 5 (b, c, e) and Fig. 6 (b, c, e), respectively.
(a) (b)
Fig. 2. The model order selection of asymmetric basis function TV-ARMA method. (a) The AIC curve in determination of p with q = 0, namely, the TV-AR model order. (b) The AIC curve in selection of q with p = 4.
C. Results for Full FOG Data
To evaluate performance in detecting FOG using the new asymmetric basis function TV-ARMA method, some comparison with the direct TFSE methods, STFT and CWT were performed on the whole dataset. The results including the accuracy, sensitivity, specificity, average of sensitivity and specificity (ASS) were shown in TABLE II.
TABLEII
COMPARISON OF METHOD PERFORMANCES ON REAL DATASET
Methods SEN (%) SPE (%) ACC (%) ASS (%) STFT 85.64 58.45 68.01 72.05 CWT 81.63 59.43 65.80 70.53 TV-ARMA with RLS 84.16 61.06 70.71 72.83 TV-ARMA with LROFR 86.35 66.36 72.83 76.35 where bold fonts indicate the best results.
(a)
(b) (c) (d) (e)
Fig. 3. Performance of four FI calculation methods on data segment extracted from subject 02. (a) The 20s vertical accelerometer and the expert annotation. (b), (c), (d) and (e) show the TFSE and FI obtained using STFT, CWT, TVARMA with RLS method and the proposed asymmetric basis function TVARMA method, respectively. The detection results of the FOG using these four FIs were denoted by the shadows where shadowed time intervals represented FOG episodes. Notations are defined as in Fig 1.
IV. DISCUSSIONS
The new method proposed in Section II was applied to both artificial and real data from subjects who manifest FOG episodes. The comparison results in Section III demonstrated the feasibility of discriminating FOG from locomotion using the proposed high time and frequency resolution TFSE and FI method. Results in TABLE I showed that the performance of CWT and TV-ARMA method was significantly higher than that of STFT and TV-ARMA produced a much sharp switch between the simulated normal and FOG data. Hence, the classification of FOG is hardly changed when the threshold is changed. However, it is not the case for the CWT results. This means that the FI obtained using TV-ARMA is much more reliable and robust to the selection of threshold.
The parts (a) of Fig. 3, Fig. 4, Fig. 5 and Fig. 6 present the different types and durations of FOG events, which occur at diverse stages of movement such as gait initialization, turning, and encountering an obstacle. Furthermore, the time-frequency spectra and freeze index associated with the data segments are displayed in part (b), (c) and (e). The TFS and FI were estimated using three different methods STFT, CWT and the proposed indirect method and shown in the figures, respectively.
As is shown in the upper part of Fig. 3 (b, c, e), it can be seen with great ease that the proposed method outperforms the exited ones in providing a very continuous and smooth time-frequency spectral image with high resolution. Specifically, the time-frequency image in Fig. 3 (b) is discontinuous in time-frequency and losses a lot of local information due to it is extremely formidable for STFT method to obtain a better time resolution and frequency resolution simultaneously. This disadvantage is determined by the essence of FFT with a fixed window, namely FFT is applied for short overlapping sequences in terms of the assumption of local stationary. We can hardly get a clear spectrum using a limited number of data points. As for CWT
approach shown in Fig. 3(c), although it can address the time-frequency resolution trade-off issue to some extent using adaptive scales, however, the obtained TFS has good frequency resolution but poor time resolution for low frequencies, whereas good temporal resolution but poor frequency resolution for high frequencies. This is because the short-scale wavelets required for higher frequency analysis have wider bandwidth, and hence lower spectral resolution, than the longer-scale wavelets for low frequencies, vice versa [42]. The time-frequency spectral distribution in Fig. 3 (e), which was produced by the proposed parametric method, however, can apparently imply the global frequency behavior of the nonstationary data and reveal the local variations of the dynamic signal along the time course.
It is worthy to emphasize that both poor frequency and time resolutions may undermine the accuracy of FI in the detection of FOG. A poor frequency resolution may blur the frequency boundary between normal locomotion and FOG and lead to a poor FI criterion. This may result in abrupt changes in FI value and lead to false positive of FOG, which can be observed in the CWT based FIs. On the other hand, a poor temporal frequency may lead to an unclear border between normal locomotion and FOG episode, which is also manifested as a flat FI which is sensitive to the selection of the threshold. Both high resolutions in time and frequency can improve the quality of FI which is more powerful in discriminating the FOG from normal motion and not sensitive to the threshold. It can be observed that we can easily distinguish the freezing band from the normal locomotion band through the 3Hz segmentation line because a relatively clear ridge which changes over time can be observed in the time-frequency distribution by new TFSE method. This is not clear in the time-frequency spectra obtained using STFT and CWT in Fig. 3 (b, c). It may need to be noted that there is energy spreading over 8 Hz when FOG events occurred, which may indicate that a wider frequency range can be considered
when defining FI. Comparing the results in Fig. 3(b, c, e), the proposed asymmetric basis function TV-ARMA modelling scheme can provide a high time resolution time and frequency spectrum, which constructs a more convenient and accurate
framework for capturing the time and frequency components of the acceleration signal and detecting FOG events without the need of patient intervention. The FI can detect FOG events even
(a)
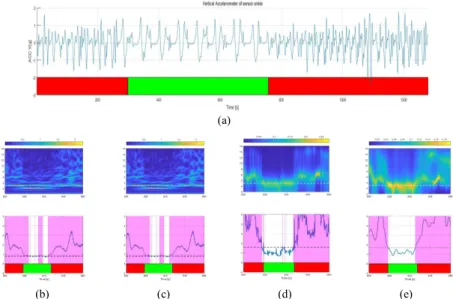
(b) (c) (d) (e)
Fig. 4. Performance of four FI calculation methods on another a 20s data segment extracted from subject 02. (a)Acceleration recording. (b), (c), (d) and (e) show the TFSE and FI obtained using STFT, CWT, TVARMA with RLS method and the proposed asymmetric basis function TVARMA method, respectively. The detection results of the FOG using these four FIs were denoted by the shadows where shadowed time intervals represented FOG episodes. Notations are defined as in Fig 1.
(a)
(b) (c) (d) (e)
Fig. 5. Performance of four FI calculation methods on data segments from subject 05. (a) 20s vertical accelerometer series. (b), (c), (d) and (e) show the TFSE and FI obtained using STFT, CWT, TVARMA with RLS method and the proposed asymmetric basis function TVARMA method, respectively. The detection results of the FOG using these four FIs were denoted by the shadows where shadowed time intervals represented FOG episodes. Notations are defined as in Fig 1. if whose duration is very short. For example, the first FOG
shown in Fig. 3(a) which lasted less than 1s was missed by the other two methods but successfully detected by the new FI.
The good properties in the TFS make the FI more robust. This has been validated by applying the new FI to both FOG patterns including inter and intra subject variability and the whole dataset. To validate the robustness, global thresholds which determined in the first data fragment analysis was used
to all the subjects. Example 2 was taken from the same subject 02 but different time period, examples 3 and 4 were taken from subject 05 and 07, respectively. In all these examples, the new FI works excellently, all the FOG episodes were successfully detected and the duration of FOG was precisely located. However, in the other two methods, some of FOGs were missed whilst some false positive FOG were reported in the duration of single FOG episodes or normal locomotion durations. In
another word, the new framework constructed by indirect parametric TFSE method is more robust to both the selection of threshold and inter and intra subject variability. This is important in practical applications. Furthermore, in most FOGs of these 4 examples with different patterns, the new FI raised and crossed the threshold in advance the real occurrence of the episode in the case of ensuring detection accuracy of FOG.
The results of all subjects data exhibited in TABLE II demonstrate better performance in discriminating the FOG events and free-FOG events in comparison to the traditional STFT and CWT method. It should be noted the FOG detection metrics looks not as good as the reported results in references using machine learning methods. This is due to the following reasons: first, the results in this study was reported based on a point-wise detection of FOG durations whilst the machine learning method reported FOG event detection; second, identical thresholds which have not been optimized for each subject in order to evaluate the inter-subject robustness were used for each method; third, no special processes have been done to exclude the still stance periods which may lead to a poor detection specificity of FOG.
The average results of all subjects data exhibited in TABLE II demonstrate better performance of the proposed method in the discrimination of FOG durations from free-FOG durations than those of traditional STFT and CWT methods. Moreover, according to the results of the four typical FOG patterns (shown in Fig. 3- Fig. 6) and the numerical study, the novel parametric TFSE can capture the transience from normal locomotion to FOG by increasing the temporal resolution without losing frequency resolution. Consequently, the new FI made better FOG detection and even perdition in advance of their occurrences. However, the correct detection of FOG in advance was incorrectly reflected as mismatches in the point-wise criteria. Therefore, the new proposed method actually performed better in the detection of FOG than that shown in
TABLE II. The prediction of FOG is critically important because of the close relationship between FOG and risks of fall. Prediction of FOG in advance its occurrence makes the punctual intervention possible.
The better performance of the new FI lies in the new indirect parametric TFSE algorithms. High-resolution TFSE can be obtained to avoid the dilemma of time and frequency resolutions because a relatively small number of data set is needed to identify the instant ARMA model. For example, using 32 data points we can obtain an ARMA model with 6 parameters with acceptable accuracy and the instant spectrum can be estimated. However, it is impossible to get a satisfied spectrum using the same number of data when the nonparametric methods are used. Correspondingly, we need to pay the cost of the extra modelling process. When the advanced asymmetric basis function TV-ARMA and LROFR algorithm based identification techniques are used, the data can only be processed in batch even the transition of the nonstationary process can be accurately characterized. This means that we can only accurately detect the FOG when a batch of data has been collected. This limits the applications of the method in the online detection and intervention of FOG. However, the problem can be solved by estimating the time-varying coefficients in the TV-ARMA model using recursive least squares (RLS) algorithm and then the TFS can be estimated and the FI can be calculated. All the experiments designed in Section III also were applied to evaluate the effectiveness of TV-ARMA model with RLS algorithm. In addition, the FOG detection from subject 02 data which exploited TV-ARMA model aided by RLS algorithm was evaluated. The proposed system identification method was used to provide a reasonable initial guess for the RLS algorithm and speed up the convergence of the time-varying parameters to real values. These experiments results were exhibited in part (d) of Fig. 1, Fig. 3- Fig. 7, TABLE I and TABLE II. From these results, it is
(a)
(b) (c) (d) (e)
Fig. 6. Performance of four FI calculation methods on a 20s signal extracted from Patient 07 (a) An Acceleration recording at ankle. (b), (c), (d) and (e) show the TFSE and FI obtained using STFT, CWT, TVARMA with RLS method and the proposed asymmetric basis function TVARMA method, respectively. The detection results of the FOG using these three FIs were denoted by the shadows where shadowed time intervals represented FOG episodes. Notations are defined as in Fig 1.
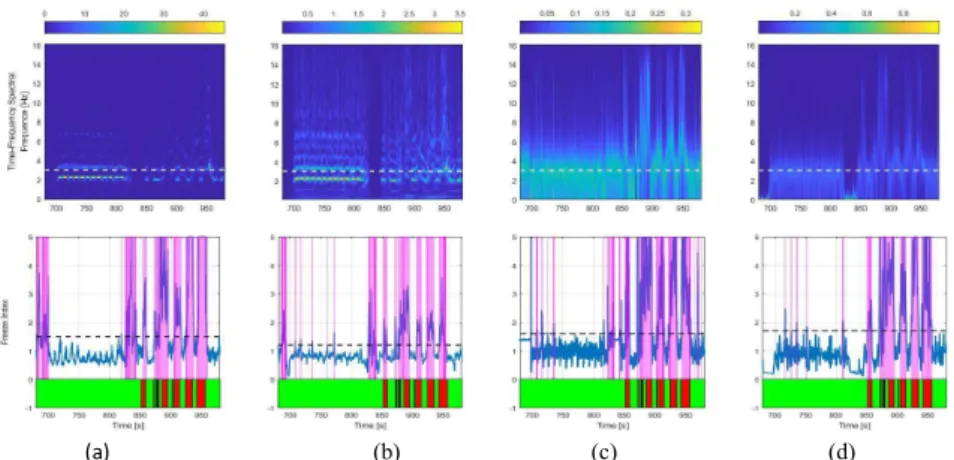
(b) (c) (d)
Fig. 7. The TFS, FI and FOG detection results of a 5 minutes signal from Patient 02 based on (a) STFT, (b) CWT, (c) TV-ARMA model with RLS algorithm, and (d) asymmetric basis function TV-ARMA model with LROFR algorithm. Notations are defined as in Fig 1.
fair to draw the conclusion that the performance of TV-ARMA with RLS method is behind asymmetric basis function TV-ARMA model but surpasses the STFT and CWT methods, that is to say, the RLS based TV-ARMA approach can still remain excellent performance of the new TFSE and FI, which produce relatively high performance in detecting FOG events. Thus RLS based TV-ARMA model can be used to replace asymmetric basis function TV-ARMA model for online FOG detection.
Besides, computational time is critical for real-time applications, for example, the detection of the risk of fall. Thus, a computational time comparison in these four methods based on the simulated data was performed and the results were shown in TABLE III. Actually, the asymmetric basis function method is not as fast as the direct spectrum estimation methods and can be another limitation of the asymmetric basis function TV-ARMA method. However, the RLS-ARMA method is quite fast and the FI can be calculated in 1 second with relatively high accuracy. On the other hand, the asymmetric basis function ARMA method can be used in some other scenario where the accuracy is critical but processing time is not the main concern, for example, in the automatic data labelling of FOG.
V. CONCLUSION
Freezing of gait in PD is common and debilitating. It can aggravate both motor and non-motor illness and could be demanding at supportive healthcare. On-going assessment and punctual supportive care becomes increasingly important in advanced PD. With the reduction of the efficacy of medication, non-pharmacologic treatments such as auditory cueing and visual cueing may eliminate or diminish freezing episodes. However, inappropriate intervention may be associated with an increasing risk of falling [43] because of increased cognitive burden and disturbance to patients’ gait. Hence, accurate detecting FOG episodes and giving punctual and essential interventions are crucial for the automatic management of PD with FOG.
Based on the advanced system identification and time-frequency spectral estimation techniques, the FI is significantly improved in robustness and temporal accuracy. Results have shown that the new FI can be used for detecting different FOG patterns and a properly selected threshold is applicable to other patients and robust to inter-subject variabilities. The symmetric basis function TV-ARMA method which has better accurate FI but the high computational cost can be used for off-line applications, such as, long term assessment of life quality, the effectiveness of pharmacological treatments, and automatically labelling of the FOG data, and so on. For the cases of online applications where real-time detection of FOG is needed, an alternative RLS algorithm based indirect TFSE method has been proposed. The RLS-TFSE method which shares the merits of parametric TFSE but with a much less computational cost provides a trade-off between the accuracy and computational cost.
Combined the RLS-TFSE method with a cheap wearable sensor, FOG can easily be detected even predicted using just vertical accelerations measured at shank level. The new indirect FI calculation methods offer a promising application of wearable sensors in continuous FOG monitoring and automatic management in home conditions to improve patients’ living quality and reduce the increasing healthcare costs.
ACKNOWLEDGEMENT
The authors gratefully acknowledge support from National Natural Science Foundation of China (No. 61876015).
REFERENCES
[1] S. Mazilu, A. Calatroni, E. Gazit, A. Mirelman, J. M. Hausdorff, and G. Tröster, “Prediction of Freezing of Gait in Parkinson's From Physiological Wearables: An Exploratory Study,” IEEE Journal of Biomedical and Health Informatics, vol. 19, no. 6, pp. 1843-1854, 2015.
[2] M. Macht, Y. Kaussner, J. C. Möller, K. Stiasny-Kolster, K. M. Eggert, H.-P. Krüger, and H. Ellgring, “Predictors of freezing in Parkinson's disease: A survey of 6,620 patients,” Movement Disorders, vol. 22, no. 7, pp. 953-956, 2007/05/15, 2007.
[3] J. G. Nutt, B. R. Bloem, N. Giladi, M. Hallett, F. B. Horak, and A. Nieuwboer, “Freezing of gait: moving forward on a mysterious clinical phenomenon,” The Lancet Neurology, vol. 10, no. 8, pp. 734-744, 2011/08/01/, 2011.
TABLEIII
COMPARISON OF COMPUTATIONAL TIME
Methods STFT CWT TV-ARMA with RLS with LROFR TV-ARMA Computational
[4] S. Rahman, H. J. Griffin, N. P. Quinn, and M. Jahanshahi, “The factors that induce or overcome freezing of gait in Parkinson's disease,” Behavioural neurology, vol. 19, no. 3, pp. 127-136, 2008.
[5] C. C. Walton, J. M. Shine, J. M. Hall, C. O’Callaghan, L. Mowszowski, M. Gilat, J. Y. Y. Szeto, S. L. Naismith, and S. J. G. Lewis, “The major impact of freezing of gait on quality of life in Parkinson’s disease,” Journal of Neurology, vol. 262, no. 1, pp. 108-115, 2015/01/01, 2015.
[6] M. Mancini, B. R. Bloem, F. B. Horak, S. J. G. Lewis, A. Nieuwboer, and J. Nonnekes, “Clinical and methodological challenges for assessing freezing of gait: Future perspectives,” Movement Disorders, vol. 34, no. 6, pp. 783-790, 2019/06/01, 2019.
[7] M. Delrobaei, N. Baktash, G. Gilmore, K. McIsaac, and M. Jog, “Using Wearable Technology to Generate Objective Parkinson’s Disease Dyskinesia Severity Score: Possibilities for Home Monitoring,” IEEE Transactions on Neural Systems and Rehabilitation Engineering, vol. 25, no. 10, pp. 1853-1863, 2017.
[8] M. Yoneyama, H. Mitoma, N. Sanjo, M. Higuma, H. Terashi, and T. Yokota, “Ambulatory Gait Behavior in Patients With Dementia: A Comparison With Parkinson’s Disease,” IEEE Transactions on Neural Systems and Rehabilitation Engineering, vol. 24, no. 8, pp. 817-826, 2016.
[9] A. M. A. Handojoseno, J. M. Shine, T. N. Nguyen, Y. Tran, S. J. G. Lewis, and H. T. Nguyen, “Analysis and Prediction of the Freezing of Gait Using EEG Brain Dynamics,” IEEE Transactions on Neural Systems and Rehabilitation Engineering, vol. 23, no. 5, pp. 887-896, 2015.
[10] S. T. Moore, H. G. MacDougall, and W. G. Ondo, “Ambulatory monitoring of freezing of gait in Parkinson's disease,” Journal of Neuroscience Methods, vol. 167, no. 2, pp. 340-348, 2008/01/30/, 2008.
[11] M. Bächlin, J. Hausdorff, D. Roggen, N. Giladi, M. Plotnik, and G. Tröster,
Online Detection of Freezing of Gait in Parkinson’s Disease Patients: A Performance Characterization, 2009.
[12] M. Bachlin, M. Plotnik, D. Roggen, I. Maidan, J. M. Hausdorff, N. Giladi, and G. Troster, “Wearable Assistant for Parkinson’s Disease Patients With the Freezing of Gait Symptom,” IEEE Transactions on Information Technology in Biomedicine, vol. 14, no. 2, pp. 436-446, 2010.
[13] S. Rezvanian, and E. T. Lockhart, “Towards Real-Time Detection of Freezing of Gait Using Wavelet Transform on Wireless Accelerometer Data,” Sensors, vol. 16, no. 4, 2016.
[14] H. Zach, A. M. Janssen, A. H. Snijders, A. Delval, M. U. Ferraye, E. Auff, V. Weerdesteyn, B. R. Bloem, and J. Nonnekes, “Identifying freezing of gait in Parkinson's disease during freezing provoking tasks using waist-mounted accelerometry,” Parkinsonism & Related Disorders, vol. 21, no. 11, pp. 1362-1366, 2015.
[15] C. Azevedo-Coste, B. Sijobert, R. Pissard-Gibollet, M. Pasquier, B. Espiau, and C. Geny, Detection of Freezing of Gait in Parkinson Disease: Preliminary Results, 2014.
[16] E. E. Tripoliti, A. T. Tzallas, M. G. Tsipouras, G. Rigas, P. Bougia, M. Leontiou, S. Konitsiotis, M. Chondrogiorgi, S. Tsouli, and D. I. Fotiadis, “Automatic detection of freezing of gait events in patients with Parkinson's disease,” Computer Methods and Programs in Biomedicine, vol. 110, no. 1, pp. 12-26, 2013/04/01/, 2013.
[17] S. Mazilu, M. Hardegger, Z. Zhu, D. Roggen, G. Tröster, M. Plotnik, and J. M. Hausdorff, "Online detection of freezing of gait with smartphones and machine learning techniques." pp. 123-130.
[18] J. Camps, A. Samà, M. Martín, D. Rodríguez-Martín, C. Pérez-López, J. M. Moreno Arostegui, J. Cabestany, A. Català, S. Alcaine, B. Mestre, A. Prats, M. C. Crespo-Maraver, T. J. Counihan, P. Browne, L. R. Quinlan, G. Ó. Laighin, D. Sweeney, H. Lewy, G. Vainstein, A. Costa, R. Annicchiarico, À. Bayés, and A. Rodríguez-Molinero, “Deep learning for freezing of gait detection in Parkinson’s disease patients in their homes using a waist-worn inertial measurement unit,” Knowledge-Based Systems,
vol. 139, pp. 119-131, 2018/01/01/, 2018.
[19] P. Tahafchi, R. Molina, J. A. Roper, K. Sowalsky, C. J. Hass, A. Gunduz, M. S. Okun, and J. W. Judy, "Freezing-of-Gait detection using temporal, spatial, and physiological features with a support-vector-machine classifier." pp. 2867-2870.
[20] V. Mikos, C.-H. Heng, A. Tay, N. Shuang Yu Chia, K. Mui Ling Koh, D. May Leng Tan, and W. Lok Au, Real-Time Patient Adaptivity for Freezing of Gait Classification Through Semi-Supervised Neural Networks, 2017. [21] I. Daubechies, J. Lu, and H.-T. Wu, “Synchrosqueezed wavelet transforms:
An empirical mode decomposition-like tool,” Applied and Computational Harmonic Analysis, vol. 30, no. 2, pp. 243-261, 2011/03/01/, 2011. [22] Y. Grenier, “Time-dependent ARMA modeling of nonstationary signals,”
IEEE Transactions on Acoustics, Speech, and Signal Processing, vol. 31, no. 4, pp. 899-911, 1983.
[23] R. Zou, H. Wang, and K. H. Chon, “A Robust Time-Varying Identification Algorithm Using Basis Functions,” Annals of Biomedical Engineering, vol. 31, no. 7, pp. 840-853, 2003/07/01, 2003.
[24] M. Jachan, G. Matz, and F. Hlawatsch, “Time-Frequency ARMA Models and Parameter Estimators for Underspread Nonstationary Random Processes,” IEEE Transactions on Signal Processing, vol. 55, no. 9, pp. 4366-4381, 2007.
[25] M. D. Spiridonakos, and S. D. Fassois, “Non-stationary random vibration modelling and analysis via functional series time-dependent ARMA (FS-TARMA) models – A critical survey,” Mechanical Systems and Signal Processing, vol. 47, no. 1, pp. 175-224, 2014/08/03/, 2014.
[26] M. Bertha, and J.-C. Golinval, “Identification of non-stationary dynamical systems using multivariate ARMA models,” Mechanical Systems and Signal Processing, vol. 88, pp. 166-179, 2017/05/01/, 2017.
[27] S. A. Billings, and H. L. Wei, “An adaptive orthogonal search algorithm for model subset selection and non-linear system identification,”
International Journal of Control, vol. 81, no. 5, pp. 714-724, 2008/05/01, 2008.
[28] Y. Li, M.-L. Luo, and K. Li, “A multiwavelet-based time-varying model identification approach for time–frequency analysis of EEG signals,”
Neurocomputing, vol. 193, pp. 106-114, 2016.
[29] Y. Li, W.-G. Cui, M.-L. Luo, K. Li, and L. Wang, “High-resolution time– frequency representation of EEG data using multi-scale wavelets,”
International Journal of Systems Science, vol. 48, no. 12, pp. 2658-2668, 2017.
[30] Y. Guo, L. Wang, Y. Li, J. Luo, K. Wang, S. A. Billings, and L. Guo, “Neural activity inspired asymmetric basis function TV-NARX model for the identification of time-varying dynamic systems,” Neurocomputing, vol. 357, pp. 188-202, 2019/09/10/, 2019.
[31] M. M. Hoehn, and M. D. Yahr, “Parkinsonism: Onset, progression, and mortality,” Neurology, vol. 77, no. 9, pp. 874, 2011.
[32] Y. Guo, L. Wang, Y. Li, J. Luo, K. Wang, S. A. Billings, and L. Guo, “Neural Activity Inspired Asymmetric Basis Function TV-NARX Model for the Identification of Time-Varying Dynamic Systems,”
Neurocomputing, vol. Accept, 2019.
[33] S. A. Billings, S. A. Chen, and M. Korenberg, Identification of MIMO Non-Linear Systems Using a Forward-Regression Orthogonal Estimator, 1989. [34] J. A. Cadzow, “Spectral estimation: An overdetermined rational model equation approach,” Proceedings of the IEEE, vol. 70, no. 9, pp. 907-939, 1982.
[35] Y. Guo, L. Z. Guo, S. A Billings, D. Coca, and Z. Lang, A parametric frequency response method for non- linear time-varying systems, 2013. [36] A. Samà, D. Rodríguez-Martín, C. Pérez-López, A. Català, S. Alcaine, B.
Mestre, A. Prats, M. C. Crespo, and À. Bayés, “Determining the optimal features in freezing of gait detection through a single waist accelerometer in home environments,” Pattern Recognition Letters, vol. 105, pp. 135-143, 2018/04/01/, 2018.
[37] T. T. Pham, S. T. Moore, S. J. G. Lewis, D. N. Nguyen, E. Dutkiewicz, A. J. Fuglevand, A. L. McEwan, and P. H. W. Leong, “Freezing of Gait Detection in Parkinson's Disease: A Subject-Independent Detector Using Anomaly Scores,” IEEE Transactions on Biomedical Engineering, vol. 64, no. 11, pp. 2719-2728, 2017.
[38] H.-L. Wei, J. Liu, and S. A. Billings, Time-varying parametric modelling and time-dependent spectral characterisation with applications to EEG signals using multi-wavelets, 2008.
[39] T. Kijewski, and A. Kareem, “Wavelet Transforms for System Identification in Civil Engineering,” Computer-Aided Civil and Infrastructure Engineering, vol. 18, no. 5, pp. 339-355, 2003/09/01, 2003. [40] C. Herrmann, M. Grigutsch, and N. A Busch, EEG Oscillations and
Wavelet Analysis, 2004.
[41] Z. G. Zhang, Y. S. Hung, and S. C. Chan, “Local Polynomial Modeling of Time-Varying Autoregressive Models With Application to Time– Frequency Analysis of Event-Related EEG,” IEEE Transactions on Biomedical Engineering, vol. 58, no. 3, pp. 557-566, 2011.
[42] D. P. Allen, and C. D. MacKinnon, “Time–frequency analysis of movement-related spectral power in EEG during repetitive movements: A comparison of methods,” Journal of Neuroscience Methods, vol. 186, no. 1, pp. 107-115, 2010/01/30/, 2010.
[43] J. Lokk, and A. Delbari, “Clinical aspects of palliative care in advanced Parkinson's disease,” BMC palliative care, vol. 11, pp. 20-20, 2012.