Bonell, C.; Shackleton, N.; Fletcher, A.; Jamal, F.; Allen, E.;
Math-iot, A.; Markham, W.; Aveyard, P.; Viner, R. (2016) [Accepted
Manuscript] Student- and school-level belonging and commitment
and student smoking, drinking and misbehaviour. Health education
journal. ISSN 0017-8969 DOI: https://doi.org/10.1177/0017896916657843
(In Press)
Downloaded from:
http://researchonline.lshtm.ac.uk/3029316/
DOI:
10.1177/0017896916657843
Usage Guidelines
Please refer to usage guidelines at
http://researchonline.lshtm.ac.uk/policies.html
or
alterna-tively contact
[email protected]
.
Student and school-level belonging and commitment and student smoking, drinking and
misbehaviour
Christopher Bonell
a, Nichola Shackleton
b, Adam Fletcher
c, Farah Jamal
d, Elizabeth Allen
eAnne Mathiot
f, Wolfgang Markham
g, Paul Aveyard
hand Russell Viner
f.
a
Department of Social and Environmental Health Research, London School of Hygiene and
Tropical Medicine, University of London
b
Centre of Methods and Policy Application in the Social Sciences, University of Auckland,
New Zealand.
c
School of Social Sciences, Cardiff University, Wales
d
Department of Social Science, University College London Institute of Education, London,
UK.
e
Department of Medical Statistics, London School of Hygiene and Tropical Medicine,
London, UK.
f
University College London Institute of Child Health, London, UK.
g
Warwick Medical School- Statistics and Epidemiology, University of Warwick, Coventry, UK.
hDepartment of Primary Care Health Sciences, University of Oxford, Oxford UK
Abstract
Objectives: It has been suggested that students are healthier in schools where more
students are committed to school. Previous research has examined this only using a proxy
measure of value-added education (a measure of whether school-level attendance and
attainment are higher than predicted by students’ social profile), finding associations with
smoking tobacco, use of alcohol and illicit drugs, and violence. These findings do not provide
direct insights into the associations between school-level aggregate student commitment
and health behaviours, and may simply reflect the proxy measure being residually
confounded by unmeasured student characteristics. We examined the previously used
proxy measure of value-added education, as well as direct measures at the level of the
school and the student of lack of student commitment to school to see if these were
associated with students’ self-reported smoking tobacco, alcohol use and school
misbehaviour.
Design
Cross-sectional survey.
Setting
Forty schools in south-east England.
Methods
Multi-level analyses.
Results: There were associations between school- and student-level measures of lack of
commitment to school and tobacco smoking, alcohol use and school misbehaviour
outcomes, but the proxy measure of school-level commitment, value-added education, was
not associated with these outcomes. A sensitivity analysis focused only on violent aspects of
school misbehaviour found an identical pattern of associations to that found for the
measure of misbehaviour.
Conclusion: Our study provides the first direct evidence in support of the Theory of Human
Functioning and School Organisation.
Commented [P1]: There is no superscript ‘f’ author above. Please check carefully and ensure we have full and correct affiliations for all authors and ‘f’ is appropriately tagged
Commented [P2]: Please split up under separate heading as per journal style. You’ll only be asked to do this later by the copy editors if you don’t do it now
Keywords: Adolescents, schools, smoking, alcohol, misbehaviour, young peeople
Corresponding author
Chris Bonell, Department of Social Science, UCL Institute of Education, 18 Woburn Square,
London WC1H 0NR, UK.
Email [email protected]
Introduction
As well as being sites for health promotion interventions, schools and education operate as
social determinants of health (Viner et al., 2012). It is well established from previous studies
that at the individual level, lack of commitment to school or education is associated with risk
behaviours and poorer health (Fletcher et al., 2008; Resnick et al., 1997). However,
individual-level analyses cannot determine whether such associations reflect deficits in
schools’ ability to engage students or students’ prior dispositions. To address this, more
recent research has examined school-level health effects (Bonell et al., 2013b: ; West et al.,
2004: ; Fletcher et al., 2008). These studies examine whether school-level factors affect
student health behaviours independently of individual characteristics.
Much of this research has focused on Markham and Aveyard’s Theory of Human
Functioning and School Organisation, (Markham and Aveyard, 2003) which, according to a
recent systematic review of theories, provides the most comprehensive account of how
schools might shape student health behaviours (Bonell et al., 2013a). The theory suggests
that schools may enable students to develop the critical reasoning and positive sense of
affiliation necessary to avoid health risk behaviours (Markham, 2015) if they ensure
students are committed to school, in terms of engagement with learning and sense of
belonging to a pastoral community (Markham and Aveyard, 2003). The theory predicts that
such effects will be greatest for risk behaviours that are associated with deviance from
conventional social norms promoted by schools.
A systematic review of multi-level studies of the effects of school-level factors on
student health outcomes (Bonell et al., 2013b) found consistent evidence from
cross-sectional (Aveyard et al., 2004: ; Bisset et al., 2007) and longitudinal studies (Markham et al.,
2008: ; Tobler et al., 2011) of US middle schools and UK secondary schools that students
attending schools with high ‘value added education’ (VAE) have lower rates of smoking,
drinking and drug use. One of these studies also reports an association between this
measure of VAE and reduced violence (Tobler et al., 2011). In these studies, VAE is intended
as a school-level measure indicating the extent to which student academic attainment and
attendance are better than would be predicted according to their socio-demographic
profile, intended to function as a proxy for the extent to which schools ensure students are
committed to learning and the school community.
Selection bias arising from more health-oriented families sending their children to
better schools is unlikely because parents of students in these studies could access data on
gross but not value-added attainment and attendance, there being no correlation between
gross and value-added attainment. Reverse causality is unlikely even in the cross-sectional
studies because assessment of VAE drew on data on recent not current students. However,
a key weakness is that these studies provide only indirect evidence on the Theory of Human
Functioning and School Organisation, relying on a proxy measure of commitment. The
relatively small associations between high VAE and lower risk behaviours may reflect
confounding by unmeasured student characteristics. Furthermore, existing studies do not
examine mediators and shed little light on mechanisms of how value-added education might
be associated with health outcomes (Bonell et al., 2013b).
This paper aims to contribute to the literature regarding school effects on student
risk behaviours by assessing the associations with student risk behaviours not only of
school-level VAE but of direct measures of student lack of commitment to learning and to
the school community, operating at both the level of the individual student and the school.
Use of these direct measures aligns more clearly with Markham and Aveyard’s theory and
provides more confidence that any associations found are not merely the result of a proxy
measure failing to account for all student socio-demographic characteristics. The research
questions were
1.
Is school-level VAE associated with reduced student self-reported smoking, drinking
alcohol and school misbehaviour?
2.
Is self-reported student lack of commitment to learning and to the school
community operating at the school and student levels associated with student
smoking, drinking and school misbehaviour?
3.
Are any associations found between low VAE and risk behaviours mediated by
school- or student-level lack of commitment to learning and the school community?
As well as smoking and alcohol, our analyses examined school misbehaviour using an
established measure. School misbehaviour is not a health risk behaviour but since it
represents behaviours contravening school norms, the Theory of Human Functioning and
School Organisation would predict that it would be greater in schools with lower VAE and
lack of student commitment. Some of the items within this scale focus on violent aspects of
misbehaviour and sensitivity analyses examine whether these are subject to the same
patterns of association as the main measure.
Methods
Sample and surveys
Our analysis followed STROBE guidance (von Elim et al., 2007) and draws on data from 40
secondary schools in south-east England (table 1) participating in the ‘INCLUSIVE’ trial being
conducted from 2014 to 2017 of restorative practice to reduce bullying and aggression (Bonell
et al., 2014a). Recruitment targeted state secondary schools within one hour’s train journey
from central London not judged by the national school inspectors as ‘inadequate’. Sample size
calculation, recruitment and data collection are described elsewhere (Bonell et al., 2014a).
Survey data reported here were collected at trial baseline (2014) before allocation or
intervention targeting all students at the end of year 7 (age 11/12 years). Students gave
written informed consent to participate. Parents were informed and could withdraw their
children from the surveys. The study was approved by the Institute of Education (FCL 566)
and the University College London (5248/001) ethics committees. The procedures followed
were in accordance with the Declaration of Helsinki 1975, revised Hong Kong 1989.
[Table 1 about here]
Measures
VAE
As per previous studies, (Aveyard et al., 2004 ; Bisset et al., 2007 ; Markham et al., 2008 ;
Tobler et al., 2011) administrative data on school attainment and absence rates were used
to construct a continuous measure of VAE. Attainment rates were measured as five-year
(2009-13) averages of the proportion of year-11 students (aged 15–16) passing at least five
General Certificate of Secondary Education (GCSE) examinations graded A*–C (5A*–C).
Absence rates were measured as five–year (2009-13) averages of proportion of half-days
missed. The VAE measure was developed via a number of steps. First, we estimated two
logistic regression models using school-level 5A*–C and absence rates as outcomes with the
following socio-demographic exposures: proportion of students that were White;
proportion of females; income deprivation affecting children index (IDACI); (Department for
Education, 2015) proportion of students eligible for free school meals (FSM); proportion of
students speaking English as an additional language (EAL); and proportion of students
scoring ≥6 on the Family Affluence Scale (FAS) (Currie et al., 2008). Data on FSM, IDACI, EAL
and proportion of female students were from government websites. Government collected
data indicated that in our schools 34.93% of students were eligible for free school meals
(range 3-79%), 22.24% of children in the area of the school lived in income deprived
households (range 0 -69.82%), 33.27% of students spoke English as a second language
(range 2.2-90%), and 53% of students were female. The proportion of students who were
White students and data on the FAS were derived from student responses to our survey.
Standardised residuals from each model represent the difference between observed
attainment and absence rates and those predicted based upon student socio-demographic
profile at each school. These showed that schools with better than expected attainment also
had better attendance (r=-0.36). We then undertook a principal components analysis of
residuals from each model, which identified a single factor explaining 68.1% of variance with
factor loadings of +0.71 for attainment and -0.71 for attendance residuals. This continuous
variable was termed ‘VAE’ and standardised so that +1 represented schools with
performance one standard deviation (SD) above average and -1 indicated schools with one
SD below average.
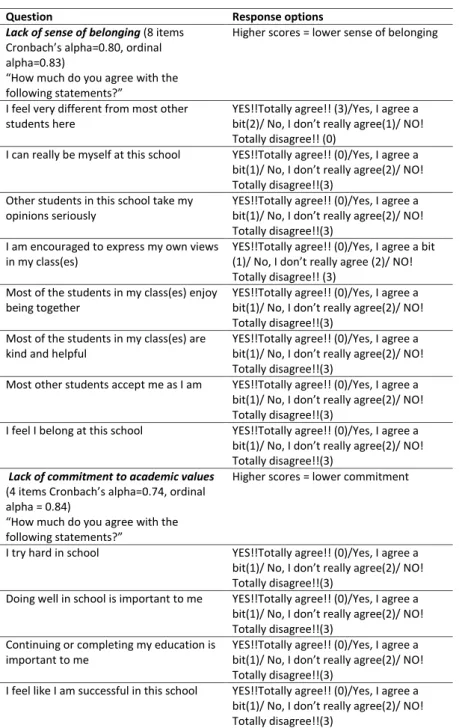
Student lack of commitment to learning and to the school community
These continuous variables were respectively assessed by the 4-item ‘commitment to
academic values’ and the 8-item ‘sense of belonging’ subscales of the Beyond Blue School
Climate Questionnaire (BBSCQ) (table 2). This scale was developed in Australia (Sawyer et
al., 2010) using items from the Gatehouse, (Bond et al., 2004) Quality of School Life, (Epstein
and McPartland, 1976) Patterns of Adaptive Learning, (Roeser et al., 1996) Manitoba School
Improvement Survey (Earl and Lee, 1998) and Psychological Sense of School Membership
(Goodenow, 1993) questionnaires. Cronbach’s alphas for the lack of belonging and
academic commitment sub-scales of 0.85 and 0.82 were reported for a sample of similar age
(personal communication Lyndal Bond 21 July 2011).
[Table 2 about here]
Outcomes
For outcomes, we used self-report single-item binary measures of ever having smoked and
ever having drunk alcohol previously used in the Ripple trial (Stephenson et al., 2008). We
measured school misbehaviour in the last three months using a continuous measured
derived from an amended 13-item version of the Edinburgh Study of Youth Transitions and
Crime (ESYTC) school misbehaviour subscale (table 2), (Bonell et al., 2015; Smith, 2006)
adding three items piloted in a previous study designed to examine threats, hitting/kicking
and getting into fights (Bonell et al., 2015; Smith, 2006). The total score was a summed
frequency of school misbehaviour. The Cronbach’s alpha among a sample of similar age was
0.847 (Bonell et al., 2015).
Analysis
The analysis was performed in several steps, all using Stata version 13.1 (StataCorp, 2013).
Missing data were handled by list-wise deletion.
Step 1: Selecting appropriate models and calculating intra-class correlation coefficients
Multi-level logistic regression analyses were used for the smoking and alcohol outcomes.
The ESYTC measure of school misbehaviour was zero-inflated; 42% of responses were at
zero and the remainder of responses declined in frequency with increasing magnitude. The
variance was much larger than the mean indicating over-dispersion. Therefore for the ESYTC
we used multi-level negative binomial regression and presented the results in the
exponentiated form, as incidence rate ratios (IRR). To interpret IRR, the expected count is
multiplied by a factor of the IRR value when the independent variable increases by one unit.
The intra-class correlation coefficient (ICC) measures the degree of within-cluster
similarity between individuals for a variable. If all observations within schools are
independent of one another, the ICC will be 0. If all the observations within schools are
exactly the same, the ICC will be 1. ICCs for smoking and alcohol were calculated in
intercept-only models using the following formula:
ICC =var(u0)/[var(u0)+π
2/3]
Where var(u0) is the level 2(school) residual variance, and π
2/3 (which is equal to
3.29) is by assumption the variance of the level 1(student) residuals.
To calculate the ICCs for school misbehaviour, we calculated the design effect using
the following formula:
Deff=1+(m-1)ICC
Where Deff is the design effect, and m is the average number of observations per
cluster(school).
We rearranged the formula in the following way to obtain an estimate of the ICC
with our estimate design effect:
ICC=Deff/1+(m-1)
We undertook multi-level analysis estimating associations between VAE and the three
outcomes in unadjusted and adjusted analyses. We adjusted for school-level size (divided by
100 so that coefficients were expressed per 100 student increase), IDACI and FSM, as well as
student-level sex, ethnicity, family structure (student report of the adults they live with
dichotomized into single parent/two parent households), household employment (student
report of whether any adults in the household were in paid work or not), and housing
tenure (student responses to whether their house or flat was rented from the
Council/housing association, rented from a landlord, owned by their family, other, or
whether they didn’t know).
Step 3: Estimating associations between lack of academic commitment and sense of
belonging with student risk behaviours
We used the same method as above to examine the unadjusted and adjusted associations
between our outcomes and lack of student-report belonging and commitment at both the
school and student levels. We analysed school-level and student-level separately.
Step 4: Mediation analysis
Dependent upon the findings from steps 2 and 3, we aimed to assess whether our measures
of lack of belonging and academic commitment at the student or school level mediated the
association between low VAE and risk behaviours. The possibility of co-linearity between the
measures of VAE and school- and student-level lack of belonging and academic commitment
was assessed by examining correlations. However, as described in the results section, there
was no association between VAE and smoking, alcohol, or school misbehaviour
Step 5: Estimating school- and student-level measures of lack of commitment and belonging
simultaneously
We included both student- and school-level lack of belonging and academic commitment in
the same model to examine whether the between-school and within-school associations
were independent. For these models, student-level variables were cluster-mean-centred.
As well as considering the individual coefficients, we also formally tested the null
hypothesis that the school-level and student-level coefficients for lack of belonging and
academic commitment (separately) were equal using the post-estimation command
“lincom”. We used lincom to perform two tailed t-tests of the coefficients for the
school-level mean of lack of belonging minus the coefficient for the cluster-mean-centred
student-level lack of belonging, and the same for lack of academic commitment (Rabe-Hesketh and
Skrondal, 2005). Furthermore, we used likelihood ratio tests to ascertain whether including
both the school-level and student-level values of lack of belonging and academic
commitment resulted in improvements in model fit, compared to models including only the
student level. This would enable us to determine if lack of belonging and academic
commitment appear to be important at both the school and the student level or merely the
latter.
Where both school-level and student-level lack of belonging or academic
commitment were significantly associated with the risk behaviours, we tested cross-level
interactions between these measures, to test whether high overall school levels of lack of
belonging and academic commitment were associated with more risk behaviours for
students having or lacking an individual sense of belonging or commitment to academic
values.
Results
Of eligible students, 6667 (93.6%) completed questionnaires. Of these: 6474 (97%) reported
on ever smoking; 6414 (96%) reported on ever drinking alcohol; and 6265 (94%) responded
to school misbehaviour scale items. Overall 5.4% of students had ever tried smoking and
13.7% had ever drunk alcohol. The mean misbehaviour score was 2.82 (SD 4.81). These
outcomes varied considerably by school: 1.6 to 15.6% for smoking; 0-39% for having drunk
alcohol and 1.07-5.74 for school misbehaviour. The ICCs for these outcomes were 0.071 for
smoking, 0.168 for alcohol and 0.052 for school misbehaviour. The Cronbach’s alpha values
for the school misbehaviour (α=0.89), lack of belonging (α=0.80) and lack of academic
commitment (α=0.74) scales suggested high internal consistency. Descriptive statistics for all
exposures and covariates are shown in table 3.
[Table 3 about here]
Correlations between school-level VAE and school-level lack of belonging (r=-0.23) and
academic commitment (r=0.21), and school-level VAE and student-level lack of belonging
(r=-0.05) and commitment (r=-0.03) were small. Correlations between student-level lack of
belonging and academic commitment were moderate (r=0.37); those between school-level
belonging and commitment were larger (r=0.56). School-level correlations were based on
only 40 observations so this moderate correlation suggests a small number of observations
whereby school-level lack of belonging and academic commitment were disparate.
The unadjusted relationships between the exposures of interest (VAE, lack of
belonging and academic commitment) as well as the covariates with the risk behaviours are
also shown in table 3. VAE was not significantly associated with any of the risk behaviours at
the 5% level of significance; there was a suggestion of a possible association between high
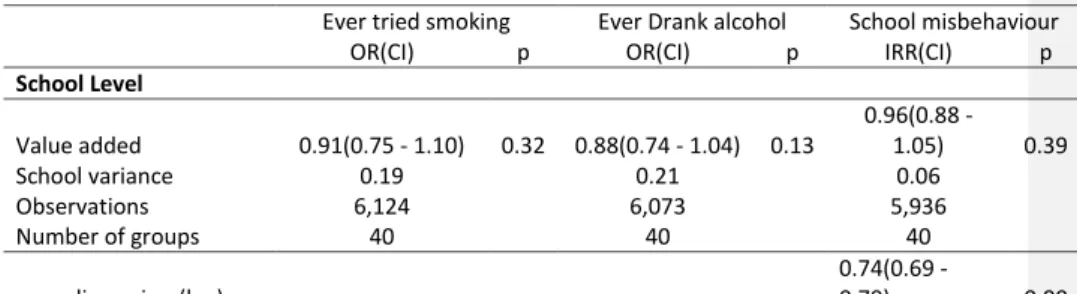
VAE and lower odds of ever having tried smoking. In adjusted models (table 4) VAE was not
significantly associated with ever having tried smoking, ever having tried drinking or school
misbehaviour.
[Table 4 about here]
However, the unadjusted relationships between school-level and student-level lack of
belonging and commitment to academic values with smoking, alcohol and school
misbehaviour were statistically significant. The adjusted relationship between student-level
and school-level belonging and academic commitment and the risk behaviours were
estimated separately (web appendixes 1 and 2). The coefficients were almost identical to
the model in which school-level and student-level cluster-mean-centred lack of belonging
and academic commitment were included in the same model adjusted for confounders
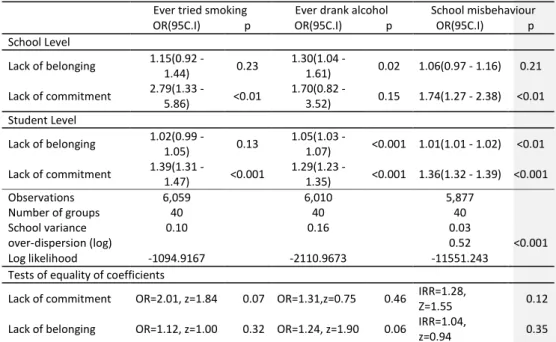
(table 5), hence we only report the results of this model in the main text.
A lower sense of belonging at the student level was significantly associated with
increased odds of ever having drunk alcohol, and school misbehaviour. Student-level lack of
belonging was associated with increased odds of ever having tried smoking, but this
association was not statistically significant. A lower academic commitment at the student
level was associated with increased odds of ever having tried smoking, ever having drunk
alcohol, and school misbehaviour. A lower school-level average of student belonging was
associated with increased odds of students having ever drunk alcohol, but was not
significantly associated with ever having tried smoking or school misbehaviour. A lower
school-level average of student academic commitment was associated with increased odds
of students having ever tried smoking and engaging in school misbehaviour. Lower levels of
school-level academic commitment were associated with increased odds of student ever
having drunk alcohol, but this was not statistically significant.
Likelihood ratio tests comparing the adjusted model (with both student- and
school-level lack of belonging and academic commitment) to the adjusted model including only
student-level lack of belonging and commitment to academic (web appendix 1) indicated
small but significant improvements in model fit for smoking (χ
2(2)=8.24,p=0.02), alcohol
(χ
2(2)=7.49,p=0.02) and school misbehaviour (χ
2(2)=6.60,p=0.04). The significant coefficients
for school- and student-level lack of academic commitment with ever having tried smoking
and school misbehaviour, and school- and student-level belonging with ever having tried
alcohol suggest independent associations for the between- and within-school associations
of lack of academic commitment with smoking. However, tests of the equality of the
school-level and student-school-level lack of belonging and academic commitment coefficients did not
reach statistical significance.
Finally, we tested the interactions between school- and student-level lack of
commitment for ever having tried smoking (OR=0.94, 95%CI 0.77,1.16) and school
misbehaviour (IRR=1.03, 95%CI 0.94,1.14), and the interaction between school- and
student-level lack of belonging for ever having drunk alcohol (OR=0.99, 95%CI 0.97,1.01).
None of the interactions were significant.
Discussion
Summary of key findings
There was no evidence of an association between school-level VAE and any risk behaviours
among students aged 11-12 years. Lower school-level student academic commitment was
associated with increases in smoking and reporting school misbehaviour, and lower
school-level belonging was associated with increases in use of alcohol. Students with lower
academic commitment were more likely to report ever smoking, drinking alcohol or
misbehaving. Students with lower belonging were more likely to report ever drinking
alcohol and engaging in school misbehaviour. At both the school and student levels, lack of
belonging and academic commitment were independently associated with smoking, alcohol
and aggression. However, formal tests of interaction which aimed to assess whether these
effects were independent did not reach statistical significance, probably because the sample
of schools was insufficient.
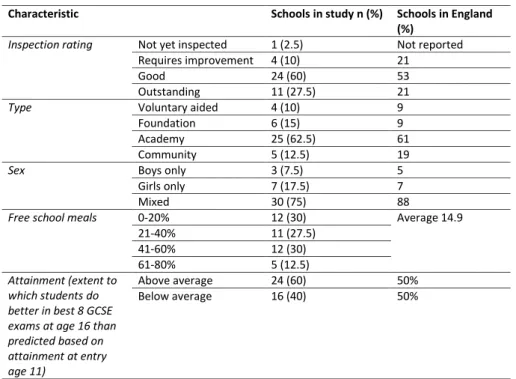
Our sample excluded schools poorly rated by school inspectors and this may have reduced
the range of value-added among our school sample. Compared with English schools overall,
our sample somewhat over-represented highly rated and high-achieving schools, slightly
under-represented community and mixed-sex schools and had more students eligible for
FSM. The measures for ever having tried smoking and drinking alcohol use could not
distinguish regular smoking or drinking from experimentation. The Theory of Human
Functioning and School Organisation would predict that reduced commitment to school
would be associated with the former more than the latter because of its being an indicator
of greater deviance from conventional norms. Use of measures of frequency was precluded
by the low rates of this among students who were aged only 11-12 years. Nonetheless, early
use ever of substances is a good marker of later harmful use (Lando et al., 1999; Viner and
Taylor, 2007). Our study focused on students in their first year of secondary school; school
effects may increase as they move through secondary school. The study was cross-sectional
in nature so that causal directions cannot be inferred, particularly in analyses using our
measures of belonging and academic commitment, which unlike our measure of VAE were
derived from student self-reports. Thus, findings should be considered as
hypothesis-refining rather than testing. Longitudinal research should assess these hypotheses. Our
analysis used the ESYTC measure of school misbehaviour rather than a measure specifically
of violence in contrast to previous research (Tobler et al., 2011). However, we conducted a
sensitivity analysis which repeated all our analyses but focused on the violence only subset
of items (fights in or outside class; purposefully damage school property; threaten a teacher;
hit or kick a teacher; threaten a student; hit or kick a student; and get in a fight), finding that
the pattern of associations is identical and point estimates very similar to that of the full
ESYTC measure.
Implications for research and policy
Our finding of apparent protective effects of student belonging and academic commitment
at the school levels though based on cross-sectional data is an important contribution to
empirically assessing the Theory of Human Functioning and School Organisation, such
associations having previously been examined at the individual (Resnick et al., 1997) but not
school level studies (Bonell et al., 2013b). Our findings suggest that students’ risk of early
use of tobacco and alcohol and engagement in school misbehaviour may be affected not
only by their own commitment to learning and the school community but also by aggregate
levels among their peers as predicted by the theory.
Our finding of no protective association between VAE and reduced risk of
health-compromising behaviours are not unprecedented. A study from Scotland, (Markham et al.,
2012) too recent to be included in the systematic review cited earlier, found small
associations between increased VAE and increased substance use, which were reduced by
adjusting for other indicators of school ethos drawing on aggregate student self-reports. In
the case of our study, it may be that as a result of recent government policy the English
educational system has become even more focused on traditional academic attainment
metrics. In consequence, there may be less of an association between the quality of
education provided by a school and the broader social development of its students (Bonell
et al., 2014b).
Our finding that lower school-level student academic commitment was associated
with increases in smoking and reporting school misbehaviour but not with alcohol might be
explained by experimentation with alcohol being a more normative behaviour less
influenced by processes of disengagement from learning, which fits with the Theory of
Human Functioning and School Organisation’s focus on more deviant behaviours (Markham
and Aveyard, 2003). The association with school misbehaviour is unsurprising and consistent
with this theory. Our finding that lower school-level belonging was associated with increases
in use of alcohol but not with smoking or school misbehaviour is more puzzling. It may be
that because these behaviours were relatively uncommon in our data they may have been
more randomly distributed. Our finding that at the student level lower academic
commitment and lower belonging were associated withself-reported drinking of alcohol and
of misbehaviour is what we would expect from the theory.
As well as the need to assess whether our findings are replicated in longitudinal
analyses, further research is required to examine whether the school as an institution
shapes student commitments to learning and the school community in ways which promote
avoidance of health-compromising behaviours. Observational studies could assess which
aspects of institutional structures or processes are associated with student commitment to
school and health behaviours, but will always be subject to residual confounding. Another
approach is experimental research on whether interventions aiming to modify the school
institutional environment can reduce health-compromising behaviours and whether such
effects are mediated by effects on student commitment to learning and the school
community. Our ongoing trial of the effects of restorative practice on misbehaviour and
bullying is an example, its theory of change being informed by the Theory of Human
Functioning and School Organisation (Bonell et al., 2014a).
Conflict of interest
There are no conflicts of interests, including any financial, personal or other relationships
with other people or organisations, which could inappropriately influence or be perceived to
influence this work. The funder had no involvement in: study design; the collection, analysis,
and interpretation of data; the writing of the report; or the decision to submit the
manuscript for publication. No honoraria were involved in study authorship.
Funding
This project is funded by a grant from the the UK National Institute for Health Research
Public Health Research programme (grant 12/153/60). This report presents independent
research commissioned by the UK National Institute for Health Research (NIHR). The views
and opinions expressed by authors in this publication are those of the authors and do not
necessarily reflect those of the NHS, the NIHR, MRC, CCF, NETSCC, the Public Health
Research programme or the English Department of Health. The work was undertaken with
the support of The Centre for the Development and Evaluation of Complex Interventions for
Public Health Improvement (DECIPHer), a UKCRC Public Health Research Centre of
Excellence. Joint funding (MR/KO232331/1) from the British Heart Foundation, Cancer
Research UK, Economic and Social Research Council, Medical Research Council, the Welsh
Government and the Wellcome Trust, under the auspices of the UK Clinical Research
Collaboration, is gratefully acknowledged.
Supplementary materials
Commented [P5]: Self reported misbehaviour ??
Commented [P6]: Add UK before (if UK-wide fuunder) or ‘in England’ somewhere, if the latter
Commented [P7]: Ditto .. does this cover Scotland>? I wonder which ‘nation’ is being referred to here. Same as above. Pls check Commented [P8]: In England?
The data on which this analysis draws were collected as part of a randomised controlled
trial. They will be made available publically once approval for this has been given by the
trial's data monitoring and ethics committee.
Acknowledgements
We would like to thank the other co-investigators working on the INCLUSIVE trial as well as
the students and staff of the participating schools.
Conflicts of interest statement
The authors declare that they have no conflicts of interest. The funder had no involvement
in: study design; the collection, analysis, and interpretation of data; the writing of the
report; or the decision to submit the manuscript for publication. No honoraria were
involved in study authorship.
Commented [P9]: Do you explain anywhere what this is Commented [I10]: Now added abov
Commented [P11]: Omit, since you have said this in the main body of the text
References
Aveyard P, Markham WA, Lancashire E, et al. (2004) The influence of school culture on
smoking among pupils. Social Science & Medicine 58(9): 1767-1870.
Bisset S, Markham WA and Aveyard P. (2007) School culture as an influencing factor on
youth substance use. Journal of Epidemiology and Community Health 61(6): 485-490.
Bond L, Thomas L, Coffey C, et al. (2004) Long-term impact of the gatehouse project on
cannabis use of 16-year-olds in Australia. Journal of School Health 74(1): 23-30.
Bonell C, Allen E, Christie D, et al. (2014a) Initiating change locally in bullying and aggression
through the school environment (INCLUSIVE): study protocol for a cluster
randomised controlled trial. Trials 15: 381.
Bonell C, Fletcher A, Fitzgerald-Yau N, et al. (2015) A pilot randomised controlled trial of the
INCLUSIVE intervention for initiating change locally in bullying and aggression
through the school environment: final report. Health Technology Assessment 19(53):
1-109.
Bonell C, Fletcher A, Jamal F, et al. (2013a) Theories of how the school environment impacts
on student health: systematic review. Health & Place 24: 242-249.
Bonell C, Humphrey N, Fletcher A, et al. (2014b) Why schools should promote students’
health and wellbeing Education policy shouldn’t focus solely on academic
attainment. British Medical Journal 348: g3078.
Bonell C, Jamal F, Harden A, et al. (2013b) Systematic review of the effects of schools and
school environment interventions on health: evidence mapping and synthesis. Public
Health Research 1(1): 1-319.page range?
Currie C, Molcho M, Boyce W, et al. (2008) Researching health inequalities in adolescents:
the development of the Health Behaviour in School-Aged Children (HBSC) Family
Affluence Scale. Social Science & Medicine 66 (6): 1429-1436.
Department for Education. (2015) IDACI score and rank of IDACI Available at:
http://www.education.gov.uk/cgi-bin/inyourarea/idaci.pl.
Earl LM and Lee LE. (1998) Evaluation of the Manitoba School Improvement Program.
Toronto: University of Toronto/Proactive Information Services Inc.
Epstein JL and McPartland JM. (1976) The concept and measurement of the quality of
school life. American Educational Research Journal 13(1): 15-30.
Fletcher A, Bonell C and Hargreaves J. (2008) School effects on young people's drug use: a
systematic review of intervention and observational studies. Journal of Adolescent
Health 42(3): 209-220.
Goodenow C. (1993) Classroom belonging among early adolescent students relationships to
motivation and achievement. The Journal of Early Adolescence 13(1): 21-43.
Lando HA, Thai DT, Murray DM, et al. (1999) Age of initiation, smoking patterns, and risk in a
population of working adults. Preventive Medicine 29(6 Pt 1): 590-598.
Markham WA. (2015) School culture and teenage substance use: a conceptual and
operational framework Educational Review 67(3): 282-299.
Markham WA and Aveyard P. (2003) A new theory of health promoting schools based on
human functioning, school organisation and pedagogic practice. Social Science &
Medicine 56(6): 1209-1220.
Markham WA, Aveyard P, Bisset SL, et al. (2008) Value-added education and smoking
uptake in schools: a cohort study. Addiction 103(1): 155-161.
Markham WA, Young R, Sweeting H, et al. (2012) Does school ethos explain the relationship
between value-added education and teenage substance use? A cohort study. Social
Science and Medicine 75(1): 69-76.
Rabe-Hesketh S and Skrondal A. (2005) Multilevel and longitudinal modeling using Stata.
College Station, Tex.: Stata Press.
Resnick MD, Bearman PS, Blum RW, et al. (1997) Protecting adolescents from harm: findings
from the national longitudinal study on adolescent harm. Journal of the American
Medical Association 278(10): 823-832.
Roeser RW, Midgley C and Urdan TC. (1996) Perceptions of the school psychological
environment and early adolescents' psychological and behavioral functioning in
school: The mediating role of goals and belonging. Journal of Educational Psychology
88(3): 408-422.
Sawyer MG, Pfeiffer S, Spence SH, et al. (2010) School-based prevention of depression: a
randomised controlled study of the Beyond Blue schools research initiative. Journal
of Child Psychology and Psychiatry 51(2): 199-209.
Smith DJ. (2006) School experience and delinquency at ages 13 to 16. Edinburgh: Centre for
Law and Society, University of Edinburgh.
StataCorp. (2013) Stata Statistical Software: Release 13, College Station, TX: StataCorp.
Stephenson J, Strange V, Allen E, et al. (2008) The long-term effects of a peer-led sex
education programme (RIPPLE): a cluster randomised trial in schools in England. PLoS
Med 5(11): e224.
Tobler AL, Komro KA, Dabroski A, et al. (2011) Preventing the link between SES and high-risk
behaviors: “Value-added” education, drug use and delinquency in high-risk, urban
schools. Prevention Science 12(2): 211–221.
Viner RM, Ozer EM, Denny S, et al. (2012) Adolescence and the social determinants of
health. Lancet 379(9826): 1641-1652.
Viner RM and Taylor B. (2007) Adult outcomes of binge drinking in adolescence: findings
from a UK national birth cohort. J Epidemiol Community Health 61(10): 902-907.
von Elim E, Altman DG and Egger M. (2007) Strengthening the reporting of observational
studies in epidemiology (STROBE) statement: guidelines for reporting observational
studies. BMJ 335: 806-808.
West P, Sweeting H and Leyland A. (2004) School effects on pupils' health behaviours:
evidence in support of the health promoting school. Research Papers in Education
19(3): 261-291.
Table 1: Characteristics of schools that participated in the study 2014-2017
Characteristic Schools in study n (%) Schools in England (%)
Inspection rating Not yet inspected 1 (2.5) Not reported
Requires improvement 4 (10) 21
Good 24 (60) 53
Outstanding 11 (27.5) 21
Type Voluntary aided 4 (10) 9
Foundation 6 (15) 9 Academy 25 (62.5) 61 Community 5 (12.5) 19
Sex Boys only 3 (7.5) 5
Girls only 7 (17.5) 7
Mixed 30 (75) 88
Free school meals 0-20% 12 (30) Average 14.9
21-40% 11 (27.5) 41-60% 12 (30) 61-80% 5 (12.5) Attainment (extent to
which students do better in best 8 GCSE exams at age 16 than predicted based on attainment at entry age 11)
Above average 24 (60) 50% Below average 16 (40) 50%
Table 2: Scales used for belonging, commitment and school misbehaviour
Question Response options
Lack of sense of belonging (8 items
Cronbach’s alpha=0.80, ordinal alpha=0.83)
“How much do you agree with the following statements?”
Higher scores = lower sense of belonging
I feel very different from most other students here
YES!!Totally agree!! (3)/Yes, I agree a bit(2)/ No, I don’t really agree(1)/ NO! Totally disagree!! (0)
I can really be myself at this school YES!!Totally agree!! (0)/Yes, I agree a bit(1)/ No, I don’t really agree(2)/ NO! Totally disagree!!(3)
Other students in this school take my opinions seriously
YES!!Totally agree!! (0)/Yes, I agree a bit(1)/ No, I don’t really agree(2)/ NO! Totally disagree!!(3)
I am encouraged to express my own views in my class(es)
YES!!Totally agree!! (0)/Yes, I agree a bit (1)/ No, I don’t really agree (2)/ NO! Totally disagree!! (3)
Most of the students in my class(es) enjoy being together
YES!!Totally agree!! (0)/Yes, I agree a bit(1)/ No, I don’t really agree(2)/ NO! Totally disagree!!(3)
Most of the students in my class(es) are kind and helpful
YES!!Totally agree!! (0)/Yes, I agree a bit(1)/ No, I don’t really agree(2)/ NO! Totally disagree!!(3)
Most other students accept me as I am YES!!Totally agree!! (0)/Yes, I agree a bit(1)/ No, I don’t really agree(2)/ NO! Totally disagree!!(3)
I feel I belong at this school YES!!Totally agree!! (0)/Yes, I agree a bit(1)/ No, I don’t really agree(2)/ NO! Totally disagree!!(3)
Lack of commitment to academic values (4 items Cronbach’s alpha=0.74, ordinal alpha = 0.84)
“How much do you agree with the following statements?”
Higher scores = lower commitment
I try hard in school YES!!Totally agree!! (0)/Yes, I agree a bit(1)/ No, I don’t really agree(2)/ NO! Totally disagree!!(3)
Doing well in school is important to me YES!!Totally agree!! (0)/Yes, I agree a bit(1)/ No, I don’t really agree(2)/ NO! Totally disagree!!(3)
Continuing or completing my education is important to me
YES!!Totally agree!! (0)/Yes, I agree a bit(1)/ No, I don’t really agree(2)/ NO! Totally disagree!!(3)
I feel like I am successful in this school YES!!Totally agree!! (0)/Yes, I agree a bit(1)/ No, I don’t really agree(2)/ NO! Totally disagree!!(3)
School misbehaviour (13 items;
Cronbach’s alpha=0.89, ordinal alpha=0.96)
“During the last 3 months how often did you do these things at school?”
Higher scores = increased misbehaviour
Arrive late for classes 0=hardly ever or never; 1=less than once a week; 2=at least once a week; 3=most days
Fight in or outside the class
Refuse to do homework or class work Be cheeky to a teacher
Use bad or offensive language
Wander around school during class time Threaten a teacher
Hit/kick a teacher
Cheat doing homework or tests Purposely damage or destroy things belonging to the school
Threaten another student Hit/kick another student Get in a fight
Table 3. Descriptive statistics and unadjusted relationships between exposures and outcomes, and covariates and outcomes
Ever tried smoking
Ever Drank alcohol
School misbehaviour
Exposure
prevalence/
mean (SD)
Prevalence
of outcome
by exposure
category
Prevalence
of outcome
by exposure
category
Mean of
outcome
by
exposure
category
Unadjusted
OR(CI)
p
Unadjusted
OR(CI)
p
Unadjusted
IRR(CI)
p
School Level
Value added
0.00(1.00)
0.85(0.70 -
1.02)
0.09
0.84(0.64 -
1.10)
0.20
0.94(0.83 -
1.07)
0.37
Lack of belonging
8.17(0.95)
1.45(1.21 -
1.74)
<0.001
1.35(1.03 -
1.76)
0.03
1.31(1.17 -
1.46)
<0.001
Lack of commitment
1.47(0.26)
3.48(1.86 -
6.51)
<0.001
3.80(1.49 -
9.73)
<0.01
2.01(1.28 -
3.15)
<0.01
School size
10.84(3.21)
0.93 (0.88 -
0.99)
<0.05
0.98(0.91
-1.07)
0.71
0.98(0.94 -
1.02)
0.31
FSM
0.35(0.20)
2.09(0.80 -
5.50)
0.13
0.17(0.05 -
0.58)
<0.001
3.50(2.11 -
5.80)
<0.001
IDACI
0.25(0.20)
1.92(0.73 -
5.01)
0.19
0.26(0.07 -
0.94)
<0.05
3.69(2.26 -
6.01)
<0.001
EAL
0.33(0.25)
1.32(0.61 -
2.84)
0.48
0.07(0.03 -
13.72)
<0.001
2.13(1.35 -
3.47)
<0.01
Student Level
Lack of belonging
8.07(4.40)
1.09(1.06 -
1.11)
<0.001
1.09(1.07 -
1.10)
<0.001
1.06(1.05 -
1.07)
<0.001
Lack of commitment
1.45(1.65)
1.43(1.36 -
1.51)
<0.001
1.34(1.29 -
1.40)
<0.001
1.39(1.36 -
1.43)
<0.001
Gender
Male
47% 6.11%(5.26 - 6.97)
16.16%(14.83 - 17.48)
3.49(3.29 - 3.69)
Female
53% 4.43%(3.79 - 5.13)
<0.05
11.59%(10.51 - 12.67)
<0.001
2.21(2.07 - 2.35)
<0.001
Ethnicity
White British
40% 4.97%(4.13 - 5.82)
19.84%(18.28 - 21.38)
2.27(2.11 - 2.43)
White Other
9% 5.3% (3.42 - 7.18)
13.94%(11.03 - 16.86)
2.90(2.50 - 3.31)
Asian/ Asian British
25% 3.73%(2.91 - 4.77)
3.76%(2.93 - 4.82)
2.74(2.50 - 2.98)
Black/Black British
14% 7.84%(6.23 - 9.83)
13.45%(11.32 - 15.91)
4.25(3.86 - 4.65)
Mixed ethnicity
7% 6.98%(4.95 - 9.76)
16.78%(13.55 - 20.60)
3.01(2.57 - 3.46)
Other (including
Chinese)
6% 5.42%(3.52 - 8.26)
<0.001
11.47%(8.59 - 15.17)
<0.001
3.30(2.71 - 3.88)
<0.001
Family Affluence
Low
3% 7.33%(3.60-11.06)
11.70%(7.06-16.33)
3.27(2.55-4.00)
Medium
34% 5.49%(4.51-6.46)
10.92%(9.58-12.26)
3.25(3.02-3.48)
High
63% 4.98%(4.30-5.64)
0.47 15.45%(14.32-16.58)
0.15 2.56(2.41-2.70)
<0.05
Household
composition
Single parent
household
19% 8.69%(7.10-10.27)
18.64%(16.43 - 20.84)
4.09(3.74 - 4.44)
Two parent
household
81% 4.47%(3.91-5.03)
<0.001
12.65%(11.74 - 13.55)
<0.001
2.52 (2.40 - 2.65)
<0.001
Employment status of parents
At least one parent in
work
74%
7.34%(5.36 - 9.97)
13.91%(11.13 - 17.25)
3.58(3.07 - 4.10)
Neither parent
8% 4.68%(4.11 - 5.32)
14.57%(13.59 - 15.61)
2.58(2.45 - 2.71)
don't know
18% 6.34%(5.07 - 7.91)
<0.05
10.61%(8.95 - 12.53)
0.08 3.37(3.06 - 3.69)
<0.001
Housing tenure
Rented from
council/housing
association
16%
6.93%(5.52 - 8.67)
13.94%(11.93 - 16.24)
3.65(3.30 - 4.00)
Rented from landlord
12% 7.43%(5.77 - 9.52)
12.02%(9.89 - 14.54)
2.87(2.55 - 3.19)
Owned by
family/mortgage
42%
4.18%(3.49 - 5.01)
15.67%(14.33 - 17.10)
2.27(2.11 - 2.43)
Other
2% 5.26%(2.37 - 11.26)
18.92%(12.64 - 27.33)
3.58(2.57 - 4.60)
Table 4. Adjusted relationship between VAE and outcomes
Ever tried smoking Ever Drank alcohol School misbehaviour OR(CI) p OR(CI) p IRR(CI) p
School Level Value added 0.91(0.75 - 1.10) 0.32 0.88(0.74 - 1.04) 0.13 0.96(0.88 - 1.05) 0.39 School variance 0.19 0.21 0.06 Observations 6,124 6,073 5,936 Number of groups 40 40 40 over-dispersion (log) 0.74(0.69 - 0.79) 0.00 Adjusted for school level covariates (school size, FSM, IDACI) and student level covariates (sex,
ethnicity, household composition, parental work status and tenure). Full model presented in web appendix 3
Table 5. Adjusted relationship between School (between) and student (within) level belonging and outcomes
Ever tried smoking Ever drank alcohol School misbehaviour OR(95C.I) p OR(95C.I) p OR(95C.I) p
School Level Lack of belonging 1.15(0.92 - 1.44) 0.23 1.30(1.04 - 1.61) 0.02 1.06(0.97 - 1.16) 0.21 Lack of commitment 2.79(1.33 - 5.86) <0.01 1.70(0.82 - 3.52) 0.15 1.74(1.27 - 2.38) <0.01 Student Level Lack of belonging 1.02(0.99 - 1.05) 0.13 1.05(1.03 - 1.07) <0.001 1.01(1.01 - 1.02) <0.01 Lack of commitment 1.39(1.31 - 1.47) <0.001 1.29(1.23 - 1.35) <0.001 1.36(1.32 - 1.39) <0.001 Observations 6,059 6,010 5,877 Number of groups 40 40 40 School variance 0.10 0.16 0.03 over-dispersion (log) 0.52 <0.001 Log likelihood -1094.9167 -2110.9673 -11551.243 Tests of equality of coefficients Lack of commitment OR=2.01, z=1.84 0.07 OR=1.31,z=0.75 0.46 IRR=1.28,
Z=1.55 0.12 Lack of belonging OR=1.12, z=1.00 0.32 OR=1.24, z=1.90 0.06 IRR=1.04,
z=0.94 0.35 Adjusted for school level covariates (school size, FSM, IDACI) and student level covariates (sex,
ethnicity, household composition, parental work status and tenure). Full model presented in web appendix 4.