Separation, Characterization and
Fouling Potential of Sludge Waters from
Different Biological Wastewater
Treatment Processes
Dissertation/Thesis by
Jinkai Xue
In Partial Fulfillment of the Requirements
for the Degree of Master of Science
King Abdullah University of Science and
Technology, Thuwal,
Kingdom of Saudi Arabia
July 2011
EXAMINATION COMMITTEE APPROVALS FORM
The dissertation/thesis of Jinkai Xue is approved by the
examination committee.
Committee Chairperson: Gary Amy
Committee Member: Pascal Saikaly
ABSTRACT
Separation, Characterization and Fouling Potential of Sludge
Waters from Different Biological Wastewater Treatment
Processes
Jinkai Xue
The major limitation, which hinders the wider application of membrane technology and increases the operating costs of membranes involved in
wastewater treatment plants, is membrane fouling induced by organic matter. Extracellular polymeric products (EPS) and soluble microbial products (SMP) are the two most mentioned major foulants in publications, for which the debate on precise definitions seems to be endless. Therefore, a concept of sludge water, which conceptually covers both EPS and SMP, has been developed in this
research.
A standard procedure of sludge water separation, which is centrifugation at 4000g for 15 min followed by 1.2μm glass fiber filter filtration, was established based on separation experiments with membrane tank sludge from the KAUST MBR wastewater treatment plant. Afterwards, sludge waters from the KAUST MBR WWTP anoxic tank, aerobic tank and membrane tank as well as sludge waters from the Jeddah WWTP anoxic tank, aerobic tank and secondary effluent were produced through the previously developed standard procedure.
The obtained sludge water samples were thereafter characterized with TOC/COD, LC-‐OCD and F-‐EEM, which showed that KAUST anoxic/ aerobic /membrane tank sludge waters had similar characteristics for all investigated parameters, yet the influent naturally had a higher DOC and biopolymer
concentration. Moreover, lower TOC/COD, negligible biopolymers and low levels of humics were found in KAUST effluent. Compared with the KAUST MBR WWTP, the Jeddah WWTP’s sludge waters generally had higher DOC and biopolymer concentrations.
To investigate sludge water fouling potential, the KAUST membrane tank sludge water as well as the Jeddah secondary effluent were filtrated through a
membrane array consisting of an ultrafiltration (UF) Millipore RC10kDa at the first step followed by a nanofiltration (NF) KOCH Acid/Base stable NF200 at the second step. It was found that cake layer and standard blocking occurred
simultaneously during both of these filtration processes. For the KAUST MBR membrane tank sludge water and the Jeddah WWTP effluent, the fouling potential of humic/building blocks was much higher than that of biopolymers. Compared with the KAUST MBR membrane tank sludge water, the Jeddah WWTP effluent had comparable biopolymer fouling potential and higher humic/building blocks fouling potential.
TABLE OF CONTENTS
EXAMINATION COMMITTEE APPROVALS FORM ... 2
ABSTRACT ... 3
TABLE OF CONTENTS ... 5
ABBREVIATIONS ... 7
List of Figures ... 10
List of Tables ... 13
I. Introduction ... 14
1.1 General review ... 14
1.1.1 Necessity of wastewater reuse and recycle ... 14
1.1.2 Membrane technologies for wastewater reuse ... 15
1.2 Membrane fouling in wastewater treatment and reuse ... 19
1.2.1 Categories of membrane fouling ... 19
1.2.2 Dominant foulants and the identification ... 21
1.2.3 Factors affecting membrane fouling ... 25
1.2.4 Measures to mitigate membrane fouling and restoration of membrane performance ... 25
1.3 Fouling analysis for low-‐pressure membranes ... 26
1.3.1 Fouling models ... 26
1.3.2 Fouling index ... 29
1.4 Sludge water ... 31
1.4.1 Definition of sludge water ... 31
1.4.2 Separation methods ... 32
1.4.3 Characterization ... 32
1.4.4 Additional work needing to be done ... 33
1.5 Structure of this thesis ... 33
II. Methodology ... 36
2.1 Separation of sludge water ... 36
2.2 Analytical measurements ... 37
2.2.1 Chemical oxygen demand (COD) ... 37
2.2.2 Total organic carbon (TOC) ... 37
2.2.3 Liquid chromatography with online organic carbon detection (LC-‐OCD) ... 38
2.2.4 Fluorescence excitation-‐emission matrix (F-‐EEM) ... 40
2.3 Filtration experiment set-‐up and data processes ... 42
III. Separation Methods of Sludge Water ... 46
3.1 Sludge samples ... 47
3.2 Separation methods of sludge water ... 47
3.2.1 Centrifugation followed by filtration ... 48
3.2.2 Sedimentation followed by filtration ... 48
3.3 Comparisons of different separation methods ... 49
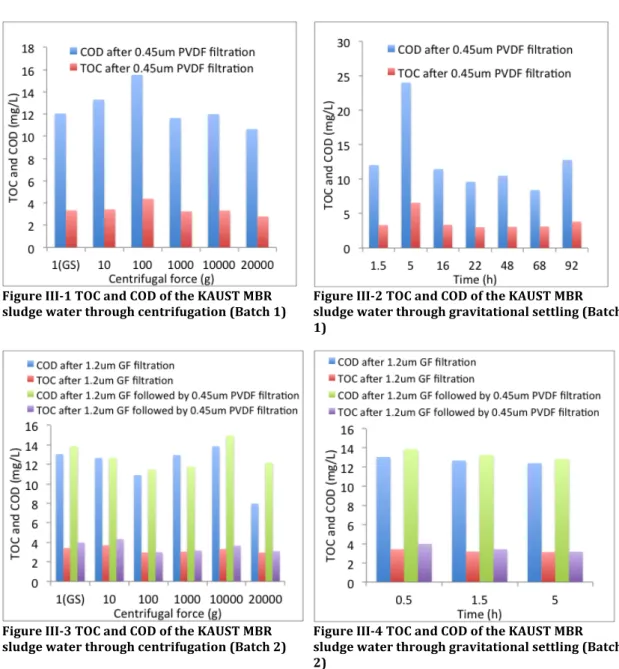
3.3.1 TOC/COD ... 49
3.3.2 LC-‐OCD analysis ... 50
3.3.3 Fluorescence excitation-‐emission matrix (F-‐EEM) analysis ... 52
3.4 Standard separation method of sludge water ... 55
IV. Characterization of Sludge Water ... 57
4.2 TOC/COD analysis ... 58
4.2.1 KAUST MBR WWTP sludge waters ... 58
4.2.2 Jeddah WWTP sludge waters ... 59
4.3 LC-‐OCD analysis ... 59
4.3.1 KAUST MBR WWTP sludge waters ... 60
4.3.2 Jeddah WWTP sludge waters ... 62
4.4 Fluorescence EEM analysis ... 63
4.4.1 KAUST MBR WWTP sludge waters ... 63
4.4.2 Jeddah WWTP sludge waters ... 65
V. Fouling Potential of Sludge Water ... 67
5.1 Membrane selection ... 67
5.1.1 UF membrane selection ... 69
5.1.2 NF membrane selection ... 72
5.1.3 Membrane selected ... 75
5.2 Sludge water filtration experiments ... 76
5.2.1 UF membranes – Millipore RC10kDa ... 77
5.2.2 NF membranes – KOCH A/B NF200 ... 79
5.3 Summary of fouling tests ... 80
VI. Conclusions and Recommendations ... 83
6.1 Separation method of sludge water ... 83
6.2 Characterization of sludge water ... 84
6.3 Fouling potential of sludge water ... 85
6.4 Recommendations ... 86 References ... 88 Appendix 1 ... 95 ACKNOWLEDGEMENT ... 98
ABBREVIATIONS
A effective membrane area (cm2)AeSW aerobic tank sludge water AnSW anoxic tank sludge water
COD chemical oxygen demand (mg/L)
d day
DOC dissolved organic carbon DON dissolved organic nitrogen EfOM effluent organic matters
EPS extracellular polymeric substances F-‐EEM fluorescence excitation-‐emission matrix g gravitational acceleration (m/s2)
g gram
h hour
HRT hydraulic retention time (h)
I index for the propensity of particles in water to form a layer with hydraulic resistance (1/m2)
J flux (LHM)
k model variable of Hermia’s model; kilo
L liter
LC-‐OCD liquid chromatography with online organic carbon detector
M molar concentration
MBR membrane bioreactor
MFI modified fouling index (s/m6)
MFIs fouling index for standard blocking model (1/m)
mg milligram
min minute
ml milliliter
MLSS mixed liquor suspended solids
MLVSS mixed liquor volatile suspended solids
MQ Milli-‐Q water
MTSW membrane tank sludge water MWCO molecular weight cut-‐off
NF nanofiltration
NOM natural organic matters
n dimensionless model variable of Hermia’s model
PES polyethersulfone PVDF polyvinylidene fluoride RC regenerated cellulose Rm membrane resistance (1/m) RO reverse osmosis s second
SDI silt density index
SMFI specific modified fouling index(s/m2)
SMP soluble microbial products SRT sludge retention time (d)
SS suspended solids
TOC total organic carbon (mg/L)
UF ultrafiltration
UV ultraviolet
V accumulative filtrate volume (ml) VSS volatile suspended solids
WWTP wastewater treatment plant η fluid viscosity (N-‐s/m2)
ΔP, TMP applied tans-‐membrane pressure (bar)
List of Figures
Figure I-‐1 Activated sludge process ... 18
Figure I-‐2 Configurations of membrane bioreactor: a) sidestream and b) immersed ... 18
Figure I-‐3 Scheme of four fouling mechanisms ... 28
Figure II-‐1 Scheme of LC-‐OCD Model 8 [53] ... 39
Figure II-‐2 An example of LC-‐OCD result [55] ... 40
Figure II-‐3 EEM contour figure of KAUST MBR WWTP influent ... 42
Figure II-‐4 Schematic diagram of filtration set-‐up ... 43
Figure III-‐1 TOC and COD of the KAUST MBR sludge water through centrifugation (Batch 1) ... 49
Figure III-‐2 TOC and COD of the KAUST MBR sludge water through gravitational settling (Batch 1) ... 49
Figure III-‐3 TOC and COD of the KAUST MBR sludge water through centrifugation (Batch 2) ... 49
Figure III-‐4 TOC and COD of the KAUST MBR sludge water through gravitational settling (Batch 2) ... 49
Figure III-‐5 OCD of sludge water through centrifugation (Batch 1) ... 51
Figure III-‐6 OCD of sludge water through centrifugation (Batch 2) ... 51
Figure III-‐7 OCD of sludge water through gravitational settling (Batch 1) ... 51
Figure III-‐8 OCD of sludge water through gravitational settling (Batch 2) ... 51
Figure III-‐9 The F-‐EEM contour plot of sludge water by gravitational settling for 1.5h(Batch 1) ... 52
Figure III-‐10 The F-‐EEM contour plot of sludge water by gravitational settling for 0.5h(Batch 2) ... 52
Figure III-‐11 F-‐EEM quantitative comparison of sludge water by centrifugation (Batch 1) ... 52
Figure III-‐12 F-‐EEM quantitative comparison of sludge water by gravitational settling (Batch 1) ... 52
Figure III-‐13 F-‐EEM quantitative comparison of sludge water by centrifugation (Batch 2) ... 53
Figure III-‐14 F-‐EEM quantitative comparison of sludge water by gravitational settling (Batch 2) ... 53
Figure IV-‐1 COD/TOC of sludge waters from the KAUST MBR WWTP ... 59
Figure IV-‐2 COD/TOC of sludge waters from the Jeddah WWTP ... 59
Figure IV-‐3 OCD of the KAUST MBR WWTP sludge waters (1:2 stands for “diluted twice”) ... 61
Figure IV-‐4 OND of the KAUST MBR WWTP sludge waters ... 61
Figure IV-‐5 UVD of the KAUST MBR WWTP sludge waters ... 61
Figure IV-‐6 OCD of the Jeddah WWTP sludge waters ... 61
Figure IV-‐7 OND of the Jeddah WWTP sludge waters ... 61
Figure IV-‐8 UVD of the Jeddah WWTP sludge waters ... 61
Figure IV-‐9 Quantitative biopolymer DOC/DON comparison of the KAUST MBR WWTP sludge waters ... 62
Figure IV-‐10 Quantitative biopolymer DOC/DON comparison of the Jeddah WWTP sludge waters ... 62
Figure IV-‐11 F-‐EEM contour image of the KAUST MBR WWTP influent sludge water ... 63
Figure IV-‐12 F-‐EEM contour image of the KAUST MBR WWTP anoxic sludge
water (AnSW) ... 63
Figure IV-‐13 F-‐EEM contour image of the KAUST MBR WWTP aerobic sludge water (AeSW) ... 63
Figure IV-‐14 F-‐EEM contour image of the KAUST MBR WWTP membrane tank sludge water (MTSW) ... 63
Figure IV-‐15 F-‐EEM contour image of the KAUST MBR WWTP effluent sludge water ... 64
Figure IV-‐16 F-‐EEM contour of the Jeddah WWTP influent sludge water ... 66
Figure IV-‐17 F-‐EEM contour of the Jeddah WWTP anoxic sludge water ... 66
Figure IV-‐18 F-‐EEM contour of the Jeddah WWTP aerobic sludge water ... 66
Figure IV-‐19 F-‐EEM contour of the Jeddah WWTP effluent sludge water ... 66
Figure V-‐1 Feed-‐initial permeate-‐final permeate TOC of KAUST MTSW filtration with KOCH PVDF100kDa membrane rinsed with Milli-‐Q water ... 69
Figure V-‐2 Feed-‐initial permeate-‐final permeate TOC of KAUST AeSW filtration with Millipore RC100kDa membrane rinsed with NaOH+ Milli-‐Q water ... 69
Figure V-‐3 Comparison of OCD results for MTSW filtration by UF membranes .. 71
Figure V-‐4 Comparison of OND results for MTSW filtration by UF membranes .. 71
Figure V-‐5 Comparison of UVD results for MTSW filtration by UF membranes .. 71
Figure V-‐6 Quantitative comparison of biopolymer rejection performance of selected UF membranes ... 71
Figure V-‐7 OCD comparison of sludge water permeates by different KOCH NFs and Dow NF membranes ... 73
Figure V-‐8 OND comparison of sludge water permeates by different KOCH NFs and Dow NF membranes ... 73
Figure V-‐9 UVD comparison of sludge water permeates by different KOCH NFs and Dow NF membranes ... 73
Figure V-‐10 Humic substances/building blocks rejection performance of KOCH A/B NF200 ... 73
Figure V-‐11 OCD comparison of final permeates by GE NF membranes ... 75
Figure V-‐12 OND comparison of final permeates by GE NF membranes ... 75
Figure V-‐13 UVD comparison of final permeates by GE NF membranes ... 75
Figure V-‐14 Humic substances/ building blocks rejection performance of GE DK ... 75
Figure V-‐15 DOC rejection performance (OCD signal from LC-‐OCD) of the membrane array during KAUST MTSW filtration ... 77
Figure V-‐16 DOC rejection performance (OCD signal from LC-‐OCD)of the membrane array during Jeddah effluent filtration ... 77
Figure V-‐17 Cake layer model of Millipore RC10kDa membrane (MTSW) ... 78
Figure V-‐18 Standard blocking model of Millipore RC10kDa membrane (MTSW) ... 78
Figure V-‐19 Cake layer model of Millipore RC10kDa membrane (Jeddah effluent) ... 78
Figure V-‐20 Standard blocking model of Millipore RC10kDa membrane (Jeddah effluent) ... 78
Figure V-‐21 Cake layer model of KOCH A/B NF200 membrane (MTSW filtrated with RC10kDa) ... 79
Figure V-‐22 Standard blocking model of KOCH A/B NF200 membrane (MTSW filtrated with RC10kDa) ... 79
Figure V-‐23 Cake layer model of KOCH A/B NF200 membrane (Jeddah effluent filtrated with RC10kDa) ... 79 Figure V-‐24 Standard blocking model of KOCH A/B NF200 membrane (Jeddah
List of Tables
Table I-‐1 Membrane classification [8] ... 15
Table I-‐2 Summary of four fouling mechanisms based on Hermia's Model ... 29
Table II-‐1 Filtration cells used in this research ... 43
Table III-‐1 Distribution of peaks in F-‐EEM[62] ... 54
Table IV-‐1 Quantitative comparison of SS and VSS ... 58
Table IV-‐2 LC-‐OCD quantitative biopolymer results of KAUST MBR WWTP sludge waters ... 62
Table IV-‐3 LC-‐OCD quantitative biopolymer results of Jeddah WWTP sludge waters ... 62
Table IV-‐4 F-‐EEM peaks of KAUST WWTP sludge waters ... 64
Table IV-‐5 F-‐EEM peaks of Jeddah WWTP sludge waters ... 65
Table V-‐1 Membranes used for fouling potential investigation ... 68
Table V-‐2 Test details for UF membrane candidates ... 70
Table V-‐3 Test details for KOCH and Dow NF membranes ... 72
Table V-‐4 Test details for GE NF membranes ... 74
Table V-‐5 UF and NF membranes selected ... 76
Table V-‐6 Summary of fouling potential experiments ... 81
I.
Introduction
1.1 General review1.1.1 Necessity of wastewater reuse and recycle
It is well known that many parts of the world are facing an increasingly severe water shortage. As is known, more than 70% of the surface of this planet is covered by the ocean[1]. However, most of the global water is not usable for mankind due to the presence of unfavorable substances in water or
inaccessibility of the water body. For example, the water may contain high concentrations of bacteria, salts and even anthropogenic contaminants. 97% of global water exists as salt water, i.e. the oceans. Of the remaining 3%, 2/3rds are
snow and glaciers in the polar and alpine regions. Hence, only around 1% of global water exists in the form of accessible freshwater. Nevertheless, almost 98% of this tiny portion of usable water is in underground. Only 2% of liquid freshwater can be found in the forms of streams and lakes[2]. Besides, most precipitation falling to land every year escapes into the atmosphere through evaporation[3].
On the other hand, the world population is growing so fast that it is usually described as a “global population explosion”. Water resources are, therefore, becoming scarce in many countries all over the world as a result of population growth, increasing pollution, poor water management practices and climatic changes. According to some recent projections, 2/3rds of the human population
will be suffering moderate water stress and half will confront real constraints of water supply in 2050. This severe scenario makes it an increasing trend to
require more efficient utilization of water resources, in both of urban and rural regions. A prime approach that can be employed to improve the efficiencies of water consumption is the recycling of water, which once would be discharged into the environment after use[4-‐6]. The implementation of wastewater reuse will close the path of water cycle between wastewater and fresh water and therefore, contribute to the achievement of sustainable use of the limited available fresh water resources[7].
1.1.2 Membrane technologies for wastewater reuse
Different approaches have been and are being developed to alleviate the shortage of fresh water, among which membrane filtration is currently
considered to be one of the most promising technologies for water treatment. A membrane is an artificial structure used to remove dissolved substances, colloids and particles from the feed water to reduce the load of bulk and trace organic and inorganic materials/contaminants, contingent on the membrane’s pore size or molecular weight cut-‐off (MWCO). Membranes are categorized into different types according to their separation range (pore size or MWCO). There are basically four types of membranes applied for water treatment, which are listed in Table I-‐1[7].
Table I-‐1 Membrane classification [8]
Membrane type Pore size Operation pressure Rejects Microfiltration
(MF) 0.05~10 μm (0.45 μm) 0.2~3.5 Bar Bacteria, fragmented cells, large viruses or colloids Ultrafiltration
(UF) 1~50nm 1~10 Bar Viruses, Polymers, proteins, colloids, silica Nanofiltration
(NF) Typically 2nm 3.5~21 Bar
Neutral molecules (sugar, pesticides) and multivalent salts
Reverse
Among the four different types of membranes, high-‐pressure membranes (RO and NF) are less applied in WWTP, whereas it is common to find low-‐pressure membranes (UF and MF) in different points in wastewater process. MF and UF are often integrated into biological processes as membrane bioreactors (MBRs).
Basically, there are two aims of wastewater reuse, which are potable-‐use wastewater reuse and non-‐potable-‐use wastewater reuse. For non-‐potable wastewater reuse, membrane technology is usually combined with biological processes in terms of conventional activated sludge followed by
microfiltration/ultrafiltration (CAS-‐MF/UF) or membrane bioreactor (MBR). As for potable-‐use wastewater reuse, high-‐pressure membranes such as nano-‐ filtration (NF) and reverse osmosis (RO) and other treatment processes, such as disinfection, may be added after CAS-‐MF/UF or MBR processes. However, potable-‐use wastewater treatment is not the first option due to its high operational cost and low public acceptability. Therefore, non-‐potable-‐use wastewater reuse is the primary option so far.
The activated sludge process refers to biological treatment processes that use a suspended growth of organisms to remove biological oxygen demand (BOD) and suspended solids. As is shown in Figure I-‐1, the process requires an aeration tank and a settling tank. The conventional activated sludge (CAS) process requires primary treatment while influent (primary effluent) and returned activated sludge (RAS) enter the tank at the head end of the basin; mixing is accomplished by the aeration system. On the downside, this configuration
requires a large aeration tank capacity, higher construction costs, high initial oxygen demand, and is very sensitive to operation problems, such as bulking.[9, 10]
Currently, the CAS process is widely used throughout all over the world.
Compared with completely transforming the process into MBR treatment, it is an economical and realistic option for conventional plants to update their facilities by adding a low-‐pressure membrane MF or UF to the original CAS treatment system. This CAS treatment (secondary treatment) followed by MF/UF (tertiary treatment) is called CAS-‐MF/UF. The MF/UF membranes employed in tertiary treatment are dedicated to remove suspended solids, organic matter contained in secondary effluent, and for disinfection, recovering a high quality final effluent for various possible uses. The application of low-‐pressure membranes can bring about some attractive benefits over conventional treatment. This physical barrier is able to produce recycled water of uniform quality, regardless of the normally wide variations in the concentrations and physiochemical properties of wastewater influent. Moreover, the absence of chemical additions reduces the operational costs, and brings about environmental benefits[11].
Besides CAS-‐MF/UF, the MBR process is another choice for biological treatment of wastewater. An MBR is the combination of a membrane process like
microfiltration or ultrafiltration with a suspended growth bioreactor, and is now widely used for municipal and industrial wastewater treatment with plant sizes up to 80,000-‐population equivalent (i.e. 48 MLD)[12].
Figure I-‐1 Activated sludge process
Figure I-‐2 Configurations of membrane bioreactor: a) sidestream and b) immersed
The successfully wide application of MBR is ascribed to several benefits, which are 1) significantly more compact than conventional processes (the footprint can be 1/10 of the latter), 2) reduced quantities of excess sludge resulting from higher biomass concentration, and 3) the effluent can be particle free or partially disinfected[13]. A growing confidence in MBRs is demonstrated by the
exponential increasing cumulative installed MBR capacity. It is also expected that the MBR technology will continue to grow substantially over the next
1.2 Membrane fouling in wastewater treatment and reuse
Although membrane technology is considered as one of the most promising approaches for wastewater reuse, there is an inevitably critical issue with membrane technology, which is the membrane fouling arising from the specific interaction between membrane and foulants in the feed water. Fouling is the phenomenon resulting in loss of performance of a membrane due to the deposition of suspended or dissolved substances on the membrane surface or within its pores.[14]
1.2.1 Categories of membrane fouling
As a main issue in membrane application, membrane fouling is basically caused by the mechanism of deposition and accumulation of foulants, such as particles and organics, on the surface of a membrane or in the membrane pores.
Membrane fouling can be categorized into different types on the basis of foulant materials, which are
• Inorganic fouling caused by the deposition of hardness scale, minerals and/or colloidal materials on the membrane surface,
• Organic fouling resulting from the deposition or absorption of organic materials, for example NOM (natural organic matter) and EfOM (effluent organic matter), and
• Bio-‐fouling due to microbial attachment to the surface of membranes followed by their potential growth and multiplication in the presence of sufficient nutrients.[14, 15]
However, inorganic content is less important for low-‐pressure membranes as scaling is not expected since divalent ions (salts) pass the membranes
unimpededly[7]. From the perspective of reversibility, membrane fouling can be divided into two categories, including reversible fouling and irreversible fouling. Reversible fouling is caused by reversible/non-‐adhesive foulants adsorption, which can be removed by physical methods such as hydraulic cleaning
(backwashing, crossflushing). When the membrane fouling can only be removed by the utilization of chemical reagents, it is therefore defined as hydraulically irreversible fouling[16].
This undesirable phenomenon will negatively affect the performance of a membrane system in terms of flux decline with time and deteriorated permeate quality in many cases[5]. In order to maintain the performance and capacity of the membrane system, frequent physical/chemical cleaning and regular
replacement of membranes are required due to membrane fouling. This dramatically intensifies the maintenance and operating costs of membrane systems[17-‐20]. According to some publications, problems induced by fouling can increase the operational cost by up to 50% of the total cost[21]. Moreover, membrane fouling will augment the utilization of cleaning chemicals and consequentially induce the waste issue.
Therefore, fouling severely constrains wider application and the development of membrane technology for water treatment. Thus, scientists from throughout the world investigate this phenomenon of huge complexity and great challenge.
1.2.2 Dominant foulants and the identification
Tertiary treatment (low-‐pressure membrane filtration of secondary effluent) in CAS-‐MF/UF is usually expected to exhibit a better flux performance than the MBR process because suspended solids (insoluble solids) in secondary effluent (the feed for tertiary treatment) have already been clarified through the
secondary settling tank. One important indicator is mixed liquor suspended solids (MLSS) concentration, which is considered to impact directly on cake layer formation on the membrane surface. For secondary effluent in CAS, the MLSS concentration usually lies in the range of 20-‐30 mg/L, whereas typical MLSS concentrations in the MBR process are usually in the range of 10,000-‐15,000 mg/L. However, some researchers have found that CAS tertiary treatment does not necessarily show a better flux performance than MBR even though it has a significantly lower MLSS concentration than MBR. The rapid flux deterioration in CAS-‐MF/UF is ascribed to smaller-‐size particle concentrations, since a secondary effluent does not have any obvious advantage over the membrane feed in MBR in terms of smaller size particle concentrations[22]. As a matter of fact, both CAS-‐ MF/UF and MBR processes generally encounter similar dominant foulants.
Before continuing, several terminologies need to be briefly introduced, which are closely related to membrane fouling phenomenon.
• Effluent organic matter (EfOM), consists of refractory compounds, residual degradable substrate, intermediates, end products, complex organic compounds, and soluble microbial products (SMP)[23]. • Soluble microbial products (SMP) are currently defined as “the pool of
metabolism (usually with biomass growth) and biomass decay”. The organic compounds, which might be found in this pool, are humic and fulvic acids, polysaccharides, proteins, nucleic acids, organic acids, amino acids, antibiotics, steroids, extracellular enzymes, siderophores, structural components of cells and products of energy metabolism. Among those substances in SMP, proteins, polysaccharides and organic colloids are dominant. Nonetheless, the precise definition is still under debate[23, 24]. Based on the bacteria phase, they are categorized into two subgroups, including: 1) growth associated products, alternatively called utilization associated products (UAP), are directly produced from biomass growth and substrate metabolism, 2) non-‐growth associated products,
alternatively called biomass associated products (BAP), are defined as the products of cell lysis or biomass decay[25].
• Extracellular polymeric substances (EPS) occur as products of biological processes, participate in the formation of microbial aggregates and
consist of insoluble materials (sheaths, capsular polymers, condensed gel, loosely bound polymers, and attached organic material). However, SMP are also defined as soluble EPS. Thus, EPS are composed of proteins, carbohydrates, nucleic acids, lipids and humic substances, among which proteins and carbohydrate are indicated as the dominant components of EPS[26-‐29].
However, there is a controversial point of view regarding the relationship between EfOM and SMP according to different publications. For example, Jarusutthirak and Amy [25] take SMP as a significant component of EfOM
whereas Janga et al. [26] define SMP as the major source of EfOM. But most researchers consider SMP as a subset of EfOM. Some researchers found that SMP, which is also described as soluble EPS as mentioned above, is the majority of soluble organic matter in wastewater effluent. The characteristics of EfOM and/or SMP from different wastewater treatment plants vary due to different treatment processes and operational conditions[23].
Many researchers have indicated that the extracellular polymeric substances (EPS) are the most significant biological component accountable for membrane fouling, which are produced by microorganisms during metabolism and
autolysis[20]. Particularly, the carbohydrate fraction of SMP (also named soluble EPS or biomass supernatant) is frequently considered as the main factor
affecting MBR fouling[30]. Usually, it is believed that the higher the
concentration of SMP is, the faster membrane fouling develops[31]. Moreover, some researchers such as Yuan and Zedney [32] found that humic substances (the major component of NOM), despite of their small sizes, can cause significant flux decline in MF membranes. Those small substances can cause irreversible fouling though they may not be the major foulants in membranes for wastewater reclamations[32, 33].
Generally, investigations of membrane foulants are conducted with the considerations of size distribution, characterization and/or quantification of foulants[34]. As is mentioned above, EPS and/or SMP are the most significant biological components responsible for membrane fouling in wastewater treatment process. Either EPS or SMP is composed mainly of biopolymers
(molecular weight cut-‐off MWCO>10kDa) such as proteins and polysaccharides. Besides, humic substances (MWCO: 5~50kDa), which generally reflect smaller molecular weights, are also found to cause serious flux decline in low-‐pressure membranes.
Various techniques are applied to characterize or identify the fouling causing substances. Microscopy is a powerful technique to directly visualize the structural appearance of MF and UF membrane surfaces. Scanning electronic microscopy (SEM) and atomic force microscopy (AFM) have been applied for morphological analysis. For example, they are used to compare the surfaces of clean membranes and fouled membranes, or to determine the morphology of fouled membranes. However, those two methods cannot show the specific species of the foulants. An energy disperse spectrophotometer (EDS) can be utilized to determine inorganic foulants on the membrane surface[35]. High performance liquid chromatography-‐size exclusion chromatography (HPSEC) is used to detect the molecular weight distribution of foulants. Fourier transform infrared spectroscopy (FTIR) can be used to analyze the functional groups of organic compounds. Specific Ultraviolet absorbance (SUVA), the ratio of the UVA and DOC of a sample, represents an index of aromaticity of organic matter[36]. Fluorescence excitation-‐emission matrix (F-‐EEM) analysis can be employed to characterize NOM, as it is capable of capturing specific fluorescence features that correspond to humic and protein-‐like substances in a single matrix in terms of fluorescence intensities[37].
A particular powerful analytical method in this research is liquid
chromatography with online organic carbon detection (LC-‐OCD), which is with high sensitive online multi-‐detectors, which are a good choice for identifying the main organic foulants in wastewater treatment processes considering molecular size and aromatic characteristics simultaneously[38].
1.2.3 Factors affecting membrane fouling
Great efforts have been made to investigate factors that may affect membrane-‐ fouling formation. Although there is still a long way to reach a complete
understanding, a basic consensus on the factors affecting membrane fouling has been arrived at. Those factors can essentially divided into three groups,
including 1) membrane types and membrane configurations, 2) hydraulic conditions, and 3) characteristics of feed water[39, 40].
1.2.4 Measures to mitigate membrane fouling and restoration of membrane performance
Membrane fouling can never be completely eliminated. Hence, the realistic countermove to this problematic phenomenon is to develop some methods to mitigate this issue and reduce the impacts induced. The currently available strategies for membrane fouling control are 1) modify or pretreat the
membrane, 2) modify or pretreat the feed, and/or 3) adjustment of operating conditions[41].
1.3 Fouling analysis for low-‐pressure membranes
1.3.1 Fouling models
Generally, it is considered that there are four basic mechanistic models to describe fouling mechanisms, including those shown below.
• Cake layer filtration, mainly composed of bacterial cells and substances produced by bacteria such as extracellular polymeric substances (EPS), occurs when particles accumulate on the membrane surface in a
permeable cake-‐like layer of increasing depth which strengthens the resistance to flow.
• Intermediate blocking, based on the assumption that a portion of the particles seal up membrane pores whereas the remaining particles just accumulate on the top of previously deposited particles.
• Pore constriction (standard blocking), assuming that particles of smaller sizes (than the pore diameter) accumulate inside the membrane on the inner walls of the straight cylindrical pores. The deposition diminishes the pore size of the membrane. The pores are constricted and thus the permeability of the membrane is reduced.
• Complete pore blocking occurs when the pore entrances are sealed off by particles with larger sizes than the diameter of the pores. In this
situation, the flux is prevented by the protein aggregates depositing on the membrane surface and can only pass through unblocked area prevent the flux.
Each of these four models is usually utilized individually or in a certain combination to explain the experimental observation[42, 43]. Lee et al. [44]
observed that UF membranes are more likely to be fouled by cake/gel layer formation whereas MF membranes are prone to be fouled by pore blockage[44]. Mashall et al. [45] discovered that proteins could foul MF membranes both by deposition on the membrane surface and deposition inside the membrane pores.
Modeling flux decline during filtration enhances understanding of membrane fouling and may also yield predictive tools for successful scaling up or down of a filtration system[42]. However, scientists still have not successfully developed unified and well-‐constructed theories on membrane fouling because of the complexity of the biomass matrices with high heterogeneity and the involvement of microorganisms[46].
A variety of different functional forms have been published for those fouling models. Nevertheless, the underlying governing equations can be conveniently transformed into a common mathematical form[47]. The general form for fouling models is called Hermia’s model[48], which is established for four simplified modes of membrane fouling by a variety of water matrices. Complex
compositions are usually present in those water matrices. Hermia’s model is valid for unstirred, dead-‐ended filtration, and complete rejection of solute by membrane. The common form of Hermia’s model is shown as below.
In this equation, t [s, second] represents filtration time, while V [m3] denotes
accumulative permeate volume. k and n are two model variables. k is a fouling coefficient whose units depends on the value of n (e.g. s/m6 for n=0). The
d2t dV2 =k dt dV ⎛ ⎝⎜ ⎞⎠⎟ n (1.1)
variable n is dimensionless, whose value is related to the exact fouling mode occurring during filtration. When n=0, the fouling mechanism is considered as the cake filtration mode; n=1 for intermediate blockage; n=1.5 for pore
constriction (alternatively, standard blocking); and n=2 for complete pore blockage. t and V are obtained during the filtration under constant pressure. The schematic diagram for the four modes of Hermia’s model is presented in Figure I-‐3.[48, 49]
Figure I-‐3 Scheme of four fouling mechanisms
In order to simplify the calculations during analysis and reduce errors generated during sophisticated calculations, a linearized equation for each specific fouling model (Table I-‐2) has been deduced from the original Hermia’s model. (see Appendix 1)
The main advantage of linearizing the mathematical model is that it does not require complicated data processing. It merely involves straightforward linear least square fitting, making it possible to easily identify an individual fouling model by a corresponding correlation coefficient.
Table I-‐2 Summary of four fouling mechanisms based on Hermia's Model Mechanism model n for ! !! !!!= 𝑘 !" !" !
Simplified Equation Equations No.
Cake layer 0 𝑡 (𝑉 𝐴)= 𝐴!𝑘 ! 2 𝑉 𝐴 +𝐴𝐶! 1.1.a Intermediate blockage 1 𝑑𝑡 𝑑(𝑉 𝐴)= 𝐴𝑘!"𝑡+𝐶 1.1.b Standard blocking 1.5 𝑡 𝑉 𝐴 = − 𝐴𝑘! 𝐶! 𝑡− 𝐴𝐶! 𝐶! (𝐶! <0,𝐶! >0) 1.1.c Complete blocking 2 𝑑(𝑉 𝐴) 𝑑𝑡 = −𝑘!" 𝑉 𝐴−𝐶 1.1.d 1.3.2 Fouling index
It is usually assumed that the particulate fouling in low-‐pressure membranes (MF and UF) results from pore blocking and cake layer formation, whereas fouling in high-‐pressure membranes (RO and NF) is often considered to be caused by the cake filtration mechanism. Due to the consequences induced by fouling, it is necessary to develop some methods to predict and control fouling issues. A practical index of fouling potential will be quite helpful and beneficial, both at design stage and for monitoring during plant operation. [50]
Currently, the two most widely applied methods for fouling potential evaluation are silt density index (SDI) and modified fouling index (MFI), both of which are mainly for dispersed particulate matter caused fouling.
The SDI method is standardized by ASTM4189, in which a dead-‐end filtration (under 207 kPa) through a 47 mm diameter membrane with a pore size of 0.45 μm is conducted on the feed. The time interval ti required for a specific
filtration, another measurement of the time interval tf needed for an additional
permeate volume V is determined. The symbols ti, tf, and T are adopted in
ASTM4189[51]. The SDI value is hence calculated through:
The other method modified fouling index (MFI) is determined through the same set-‐up and procedure employed for SDI, except the permeate volume is recorded for every defined interval (e.g., 30 seconds) over a certain period (e.g., 30
minutes) of filtration. During this test, a t/V versus V graph is plotted. (see equation 1.3.) The MFI is solely based on the cake filtration mechanism. Therefore, the curve obtained in the graph should theoretically be a complete linear line, whose slope represents the MFI value. In practice, however, the t/V-‐V curve is usually not linear. Thus, it is clear that in cases of a non-‐linear t/V-‐V curve, the obtained MFI only represents part of the information included in the resultant data[5, 50, 51].
Despite that those two parameters are standardized and widely adopted in engineering practice, they are considered to be unsatisfactory indicators that often fail to reflect the real fouling strength of the feed water[5].
SDIT =100 1
(
−ti tf)
T (1.2) t V = ηRm ΔPA+ ηI 2ΔPA2 MFI V = ηRm ΔPA+MFI⋅V (1.3) η− fluid viscosity (N⋅s/m2 ); Rm− membrane resistance (1/m);ΔP− applied transmembrane pressure (bar);
I − index for the propensity of particles in water to form a layer with hydraulic resistance (1/m2).
1.4 Sludge water
There is much debate on a clear experimental definition of SMP due to the complexity and variability of the matrices in different circumstances. Besides, the concepts of SMP and EPS have some overlaps. A common term shared by EPS and SMP is that they are microbially produced organic materials containing
electrons and carbon but not active cells. However, up to now, two distinct
“schools of thought” have focused separately on the two products, treating them as different entities. Some researchers solely concentrate on EPS and active biomass, but not take SMP in their consideration. While some others just include SMP and active biomass in their analysis other than EPS. The possible
inappropriate point of ignoring either EPS or SMP is that it will result in some inaccurate or even wrong conclusions such as overestimations of cellular growth rates.[27]
Therefore, the current confusion on both EPS and SMP makes it significative to develop a more comprehensive way to describe and to characterize the
properties of membrane feed in wastewater treatment processes. The concept that will be introduced here is sludge water.
1.4.1 Definition of sludge water
Sludge water is the water matrix (supernatant) obtained from WWTP activated sludge. The ideal sludge water should be free of suspended/insoluble solids. But soluble substances including biopolymers, humic substances and some other soluble materials should be still wholly kept in the matrix.
This concept allows one to avoid the debate on the definitions of EPS and SMP. Sludge water actually contains all substances , which might be included in the definitions of EPS and SMP. Therefore, sludge water not only conceptually covers EfOM, EPS and SMP, but also is easier to obtain.
1.4.2 Separation methods
In laboratories, the sludge water can be obtained through the following procedures.
1) Centrifugation at a certain acceleration for a certain period, or just gravitational settling for a certain period,
2) Collection of the supernatant,
3) Filtration through a proper MF for removal of visible particles from the supernatant.
1.4.3 Characterization
In this research, several techniques are adopted for characterization of sludge water, including chemical oxygen demand (COD) analysis (HACH DRB200 reactor and HACH DR2800 spectrophotometer), total organic carbon (TOC) analysis (Shimadzu TOC-‐V CPH, and ASI-‐V)), fluorescence excitation-‐emission matrix analysis (F-‐EEM) (FluoroMax-‐4 Spectrofluorometer, HORIBA scientific), and liquid chromatography with online organic carbon detection (LC-‐OCD) (Model 8, DOC-‐LABOR DR. HUBER).
COD analysis can only give an approximate value of the concentration of organic compounds in the sludge water; the TOC measurement is more accurate. F-‐EEM can show more detailed information on the substances in the sample. Different peaks indicate corresponding substances, such as biopolymers with large
molecular weight (MW), humic substances with smaller MW. LC-‐OCD is the most accurate approach and can provide the most details of the sample. It can be used to detect the concentrations of different substances within one single matrix.
1.4.4 Additional work needing to be done
There are many publications on fouling behaviors of EPS, SMP and EfOM in wastewater reclamation processes. However, as a newly proposed concept, sludge water needs to be investigated more on how its characteristics and properties determine or influence the membrane fouling phenomenon during wastewater treatment. More investigations need to be carried out for the possibility of the existence of the underlying relationships between the sludge water characteristics and the fouling potential/flux decline rate.
1.5 Structure of this thesis
Chapter I. Introduction: This chapter is a combination of introduction and
literature review. A basic explanation of the necessity of wastewater reclamation is given at the very beginning of this chapter followed by an introduction to membrane technology for wastewater recycling. Some fundamental concepts of membranes, such as categories, advantages and disadvantages, are briefly discussed. The main issue regarding membrane technology, membrane fouling,
is focused on in this chapter. The definitions of membrane fouling, impacts of fouling, fouling causing substances, identifications of main foulants, approaches to eliminate fouling, theories on fouling mechanisms and mathematical models of fouling are included. After the topic on membrane fouling, the point of sludge water is expanded, in which the definition of sludge water, sludge water
separation methods, characterization of sludge water and future work on sludge water are articulated.
Chapter II. Methodology: This chapter is focused on the experimental set-‐up, instruments, and procedures.
Chapter III. Separation Methods of Sludge Water: The methods and procedures for the separation of sludge water from activated sludge are presented in this chapter. There are mainly three approaches, which are gravitational
sedimentation, centrifugation and membrane filtration. An investigation of the optimal centrifugal force is carried out as well as the proper membrane pore size. The aim of this chapter is to construct a standard procedure of sludge water separation.
Chapter IV. Characterization of Sludge Water: COD analysis, TOC analysis, F-‐EEM test, and LC-‐OCD are utilized in this chapter for the characterization of sludge water sample obtained.
Chapter V. Fouling Potential of Sludge Water: The filtration experiments of sludge water with different membranes are conducted under a correspondingly
proper pressure. Through the comparison and analysis of the performances and characteristics of the membrane filtrations, two promising membranes are selected for further investigation of sludge water fouling potential.
Chapter VI. Conclusions and Recommendations: As a conclusion, basic concepts on sludge water, separation procedure of sludge water, characterization of sludge water, and fouling potential of sludge water are concluded in this chapter. Additionally, some suggestions for future study on sludge water and its fouling potential are proposed.
II.
Methodology
2.1 Separation of sludge water
Centrifugation followed by filtration was intensively investigated to separate sludge water with gravitational settling followed by filtration as a control. A wide range of centrifugal forces, varying settling times and different filters were explored. Detailed information is available in the corresponding chapter (Chapter III).
BD 60ml syringes (Luer-‐LokTM Tip, REF309653) were used to obtain
supernatants from sludge samples and pre-‐filter the supernatants with Whatman 1.2 μm glass-‐fiber syringe filters and/or Millipore 0.45 μm PVDF syringe filters, depending on different batches. Before use, the syringe with filters attached is rinsed with 100 ml Milli-‐Q water to eliminate the residue inside the syringe and of the filter membrane.
A centrifuge (Legend XT manufactured by Thermo Scientific) was employed in this research. Disposable centrifuge tubes (Sterile, Polypropylene, 50ml) from FisherBand were used.
As for the storage of samples, 24 ml glass vials were widely used in this research, for not only sample storage but also TOC tests. These vials were rinsed in
hydrogen chloride acid (HCl) solution with pH of 2 for at least 5 hours (to kill all microorganisms and detach stains) before being rinsed with Milli-‐Q water for 2 hours. Thereafter, the vials were heated in an oven with a temperature of 550°C
for 2 hours (mainly to combust organic carbon and dewater the vials). Only after aforementioned procedure, could the vials be used for sampling and storage.
2.2 Analytical measurements
As is mentioned previously in Chapter I, several analytical methods were applied for characterization, including chemical oxygen demand (COD), total organic carbon (TOC), fluorescence excitation-‐emission matrix (F-‐EEM), and liquid chromatography with online organic carbon detection (LC-‐OCD).
2.2.1 Chemical oxygen demand (COD)
The chemical oxygen demand test is usually used to indirectly measure the amount of organic carbon in water. It is expressed in milligrams per litter (mg/L) indicating the mass of oxygen consumed per liter of solution. In this research, a HACH DRB200 Reactor and HACH DR2800 Spectrophotometer were employed for COD analysis. The HACH TNT vials with samples added were heated at 150 ° C for 120 minutes by the reactor. These vials were cooled down to room
temperature before measure them with the spectrophotometer.
2.2.2 Total organic carbon (TOC)
Total organic carbon is a highly sensitive, non-‐specific measurement of all
organic compounds existing in a water sample. In this research, SHIMADZU Total Organic Carbon Analyzer (TOC-‐V CPN, ASI-‐V) was employed.
![Table
I-‐1
Membrane
classification
[8]](https://thumb-us.123doks.com/thumbv2/123dok_us/11016306.2988957/15.892.154.790.911.1154/table-i-membrane-classification.webp)


![Figure
II-‐1
Scheme
of
LC-‐OCD
Model
8
[53]](https://thumb-us.123doks.com/thumbv2/123dok_us/11016306.2988957/39.892.173.752.116.471/figure-ii-scheme-lc-ocd-model.webp)
![Figure
II-‐2
An
example
of
LC-‐OCD
result
[55]](https://thumb-us.123doks.com/thumbv2/123dok_us/11016306.2988957/40.892.258.686.149.498/figure-ii-example-lc-ocd-result.webp)