Journal website: http://epaa.asu.edu/ojs/ Manuscript received: 15/7/2016
Facebook: /EPAAA Revisions received: 17/3/2017
Twitter: @epaa_aape Accepted: 14/4/2017
Restructuring and Resisting Education
Reforms in Chicago’s Public Schools
education policy analysis
archives
A peer-reviewed, independent, open access, multilingual journal
Arizona State University Volume 25 Number 56 June 5, 2017 ISSN 1068-2341
Segregation and Inequality in Chicago Public Schools,
Transformed and Intensified under Corporate Education
Reform
Pavlyn Jankov
&
Carol Caref
Chicago Teachers Union
United States
Citation: Jankov, P., & Caref, C. (2017). Segregation and inequality in Chicago Public Schools, transformed and intensified under corporate education reform. Education Policy Analysis Archives,
25(56). http://dx.doi.org/10.14507/epaa.25.2631 This article is part of EPAA/AAPE’s Special
Issue on Restructuring and Resisting Education Reforms in Chicago’s Public Schools, guest edited by Dr. Federico Waitoller and Rhoda R. Gutierrez.
Abstract: During the period of 1981 to 2015, the total population of Black students in CPS plummeted from close to 240,000, 60% of all CPS students, to 156,000 or 39% of CPS. This paper documents how despite their decreasing numbers and percentage in the system, the vast majority of Black students remained isolated in predominantly low-income Black schools that also became the target of destabilizing corporate reforms and experimentation. This study examines the historic and contemporary dual segregation of Black teachers and Black students in Chicago Public Schools, and
how mass school closures, privatization, and corporate school reform have both transformed and deepened segregation and resource-inequity across Chicago's schools.
Keywords: segregation; school closings; corporate reform; Chicago Public Schools; school choice, charter schools; teacher segregation
Segregación y desigualdad en las Escuelas Públicas de Chicago, transformadas e intensificadas bajo la reforma de la educación corporativa
Resumen: Durante el período de 1981 a 2015, la población total de estudiantes negros en CPS se desplomó de cerca de 240,000, 60% de todos los estudiantes de CPS, a 156,000 o 39% de CPS. Este documento documenta cómo, a pesar de su número y porcentaje decrecientes en el sistema, la gran mayoría de los estudiantes negros permanecieron aislados en las escuelas predominantemente de bajos ingresos de los negros que también se convirtieron en el objetivo de desestabilizar las reformas corporativas y la experimentación. Este estudio examina la segregación histórica y contemporánea de profesores negros y estudiantes negros en las Escuelas Públicas de Chicago y cómo los cierres masivos de escuelas, la privatización y la reforma de las escuelas corporativas han transformado y profundizado la segregación y la desigualdad de recursos en las escuelas de Chicago.
Palabras-clave: segregación; cierre de escuelas; reforma corporativa; Escuelas Públicas de Chicago; opción escolar, escuelas charter; segregación de maestros
Segregação e desigualdad nas Escuelas Públicas de Chicago, transformadas e intensificadas sob a reforma da educação corporativa
Resumo: Durante o período de 1981 a 2015, a população total de estudantes negros em CPS despencou de cerca de 240.000, 60% de todos os alunos da CPS, para 156.000 ou 39% da CPS. Este documento documenta como, apesar de seus números decrescentes e porcentagem no sistema, a grande maioria dos estudantes negros permaneceu isolada em escolas pretas predominantemente de baixa renda que também se tornaram o alvo de desestabilizar reformas corporativas e
experimentação. Este estudo examina a segregação dual histórica e contemporânea de professores negros e estudantes negros nas Escolas Públicas de Chicago, e como o fechamento das escolas em massa, a privatização e a reforma escolar corporativa transformaram e agravaram a segregação e a desigualdade de recursos nas escolas de Chicago.
Palavras-chave: segregação; fechamento de escola; reforma corporativa; escolas públicas de Chicago; opção de escola, escolas charter; segregação dos profesores
Introduction
This paper articulates the role segregation plays in the context of the corporate education reforms carried out across Chicago Public Schools (CPS) over the last decade. The paper does this chiefly through examining segregated, predominantly Black1 schools, and drawing special attention
to the relationship of school closures, expansion of charter schools2, and segregation. It explores the
1 To be consistent with descriptors in historical CPS data and also to be inclusive of non-American
immigrants with African heritage, this paper uses the term Black rather than African American throughout.
2 Charter schools are managed by entities other than local school districts but funded through public funds.
Charters are subject to fewer regulations than traditional public schools, operate under terms set by contracts with local school districts, and are free to set their own educational program. In Chicago, charter schools are required to be non-profit, cannot charge tuition, and are free from a number of state laws governing public school districts, such as regulations relating to school discipline policies; the hiring, firing and evaluation of
synchrony and interdependence that exists between inequality, segregation, and public education in Chicago. It argues that far more than just an enduring holdover from the era of overtly racist public educational policies, school segregation in Chicago today plays a fundamental and active role in the ways that educational opportunity is restructured under neoliberalism. During the period of 1981 to 2015, the total population of Black students in CPS plummeted from close to 240,000, 60% of all CPS students, to 156,000 or 39% of CPS. This paper documents that despite their decreasing numbers and percentage in the system, the vast majority of Black students remained isolated in predominantly low-income Black schools that also were the target of destabilizing corporate reforms and experimentation.
The paper begins with a brief overview of the ways neoliberalism has restructured public schools and educational opportunity. The history of segregation in CPS and the deep conflicts over desegregation are then explored to give context to current inequities. This history is crucial for establishing the concurrence between the policies of today and those at the height of segregated schooling. The paper then lays out the basic contours of how corporate reforms have transformed CPS and impacted segregated Black schools. While other studies of segregation sometimes look at all non-White students collectively, this paper specifically looks at segregation of Black students. The paper focuses on Black segregation specifically because this is where the most dramatic harms of segregation appear. For example, of the 50 schools CPS closed in 2013, 42 had student populations that were greater than 75% Black.
Unless otherwise noted, all analyses of demographic data on CPS schools, teachers and students cited in this report are authors’ calculations from public datasets, both online and printed, produced by CPS or the Illinois State Board of Education (ISBE). Datasets used include CPS time series reports on student racial and ethnic data (Chicago Public Schools, 1971, 1981, 1989, 2001, 2012a, 2015a), CPS time series reports on free or reduced lunch (FRL) eligibility (Chicago Public Schools, 2012b, 2015b), CPS time series reports on racial/ethnic surveys of staff (Chicago Public Schools, 2001b), and ISBE time series reports on teacher demographics (Illinois State Board of Education, 2001, 2012).
Several limitations of the data available for charter schools in CPS posed complications for analyzing and presenting charter data alongside district data for each type of analysis. Data on charter school teachers were available for certified teachers only, (charter schools in Illinois are allowed to hire uncertified teachers for up to 25% of their teaching staff), and were aggregated by the charter school network, rather than by individual school site (some charter schools in Illinois are licensed to operate multiple campus locations). The inclusion or exclusion of charter schools is noted for each analysis presented.
The analysis of data presented are primarily descriptive in character, such as the percentage of Black students and Black teachers in segregated Black schools over time, and the percentage of schools with low or high percentages of Black students over time. Data analysis is also presented visually, by use of scatterplots to depict the dual segregation of Black teachers and Black students over time, and the impact of school closings on segregated Black schools. These visual depictions are supplemented with analyses of descriptive statistics. Although many systemic educational changes are ascribed to corporate reforms, the chief ones analyzed in this paper are the racial and economic composition of schools and teacher demographics. The paper examines the closing of neighborhood schools and the expansion of charter schools through demographic data, to show the persistence of Black student segregation. The impact of the school closings and expansion of charters on the dual segregation of Black teachers and Black students, and the teachers that Black
employees; the length of school year and school day; and employment of non-licensed teachers. Charters did not exist in CPS until 1997.
students have access to, is then analyzed. The paper concludes by examining the false promises of school choice and its relationship to deepening segregation.
Corporate Reform
Neoliberalism, a collection of policies, projects, and ideas that are brought to bear on governance and societies, has transformed the role of government in providing public services. The goal of neoliberalism is to open up new opportunities for capital accumulation, further entrench market logics in our social relationships, and ensure governments operate actively to enhance these logics rather than obstruct them. The ideology that rational self-interest, competition, and profit-seeking will make state and society more efficient and beneficial for everyone is central to legitimizing the neoliberal project. Neoliberalism portends to promote notions of equality and opportunity, within the parameters of its ideological frame. (Au, 2015; Harvey, 2007; Lipman, 2011a, Lubienski, 2006)
Corporate education reform refers to the set of education policies that directly or indirectly work to further the commodification of public education. In one sense, the course of public education in Chicago has always been controlled by corporate need. As Shipps (2006) wrote, speaking of school leaders in the 1900s, “They were successful in modeling the structure of the school system on the industrial corporation” (p. 47).
Policies common in the 21st century, such as the expansion of charter schools, voucher programs, and privatization of services, can directly increase corporate profits. Other policies serve corporate needs indirectly: the standardization and measurement of outcomes, fast-tracking teachers with little training into the classroom, rating teachers and schools by narrow test-based metrics, reducing job protections and teacher autonomy, expanding testing, promoting opportunities for academic tracking and segregation of students, and pushing the idea that schools can do more with less. These reforms echo measures used to speed up assembly lines and produce standardized products. Corporate reforms have gained widespread traction over the last decades under the neoliberal project (Saltman, 2012).
At the national level, these reforms were greatly accelerated through the 2001 No Child Left Behind (NCLB) legislation, which received bipartisan support for its program of expanding
standardized testing, increasing the number of charter schools, and creating a hierarchy of top-down accountability based on standardized test scores (Weiner, 2005). These policies were ramped up further when in 2009, the Obama administration created the Race to the Top program. This federal competitive spending initiative awarded additional funding to school districts and states based on legislative support for policies to expand charters, shut down and re-start low-performing schools, implement common standards, expand charters, and implement test-based evaluation of teachers and schools. The passage of Every Student Succeeds Act (ESSA) in 2015 continues this framework of test-based accountability, although it assigns more control over standards and enforcement to the states.
Standardized testing has served as a linchpin of corporate reform, both providing the material basis to make high-stakes decisions on seemingly universal metrics, and serving as the common ideological justification for discriminatory policies. Standardized testing fosters both segregation and racism, while offering language wherein parents and the broader public can speak about test scores instead of race (Knoester & Au, 2015). In Chicago, high-stakes testing, top-down accountability, the aggressive expansion of charter schools, the use of test scores to label and brand “failing” schools, mass closures and consolidations of neighborhood schools concentrated on the
predominately Black South and West sides of the city, investment and growth of selective enrollment schools, have all significantly remade public schools.
These reforms were mapped onto a deeply segregated and unequal school system. In many ways, the reforms are a continuation of the segregated and tiered schooling that have characterized Chicago Public Schools for over a century. However, corporate education reforms have also transformed the manner by which segregation shapes the opportunity structure in Chicago.
The Historical Context of Segregation in Chicago Public Schools
Throughout the 20th century, segregation became institutionalized in Chicago.
Discriminatory housing laws, restrictive covenants, real estate red-lining, discriminatory federal and private lending programs, market forces, social behaviors by the White majority, state-sanctioned violence and private violence, all served to create and maintain segregation in housing and schools. Segregation reproduced class and racial inequalities, both in terms of economic opportunity and through the wide disparities in public resources available for education (Rury, 1999).
Segregation in schools followed residential segregation patterns, but it also worked the other way around. This was especially clear in the South Side Black Belt, a narrow area on the South Side of Chicago where, due to the collusion of real estate interests, White neighborhoods, and
government officials, Black Chicagoans and Black migrants to Chicago were confined to segregated areas. The influx of Black migrants led to continual over-crowding, and expansion of the Black Belt boundaries. In the first decades of the 20th century, property and business owners in Hyde Park, a
neighborhood to the south of the then recognized boundaries of the Black Belt, worked together to maintain segregation and keep Black residents out of the area and, especially, Black students out of the neighborhood Hyde Park High School. The intense concentration of Black Chicagoans in the Black Belt was in part due to the coordinated efforts of the White business and property class to maintain segregated schools (Daniel, 1980).
The state, however, has played the fundamental role in entrenching segregation. CPS supported school segregation by drawing school attendance lines to match residential segregation patterns and giving transfers to White students residing near Black schools to attend White schools (Coons, 1962). Segregation was entrenched further by CPS management of the overcrowded conditions in Black schools. Double-shifts, where students were staggered in two half-day shifts throughout the day, was common practice in overcrowded Black schools from at least the World War II era up through the superintendence of Benjamin Willis (Grossman, 1978). Rather than assign Black students to underutilized White schools, the district, when they did build new schools to serve Black students, concentrated those schools in the middle of segregated Black neighborhoods.
All these practices continued well after the passage of the 1954 Supreme Court Ruling (in
Brown vs. Board of Education) that decreed separate could not be equal, and the Civil Rights Act of
1964 that gave the federal government power to enforce the ruling. Long after districts throughout the South had started court-ordered desegregation programs, discriminatory and segregating policies remained in Chicago and other districts in the North (Orfield & Eaton, 1996).
The resistance of CPS to changing their explicitly segregationist practices led civil rights organizations to lead anti-segregation actions, culminating in the October 22, 1963, student boycott which saw virtually all Black and some White students, 224,000 in all, march, rally, and stay away from school. Superintendent Benjamin Willis insisted on a policy of neighborhood schools, which, in segregated Chicago, meant overcrowded, substandard, segregated schools for Black students while many White schools had empty classrooms (Rury, 1999). The specter of White flight was used to defend these segregationist tactics and to resist even modest incremental steps towards
integration (Steffes, 2016). White flight refers to the mass migration of white residents to suburbs or more solidly White city neighborhoods, often fueled by realtors’ scare tactics and racist propaganda. Realtors turned a profit when they resold the homes purchased for cheap from departing White families to Black and minority buyers at high prices. School segregation as policy led to striking disparities, such as the aluminum mobile classrooms (called Willis Wagons) lining the yards of over-crowded and under-funded schools in Black communities on the borders of White ones. Ultimately, White flight occurred throughout Chicago despite the district’s refusal to take real steps towards integration.
It may seem possible to contrast CPS today to the extreme disparities of the 1960s, and decide that the magnitude of racism in public policy has disappeared with the wagons and the White-flight, and that the city is now simply handling as best it can a historical problem. However, the contrast between then and now fades on closer inspection. Their concurrence became most apparent in 2013, when the district closed 50 schools, mostly schools serving Black students in Black neighborhoods. The district claimed that low-enrollment trends over the last decades forced them to deal with a problem that should have been addressed a long-time ago. Yet, over the same period of time, schools had been grappling with a growing overcrowding problem, and the district never seriously considered changing school boundaries to relieve the overcrowding and foster integration. Instead, the district spent hundreds of millions of dollars building annexes and schools in
overcrowded neighborhoods, invested in selective enrollment schools, which accept students through competitive entry, and allowed those selective schools to become less diverse. They promoted new charter schools that were often segregated and concentrated in areas near schools later deemed underutilized, and failed to provide commensurate and ample resources to socio-economically and racially segregated schools. These policies continue to this day.
While on the surface, the school district now appears to be reckoning with the effects of long-standing and seemingly immovable residential segregation, CPS has also actively deepened existing segregation, and created the conditions for its persistence and renewal. When confronted with the bare, racially-charged nature of their policy decisions, CPS leadership claims the inequities and actions are inescapable results of Chicago’s demographics. Their fraudulent attempts to absolve the district of culpability in Chicago’s separate and unequal school system are typical of the
resistance that desegregation enforcement faced in the decades after Brown v. Board, the Supreme Court decision that deemed separate schools inherently unequal. The reasoning of the 1954 Supreme Court decision was largely focused on de jure segregation, segregation that was explicitly approved and upheld by law (Orfield & Eaton, 1996). The argument made by recalcitrant school districts, suburbs, and municipalities in the North was that existing segregation was de facto, created by socioeconomic circumstances, and the choices and habits of society apart from public policies and law.
This is a falsehood then and now: states and localities everywhere have pursued racially-based policies that created the residential and school segregation seen today (Rothstein, 2015). In Chicago, after a century of segregating practices and decades of political resistance against activists and federal officials, CPS finally signed a consent decree with the federal government in 1980, in which they agreed to a plan involving magnet schools with racially balanced enrollments,
compensatory funding for segregated schools, and monitoring over the segregation of minority teachers. Although CPS defiance continued even under the decree (which itself was far from what was achievable) the decree meant that a level of federal court oversight over CPS initiatives and policies, with an eye towards mitigating segregating practices, was in place. Still, despite evidence that compensatory funding had continuously fallen short, and desegregation goals had not been met, the consent decree was lifted by a federal judge in 2009. By that time, the numbers of students of color
were already in decline at the city’s magnet schools and Black teachers were both heavily segregated across schools and rapidly decreasing in number (Karp, 2009).
In a society where social and economic disadvantages are widespread and increasing, the opportunity and social mobility supposedly provided by access to public education are
fundamentally constrained. Segregation magnifies the harms associated with these disadvantages, while also entrenching these disadvantages even further. The concentration of poverty, through both residential and school segregation, limits social mobility and pushes people of color further down the economic ladder (Sharkey, 2013). School desegregation programs have been shown to significantly improve educational outcomes for both students of color and White students, and have also been shown to improve post-secondary outcomes, as well as longer-term occupational, health, and earnings outcomes for Black adults that experienced school desegregation (Mickelson, 2003; Johnson, 2011; Wells, 2000). The experience of school desegregation also impacts personal beliefs, decreasing racial prejudice, and instilling commitment to integration, often long after the programs formally end (Wells, Holme, Revilla, & Atanda, 2005).
Instead of a focus on integration, CPS currently promotes segregated charter schools and continues to destabilize Black neighborhoods through school closings and other school actions.3
The various CPS superintendents carrying out these policies have continued to echo the line that the district is not to blame for segregation. Barbara Byrd-Bennet, the Chief Executive Officer (CEO) of CPS during the 2013 school closings took it as an affront that the closure of 50 predominantly Black schools was called racist; and more recently Janice Jackson, Chief Education Officer, has explicitly stated about segregation: “That’s part of the history of Chicago. I don’t think that’s a CPS issue.” (Karp & Vevea, 2016). Desegregation as a guidance towards school policy has been abandoned completely, and de facto segregation and all its accompanying injustices have become accepted as the norm, rather than recognized as the deliberate constructions that they are.
The (Re)Development of Corporate Reform in Chicago
In 1988, community groups representing CPS parents and students, lobbied successfully for the Chicago School Reform Act which provided a small modicum of parental and community control in each school, through local school councils (LSCs) (Moore, 2002). Seven years later, the Illinois legislature passed the Chicago School Reform Amendatory Act. This Act replaced the role of schools’ superintendent with that of Chief Executive Officer (CEO), and gave the mayor full control over CPS school board appointments and the power to place schools on probation using an
accountability framework designed by the district. Probation meant more CPS control over
academic programming in schools, and also over their governance. The district retained the right to replace principals and even to reconstitute or turnaround the entire school by firing and replacing all the staff in the building. Previously under the 1988 reform law, sub-district councils, composed of a representative from each LSC in a region, had the power to choose their sub-district superintendent, with whom they would work to identify and improve struggling schools (Myers, 2007). Under the 1995 Amendatory Act governance structure, the CEO of the district chose regional officers, and the sub-district councils were dissolved (Haynes, 1995).
One year later, the Illinois legislature’s decision to allow charter schools also meant that the accountability mechanisms in place for schools in Chicago could lead to their closure and restart as a privatized entity operating without accountability to the community (charter schools have no local school councils). Under the district’s accountability framework, standardized tests have played the
central role in determining the fate of schools. Even when under-enrollment or building conditions were used as the initial parameters for school closure, the accountability framework has served as the point of reference for why a particular school should be shuttered.
These significant changes to school governance policies were not enough for the
Commercial Club of Chicago, an organization that represents and furthers the interests of Chicago’s corporate elite. In 2003, they released a report on the state of public schools in Chicago which blamed stagnant test scores on the lack of competition in public education, ineffective LSC’s, and the bargaining agreements with the teachers’ union, stating that teachers were “essentially
unmanaged” (Commercial Club of Chicago, 2003). The report made no mention of segregation at all, and only mentioned poverty to say that poverty is not an “educational straitjacket”. The essential recommendations were to increase competition through expansion of charters, shut down
underperforming schools, adopt a teacher evaluation system to find more teachers ‘unsatisfactory’, and adopt a merit-pay system for teacher compensation.
The Commercial Club of Chicago has a long history of involvement in Chicago Public Schools. In 1898, they issued the Harper report, promoting the reorganization of public schooling using business principles. In 1915, the Club’s Education Committee chair confirmed that, “there has been no activity with which this Club has concerned itself in some phase or other for so long a time and in so expensive a manner as the subject of education” (Shipps, 2006, p. 20). In the 1960s, the Commercial Club supported Benjamin Willis, the school superintendent known for blocking
integration, until they realized that being on the wrong side of this issue hurt their businesses. Major Chicago corporations and banks had been targeted by Chicago’s civil rights movement (Shipps, 2006).
The Commercial Club’s 2003 proposal heralded the reinvigorated focus of the corporate class on public education. Not only would they play a direct role in setting and guiding policy, through their access to the mayor and the role of business leaders on the appointed Chicago school board, but they would also work to shift the discourse on education, by funding and supporting various organizations that influenced public opinion (Lipman & Hursh, 2007). The discourse of corporate school reform was about providing choice over a variety of competing educational options, and to emphasize teaching quality – while neglecting segregation, institutional racism, resource inequity, and structural poverty.
The Commercial Club’s prescriptions were quickly adopted as goals in a comprehensive school reform plan titled Renaissance 2010 by CPS CEO Arne Duncan, and approved by the school board appointed by Chicago’s Mayor Daley. To remake access to schools and foster competition, the Renaissance 2010 plan called for the closure of 70 schools and creation of 100 new schools, predominantly charters, by 2010 (Lipman, 2009). Charter schools were rapidly expanded, growing from 14 in 2003 and enrolling 3% of CPS students, to 82 in 2010 and enrolling 10% of CPS
students. They have continued to grow, and in 2016, there were over 111 charter campuses enrolling 14% of CPS students. Other schools have been subject to turnaround, a process wherein virtually all staff members—principal, teachers, paraprofessionals, janitors, and lunchroom workers—are fired, and must reapply for their jobs. Typically, fewer than 5% of staff members are rehired through the turnaround process.
Since the plan, the district has also dedicated hundreds of millions of dollars in new school construction, a large percentage going to selective enrollment schools and to alleviate overcrowding. Charter school networks also expanded and built new schools, funding their buildings with the proceeds received for school enrollment. At the same time, resource disparities have proliferated; certain schools received state of the art facilities, equipment and supplies, but neighborhood schools serving low-income students of color have become increasingly segregated and under-resourced.
Segregation of Black Students in Chicago Public Schools
CPS schools in the decades following the Brown v. Board of Education decision have remained greatly segregated. In 1971, 85% of all Black students in CPS were in intensely segregated schools, schools where at least 90% of the students were Black. A decade later, in the year the consent decree was signed, the picture was hardly different with 82% of Black students in such schools. In 1989, a decade after the school district started desegregation programs, three-fourths of all Black students were in intensely segregated schools. But since then, there has been little movement. By 2012, 70% of Black students attended intensely segregated schools, down by just 4% from over two decades earlier. While this metric shows how persistent the segregation of Black students has been, other metrics point to how it has worsened during the last two decades.
The consent decree addressed some of the most extreme segregation, but was woefully inadequate in addressing the breadth of desegregation necessary. In negotiations leading up to the 1980 consent decree, the federal government had developed a far more expansive alternative for the district to consider, involving mandatory busing of up to 114,000 students and linking elementary feeder schools to high schools to foster high school desegregation (Banas, 1979). However, the superintendent and Board of Education remained adamantly opposed to any policy that mandated paths to desegregation.
The desegregation plan that arose out of the 1980 consent decree, finally approved in 1983, did not have mandatory busing. It relied primarily on voluntary approaches: integrated magnet schools were established, magnet programming at segregated schools was expanded to foster racial balance, voluntary transfers at segregated schools were encouraged, and voluntary transfers at integrated schools were limited.
The approach of relying on voluntary programs also fostered new injustices. The newly created magnet schools received twice the funding of segregated neighborhood schools with no special programmatic investments (Fithawee, 2016). The magnet elementary schools boasted higher achievement, and attracted competition for limited slots, placing them on top of the new “education caste system” (Banas, 1985). In the immediate aftermath of the consent decree, the compensatory funding for the most segregated schools in CPS remained well short of the stated goals. In the years prior to the ending of the consent decree, CPS was sued by the U.S. Justice Department for failing to provide enough compensatory funding for students still in segregated schools and for engaging in deceptive but long-standing practices such as counting spending on ordinary district-wide programs or other federal requirements, such as pre-kindergarten or bilingual education, towards
compensatory desegregation funds (Olszewski, 2005).
With the official end of the consent decree in 2009, the racially-based targets at selective enrollment and magnet schools have been replaced by enrollment guidelines based on socio-economic status, and the few marginal programs intended to improve integration have ended. But even prior to the end of the decree, CPS had been focused more on boosting White enrollment by opening well-resourced selective-enrollment schools, rather than integrating existing schools. When it opened in 1999, Northside College Prep was the first high school built by CPS since 1980. The selective enrollment school was located in the predominately White Northwest side of the city, and initially only drew students from the North and Northwest sides of the city, leading to a student enrollment that was 49% White, and just 5.5% Black in its first year (Martinez, 1999). Instead of an anti-segregation solution, selective enrollment schools have become a bastion of privilege for many White students. Although they were 9% of all CPS high-school students in 2016, they were 25% of students attending selective enrollment schools. On the other hand, school closures and charter
school expansion have become standard in the predominately Black South and West sides of Chicago.
As Black students have remained concentrated in nearly all-Black schools there has also been a resurgence in the number of schools with very low Black student enrollment. The bar chart in Figure 1 below depicts the percentage of CPS students going to schools with low Black enrollment for select years from1971 to 2015. Data were collected and analyzed for intervals of roughly a decade, except for data points for the 2012 and 2015 years, given in order to capture the years before and after the 2013 closure of 50 elementary schools. In 1971, there were over 200 schools where Black students made up less than one in 10 students. Students across those schools
represented 35% of CPS. Many of these were essentially all White schools where there were virtually no Black students. In 1971, nearly one in five students in CPS went to schools with Black student populations less than 1%.
Such schools at the extremes of racial distribution were monitored under the 1981 consent decree, and voluntary transfer programs were implemented to encourage racial balance. By 1989, the number of schools with less than 10% Black students were reduced to fewer than a 100, and the percentage of CPS students in such schools fell from 35% to 17%.
Figure 1. Percentage of CPS students enrolled in schools with low Black populations over time This trend reverses after 1989. By 2015, the percentage of CPS students in schools with virtually no Black students had climbed to 9%. The percentage of CPS students attending schools with less than 10% Black students is even higher in 2015 than in 1971, going from 35% to 42%.
This resurgence has both similarities and differences with the past. The district was one-third White in 1970, and then, many of the schools with few Black students were virtually all-White. White students, who represented 10% of the district in 2016, were still concentrated in
disproportionately White schools, with nearly a third of White students going to schools with a majority White population. They are even more concentrated in schools with low percentages of Black students. In 2015, two-thirds of all White students across CPS attended schools with fewer than 10% Black students. However, there are now no schools that are all-White, and just a handful that are as high as three-quarters White.
0% 10% 20% 30% 40% 50% 60% 70% 80% 90% 100% 1971 1981 1989 2001 2012 2015
Percent of CPS students enrolled in schools with less than 10% Black population Percent of CPS students enrolled in schools with less than 1% Black population
The difference is that the population of Latino students has increased dramatically in CPS, and these students have also been tremendously segregated. Nearly 70% of all Latino students in CPS go to schools where Black students are less than 10% of the population. The segregation of Latino students is not addressed in this paper, but with their dramatic increase in the district, and the overlapping of multiple segregations across socio-economic disadvantage, poverty, and other
challenges such as language barriers, Latino segregation is crucial to understanding the entirety of segregation in CPS.
Segregation by Race & Class
Black students in CPS are segregated not only by race, but also by class. Students who qualify for free or reduced lunch (FRL), an indicator of low-income status, are 86% of the district population. Across CPS schools in 2015, 73% of all Black students and 75% of all Latino students attended schools where more than 90% of the students qualify for free lunch. Only 15% of White students went to such schools. White students in CPS typically attended schools where 58% of students are eligible for free or reduced lunch (FRL). Homeless students4, on the other hand,
typically attend schools where FRL averages over 94%.5 Within CPS, homeless students not only
must cope with problems associated with homelessness, but also must attend schools where disadvantaged students are highly concentrated.
The persistence of segregation by race and class has left more Black students in schools with high percentages of poor students than before. Figure 2 below shows how the intersection of race and class segregation has changed for Black elementary students in Chicago. In 1981, across CPS elementary schools, 38% of all Black students attended schools intensely segregated by both race and class: with at least 90% Black students and at least 90% eligible for free and reduced lunch.6 In
1989, the percentage was 47%. By 2012, 60% of Black elementary school students were in such schools.
Figure 2. Distribution of Black elementary students across CPS schools for 1981, 1989 and 2012.
Schools are grouped according to percentage of Black students and percentage eligible for free or reduced lunch.
4 Data provided to the authors by the Chicago Coalition for the Homeless.
5 The measure used to calculate the relationship between demographic groups is adopted from the
“neighborhood condition exposure index” in Galster (1995).
6 This measure on segregation by race and class over time is restricted to elementary schools because of
limitations of FRL data. FRL data at the high-school level in 1989 has obvious inconsistencies, and prior-year FRL data for high schools are not available.
38% 45% 60% 48% 32% 14% 5% 11% 11% 9% 12% 14% 1981 1989 2012 0% 20% 40% 60% 80% 100%
Distribution of Black elementary students in CPS
Schools at least 90% Black & at least 90% FRL
Schools at least 90% Black, less than 90% FRL
Schools 50% to 90% Black
Schools less than 50% Black
From 1981 to 2012, the total population of Black students in CPS plummeted from close to 240,000, 60% of all CPS students, to 156,000 or 39% of CPS. Despite their decreasing numbers and percentage in the system, the vast majority of Black students remained isolated in predominantly low-income Black schools that also became the target of destabilizing corporate reforms and experimentation.
The Dual Segregation of Black Teachers and Black Students
Historically, Black teachers have been segregated with Black students in CPS. Black teachers were also subject to other discriminatory policies by CPS. In the mid-20th century, a new
classification of teachers was created to deal with the rising CPS population, but this classification, called Full Time Basis Substitutes (FTBs) did not have the same pay, benefits or protections as regular teachers although they did the same work. Ninety percent of teachers given this designation were Black (Lyons, 2008).In 1967, a group of teachers, Concerned FTBs, organized, to fight for the rights of Full Time Basis Substitutes. In 1968, Concerned FTBs led a wildcat strike at more than 100 schools against racist certification procedures and school segregation (Schmidt, 2012).
The number of Black teachers in CPS continued to rise through the 1980s under the consent decree, reaching a peak by 1990, when they were 48% of the district. The decree not only monitored faculty integration, but also required principals of schools with segregated staff and few minorities to prove they had sought to hire teachers of color (Better Government Association, 2015). A year after the decree, CPS adopted a plan that assessed faculty hiring and integration each year, with the goal to have each school staff’s demographic composition differ by no more than 15% from the system-wide average (Jackson, 2010).
This focus on monitoring teacher segregation and improving staff diversity is important because teachers of color matter. The presence of teachers who can relate to students is important for helping to promote and share positive and culturally responsive classroom management strategies. Research has shown that Black students are less likely to receive exclusionary discipline when taught by a Black teacher (Lindsay & Hart, 2016). When teachers cannot relate to the students they teach, students’ behaviors can be misread, and disciplinary responses may be used as the default strategy (Harris & Karp, 2011). This is especially important for segregated Black schools, where school discipline rates are already disproportionately high.
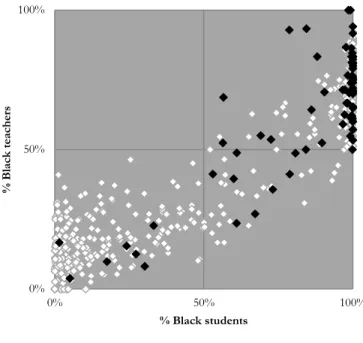
In 2001, most Black students attended CPS schools where they could reliably find Black teachers among the staff. Black teachers were roughly 40% of district teachers but made up two-thirds of teachers in majority Black schools and 71% of teachers in schools with over 90% Black student populations. Charter schools are excluded in these calculations.
This dual segregation is depicted in Figure 3. In this scatterplot of CPS schools (elementary and high school, excluding charters) in 2001, schools are plotted by their percentage of Black students on the x-axis and Black teachers on the y-axis. Schools with low percentages of Black teachers and Black students are concentrated in the lower left quadrant, and schools with high percentages of Black teachers and Black students are in the top right quadrant. Segregated Black schools in Chicago are very segregated, with a large concentration of schools hugging the top right-hand axis, with Black students numbering close to 100% of the school, and Black teachers in the predominant majority.
Figure 3. CPS elementary and high schools, excluding charters, by percentage Black students and
percentage Black teachers in 2001
A little over a decade later, the most significant change in CPS demographics has been the decline in both the percentage and number of Black teachers and students. Including both district and charter schools, by 2012, the number of Black teachers in CPS fell by half, from over 10,600 in 2001 to a little under 5,800. Their loss was even steeper than the loss of Black students, whose number also fell dramatically by 22% from over 224,000 to roughly 168,000 across all CPS schools.
Figure 4. CPS elementary and high schools, excluding charters, by percentage Black students and
percentage Black teachers in 2012 0% 25% 50% 75% 100% 0% 25% 50% 75% 100% % B lack teac hers % Black students 0% 25% 50% 75% 100% 0% 25% 50% 75% 100% % of B lack teac hers % of Black students
Although the numbers of Black teachers and students fell, the picture of segregation appears at first largely the same in 2001 and 2012. In 2012, as Figure 4 shows, district schools are still either predominantly Black schools with majority Black staffs and predominantly Black student
populations, or schools with small populations of both Black students and Black teachers. Four-fifths of Black teachers are in schools with majority Black populations, and a little over two-thirds are in schools with intensely segregated Black student populations.
However, on closer inspection, there are some notable changes. Most schools with majority Black student populations are still intensely segregated, reflecting the percentages addressed in the previous section of this article. However, a greater number of these schools are located in the lower-right quadrant: schools with a minority of Black teachers. Schools with minority Black populations are also concentrated further into the lower left corner, with very low percentages of both Black students and Black teachers.
There are also fewer schools hugging the lower-mid left-hand quadrant in Figure 4, the area representing schools with low minorities of Black students, yet with strong minorities of Black teachers. But in 2001, Figure 3 shows how there were numerous schools where Black teachers represented between 25% and 50% of teachers, and where Black students were less than a quarter of the student population.
With far fewer Black teachers in the district, and the vast majority segregated in predominantly Black schools, there is much less representation of Black teachers across district schools that do not have majority Black student populations. In 2001, the average percentage of Black teachers in schools where Black students were not the majority was 16%. In 2012, the percentage had fallen to 8%. Most dramatically, the number of schools where there are no Black teachers on staff has more than tripled from 10 to 37. Similarly, as shown in Table 1, schools where both Black students and Black teachers are a small fraction of the population--less than 5%--quintupled from 16 to 79. Schools with less than 10% Black students and less than 10% Black teachers now represent over a quarter of district schools.
Table 1
CPS schools with less than 10% Black students & Black teachers
Dual Demographics of Teachers and Students
2001 2012 Number of Schools % of all District Schools Number of Schools % of all District Schools Less than 10% Black 56 9.6% 145 26.4% Less than 5% Black 16 2.8% 79 14.4% Less than 1% Black 3 0.5% 11 2.0%
The decades-long targeting of Black teachers through layoffs, turnarounds, and closings has reinforced a deeply segregated learning environment. Segregation of teachers has actually increased, according to the dissimilarity index. The dissimilarity index is the most commonly used measure of segregation, a measure of the evenness of how a minority population is distributed across an area. The dissimilarity index is interpreted as the percentage of a minority population that would have to move neighborhoods (or census tracts, blocks, schools, etc.) so that all neighborhoods in the city have the same percentage of minority residents as the city as a whole (Weinberg & Steinmetz, 2002). Calculating the dissimilarity index for Black teachers shows that Black teachers are more segregated now than they were a decade ago.The dissimilarity index for CPS schools in 2012 shows that 60% of Black teachers would have to change schools for Black and White teachers to have identical distributions across schools, up from 48% in 2001.
The continuing decline of Black educators from schools in Chicago is tied not just to school closing and expansion policies, but also to teacher induction, hiring and evaluation policies. High-stakes testing and top-down accountability has now shifted from labeling and closing schools to labeling and firing teachers through teacher evaluation. The implementation in CPS of a new teacher evaluation system meant to standardize the process (in order to facilitate the labeling and firing of “unsatisfactory” teachers) shows how segregation impacts this “objective” standard. Black teachers were found to have significantly lower scores on the observation metric than White teachers. This difference was mainly due to the demographic differences in the schools where teachers taught: Black teachers made up 40% of teachers in high-poverty schools but just 8% in the lowest-poverty schools (Jiang & Sporte, 2016). Life experiences of students attending segregated, high-poverty schools in Chicago often include violence, housing mobility, income instability, health issues, and hunger. Yet wraparound school supports in the areas of nursing, social work, and counseling is missing or inadequate in the schools they attend (Caref & Jankov, 2012). When teachers in high-poverty schools are observed by an administrator, they receive evaluation scores that are lower than average, not because the teachers are less able, but because the schools are not meeting students’ needs.
The discrimination against Black teachers does not start and end with segregated schools. Even an automated screening process that CPS set up in 2012 to centrally filter teacher applicants was found to disproportionately screen-out Black applicants (Karp, 2016). The district has since abandoned the process, but they never offered an explanation as to the merit of any of the screening questions. Similarly, the teacher certification process in Illinois has relied on a standardized test to screen out candidates, even though no credible evidence exists that relates the certification test to performance in the classroom (Sanchez, 2014). By putting up discriminatory barriers to entering the profession, there are fewer Black teachers replacing Black educators lost to layoffs, turnarounds, school closures or retirements. When the consent decree was in force, principals at predominantly White schools had to make and show effort at hiring Black educators (Better Government
Association, 2015). Not only is such oversight now gone, but discriminatory barriers are in place, cloaked in objectivity.
Segregation and School Closures in Chicago
The figures in the above sections show that segregation of Black students and teachers in CPS endured even as their population in the district fell dramatically over the last decade. Thousands of Black teachers also disappeared from CPS. Both of these changes are linked to the wholesale closure and destabilization of majority Black schools in Chicago brought about by the policies of Renaissance 2010 (Lipman, 2009).
This section analyzes the changes that school closings had on segregated schools since 2001, but examines closures that occurred in 2013 separately for several reasons, both practical and substantive. For the 2013 closings, although numerous justifications were cited by the district
administration, the mayor and his supporters, the over-arching justification from the district was that the schools were underutilized. Only elementary schools were ultimately considered for closure due to underutilization in 2013.
The school closures that occurred over the decade prior were primarily done in the context of the Renaissance 2010 initiative. The justifications for closure were also numerous over the years, (academic reasons, to change the school type or to change the programmatic focus, building safety issues, low-enrollment, etc.), but the predominant narrative throughout this period was the under-performance of schools and the need to replace low-performing schools with new alternatives. Both high schools and elementary schools were affected.
Given these differences, the 2001 to 2012 closings and their impact on Black students and Black teaching staff, are analyzed separately from the 2013 closure of 50 elementary schools. A recent study of school closures in Chicago over the same duration found that the various justifications given for closures, such as declining enrollment, under-utilization, and low
performance on the district’s accountability metrics, were predictive of closure (Weber, Farmer & Donoghue, 2016). However, it also found that the percentage of Black students was predictive of whether a school was closed or not, a relationship that endured in both the 2013 closings, as well as the closures over the prior decade. The analysis of this paper reinforces their findings, showing how the demographics of both students and staff are related to school closures.
CPS school actions between 2001 and 2012 caused tens of thousands of students, 88% of whom were Black, to move to different schools or see all of their teachers and other school staff replaced. From 2001 to 2012, one out of every fourintensely segregated Black schools were closed, phased-out or turned around. Fewer than one in 20 schools with a student population less than 75% Black were affected by school actions.
The school closings that occurred between 2001 and 2012 are depicted in a scatterplot in Figure 5. Schools are charted by the percentage of Black students and Black teachers in 2001. Of the schools that were closed over this period, 90% had majority Black student populations, four-fifths had both majority Black student and teacher populations, and two-thirds had majority Black teaching staff and over 90% Black students. Closed schools represented 20% (57 out of 290) of all majority Black schools (majority Black students and Black teachers) in the top-right quadrant of Figure 5, while representing less than 3% of schools (seven of 252) in the bottom left quadrant.7
7 Some complications arise in representing demographics of schools closed or remaining open over a decade
of time, since demographics at schools usually change over time. The demographics used represent those of the schools as of 2001.
Figure 5. CPS elementary and high schools, excluding charters by percentage Black students and
percentage Black teachers (2001). Schools closed between 2001 to 2012 depicted in black, and schools remaining open in 2012 depicted in white.
These school closings created numerous dislocations for students. A study of the concentration of school closures in Bronzeville, 15 in 12 years, found that many students were displaced multiple times from their neighborhood schools, up to two or three times, throughout their elementary career (Ahmed-Ullah, 2012). Most displaced students ended up at other segregated Black schools, which were just as under-resourced as their prior ones. The influx of students without commensurate increases in funding endangered the receiving schools, which would then become the next targets for closure. Staff felt like they were being “set up for failure” by this cycle, with the constant dislocation of students and continued under-resourcing threatening the gains staff and students were making, driving down their achievement metrics and driving down future enrollments (Lipman & Person, 2007).
In the beginning of the 2012-2013 school year, CPS and Mayor Rahm Emanuel announced a plan to close a large number of schools at once, based on the premise that there was an “under-utilization crisis” in schools with low enrollment. Hundreds of schools were deemed underutilized and potentially eligible for closure. The district framed this closure plan as righting a historic wrong. CEO Barbara Byrd-Bennet was quoted as saying “for too long children in certain parts of Chicago have been cheated out of the resources they need to succeed because they are in underutilized, under-resourced schools” (Chicago Public Schools, 2013). Under the neo-liberal restructuring of public education, the very parameters of educational justice are redefined (Lipman, 2011b). The same rhetoric once used by civil rights activists to appeal for integrating schools and dismantling
segregation as a system, is now used to attack and dismantle the segregated schools themselves and without any
attempt to foster integration or to provide sufficient compensatory resources. 0% 50% 100% 0% 50% 100% % B lac k te ac he rs % Black students
The district’s framing of the ‘crisis’ was also hypocritical because the under-utilization in Black schools in Chicago had not been a mere demographic phenomenon. As a study by Caref, Hainds, Hilgendorf, Jankov and Russell (2012) of the expansion of charter schools in CPS showed:
The main driver of excess capacity, however, is the District’s aggressive charter operation proliferation campaign, construction of new buildings, and the acquisition of others. It is dishonest for the District to talk about underutilization when it has inhabited, acquired or constructed space to educate almost 50,000 additional students in the last ten years and has plans to open another 60 charter schools over the next several years. (p. 13.)8
The study identified disparate negative impacts on Black students and false claims about the efficacy of schools managed by charter organizations. Together with the closing of neighborhood schools, the expansion of selective enrollment schools and charter schools had increased racial segregation, depleted stable Black neighborhood schools, and increased student mobility. Despite the district’s culpability in fostering the circumstances wherein segregation, under-resourcing, low enrollment, and underutilization of neighborhood schools would continue and worsen over the decade, they placed the blame on demographics, or on the school communities themselves.
On May 22, 2013, the Chicago Board of Education voted to close 50 schools, turnaround five schools, and co-locate 17 schools. This happened despite massive protests, including 20,000 people who attended community hearings, hundreds who participated in a three-day march that rallied from one potentially closing school to the next, and culminated in a rally of thousands of parents, teachers, and members of the community outraged by CPS plans. The closings were opposed by academic researchers, news writers, parent groups, and teachers/supporters from all over the world. Even hearing officers, hired by CPS to rubber stamp closings, decided that 13 of the schools proposed for closure should be allowed to stay open (Lutton, 2013). Eleven of those were closed.
Local education journal Catalyst Chicago exposed the disparities between schools on the list for closure and all other schools (Forte, 2013).Among their findings were that within the attendance boundaries of schools on the closing list, more money has been spent on incarceration ($2.7 billion) than on schools ($2.2 billion); 59% of closing schools have higher than average special education populations and 43% have had two or more principals in five years; the median income in the attendance boundaries of closing schools is $36,649, compared to $53,313 in all other schools.
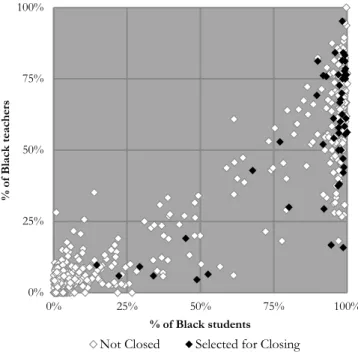
The vast majority of the 50 elementary schools closed were predominantly Black schools, as shown in Figure 6. Of the 50 schools that were closed, 94% had majority Black student populations; 86% were intensely segregated schools with a population of students over 90% Black; and more than 70% of closed schools had both majority Black students and teacher populations.
8 In November, 2012, the Chicago Teachers Union published The Black and White of Education in Chicago Public
Schools: Class, Charters, and Chaos; A Hard Look at Privatization Schemes Masquerading as Education Reform (Caref et
al., 2012). The purpose of this report was to delineate the negative consequences of Chicago’s Renaissance 2010, a plan to establish 100 schools (mostly charter) independent of Chicago Public Schools’ oversight. The report identified disparate negative impacts on African American students and false claims about the efficacy of schools managed by charter organizations.
Figure 6. CPS elementary, excluding charters, by percentage Black students and percentage Black
teachers (2013). Closed schools are depicted in black, and schools that remained open are depicted in white.
The closed schools were paired with schools designated to receive the students affected by the closings. These receiving schools were as segregated as the closed schools. Furthermore, the district made a promise to shift scarce capital funds to the receiving school buildings, and invest in the newly consolidated schools. Yet, the capital investment in receiving schools was far less than what was spent on just three selective enrollment high schools in recent years. Per-pupil expenditure on the selective enrollment expansion was nearly $70,000 per student, whereas investment in
receiving schools amounted to less than $4000 per affected student.9 As reported in the Chicago Sun Times, since the admissions process dropped the criteria of race in 2009, spaces in selective
enrollment high schools are increasingly and disproportionately going to White students (Novak & Fusco, 2014).
The district also continues to invest in school buildings and annexes for over-crowded schools, predominantly in neighborhoods with relatively greater White student populations. In the summer of 2016, an investigative report by a local public radio station revealed that new school building expansions over the last several years were overwhelmingly granted to specialized and desired schools that serve relatively low percentages of poor and Black students (Karp & Vevea, 2016). Many of these expanded schools are a short distance away from under-enrolled high-poverty, 90-100% Black neighborhood schools that had escaped the 2013 school closure dragnet that
shuttered 50 schools.
9 A $17 million expansion for Payton High School was for 400 students (Ahmed-Ullah, 2013), the $60 million
high school originally called the Obama High School was for 1200 students (Ahmed-Ullah & Byrne, 2014), and the new Jones High School was built for $115 million and accommodates 1200 students (City of Chicago, 2013). 0% 25% 50% 75% 100% 0% 25% 50% 75% 100% % of B lac k te ac he rs % of Black students Not Closed Selected for Closing
Since the closings, Black students have declined in CPS by 12%, over twice the 5% decline of the total school population. The number of White students in CPS have actually increased by 4% in the past four years. And after the closing of 50 schools, Black students were hardly less segregated across the elementary schools that remain. In 2015, 66% of Black students attended intensely
segregated Black schools, and 53% of Black students attended schools intensely segregated by both race and class.10
The mass school closures and the expansion of non-neighborhood schools of choice in Renaissance 2010 were implemented with neither a broad strategy to integrate students, nor a commitment to provide sufficient resources for the socio-economically disadvantaged students remaining in the slowly deteriorating segregated neighborhood schools. The district simultaneously expanded the number of selective enrollment high schools and gifted elementary schools, and in 2009, removed race as a criterion for entry into its magnet elementary and selective enrollment high schools. In response to segregated residential patterns, the district chose to add capacity and build new schools at great cost in neighborhoods, predominantly White and Latino, where schools were deemed overcrowded. CPS did not redraw school boundary lines so that schools with too few and too many students would be paired to the advantage of both, which would also lead to fewer segregated schools.
The district’s approach to dealing with underutilization placed the burden disproportionately on Black students. This parallels the way desegregation historically played out in Chicago and nationally. When school boards were forced to reckon with segregation under federal enforcement in the decades following Brown v. Board, it was often Black students that disproportionately bore the burden of being bused to White schools, unable to attend neighborhood schools and sometimes having their schools closed down altogether. The political power of recalcitrant districts and White constituencies in both the north and the south worked to shift the burden on Black schools.
Thousands of qualified Black teachers and administrators were lost. Responding to the displacement and lack of voice in the process, Black educators and civil rights organizations in the South, who were pushing for a more comprehensive and equitable process of integration, dubbed the process “outer-gration” (Walker, 2009).The loss of Black educators during that period is paralleled today in Chicago by their rapid decline over the last decade as historically Black schools were closed over community and staff objections, and schools with virtually no Black faculty members proliferated.
The next section lays out how the proliferation of schools of choice in Chicago contributes to these dynamics.
Charter Schools Expand Segregated Environments
Evidence from the rapid expansion of charter schools in Chicago shows that they have reproduced and worsened the historic segregation found in district schools, while providing equal or worse educational opportunities for students of color (Caref et al., 2012; Institute on Metropolitan Opportunity, 2014). Caref et al. (2012) found that the representation of Black and Latino educators was particularly poor in Chicago’s charters, and that in addition, teacher turnover at charters was far higher than at district-run schools. This section builds upon those findings, to show that charter schools have expanded segregated environments for students. Charters also represent the expansion of schools that are virtually all Black or Brown, but often with few or no teachers of color, and inexperienced teaching staff.
Several limitations of the data available from charters pose complications for presenting the data in scatterplots in a manner similar to district schools. Data on charter school teachers were available for certified teachers only, (charter schools in Illinois are allowed to hire uncertified teachers for up to 25% of their teaching staff), and were aggregated by the charter school network, rather than by individual school sites (some charter schools in Illinois are licensed to operate multiple campus locations). With these limitations in mind, analyzing the available data still shows disturbing trends.11
In 2012, Black students made up 60% of all charter school students but Black teachers were just 18% of certified teacher staff. A quarter of the 32 charter schools and networks with available information had a teaching staff that was less than 5% Black. This disparity was also striking at several of the schools with intensely segregated Black student populations. Out of the 18 charter schools and networks with a student population at least 90% Black, six had a teaching staff that was 15% Black or less.
The limitations of the data available from charter schools could mask the depth of these disparities. Charter school teacher data were reported only aggregated to the network level. Looking at trends at the charter network level can obscure some of the segregation present at the campus level, both for students and teachers. Campus-level data available for student demographics shows clearly how this can be the case for students. For example, in 2016, the Chicago International Charter Schools, a charter school network of mostly elementary schools, had 65% Black students across their 15 campuses. However, 90% of those Black students were in nine of those campuses, all with a student population over 87% Black. Similarly, the Noble Network of Charters, serving mostly high school populations, had a student population that was 49% Black in 2016. Yet 70% of Black students attending Noble high schools were concentrated in the six campuses with a student population over 82% Black.
Under Renaissance 2010, historically Black schools with Black educators in Black
neighborhoods, were closed down. The rapid expansion of segregated charter schools in Black and Latino neighborhoods meant that experienced teaching staff were replaced by new hires, often White and also inexperienced.
Data from the Illinois State Board of Education (ISBE) reports teacher experience across all schools, including both district and charter schools. Analyzing this data over time shows how under corporate reform, lack of access to experienced teachers has become a point of inequity.12 In 2001,
first-year teachers were 5.2% of all teachers in CPS.
By 2012, across all schools including district and charter schools, the percentage of first-year teachers had increased to 7.7%. Looking at probabilities shows how racial disparities have arisen over this time.13 Probabilities show the likelihood that a typical Black or White student has a novice
teacher. Figure 7 depicts these probabilities. In 2001 the probability that a Black student would have a first-year teacher was no different than for a White student, at 5.1%. By 2012, a Black student was nearly twice as likely to have a first-year teacher as a White student was, 8.9% compared to 5.3%.
11 Based on teacher demographic data in Illinois State Board of Education (2012).
12 Authors’ calculations based on teacher experience data in the “Teacher Service Records” available from
Illinois State Board of Education (2001, 2012). More recent years were not analyzed due to changes in state data collection since 2012 which eliminated teacher experience data. For charter schools, the data on teacher experience from the Illinois State Board of Education was grouped at the charter network level, without distinguishing between separate campuses for charter schools with multiple campuses.
13 For details on the model used, see Clotfelter, Ladd & Vigdor (2005, p. 385). The analytical model used
Figure 7. Probabilities of having a first-year teacher for black and white students, 2001 to 2012.
The proliferation of charter schools in CPS over the last decade is at the core of this disparity. For Black students in charter schools, the probability of having a first-year teacher was over 25%, whereas it was just 6% for Black students in district schools. There was a similar disparity for White students as well—their probability of having a first-year teacher is 24% in charters and 5% in district schools. However, because of the composition of charter schools, these disparities have far different consequential magnitudes. More than 15% of Black students in CPS attended charter schools in 2012, whereas just 2% of CPS White students attended charters then. Furthermore, the percentage of Black students in CPS who attend charter schools has continued to rise, and in 2015 was at 20%.
In addition to the segregation of minority teachers, disparate access to experienced educators was one of the inequities identified for remedy by the original consent decree (Jackson, 2010). In the two decades following the decree, experienced Black educators were hired and retained in district schools. The limited impact of desegregation efforts meant that Black educators were often teaching at segregated Black schools. Yet this also meant that Black students had access to a stable and experienced teaching staff. These disparities are important because teacher experience makes a significant difference for students. Research has shown that teacher experience benefits student achievement, and that teachers improve over their career (Kini & Podolsky, 2016). The lack of diversity is of significant concern, because teachers of color matter. As discussed earlier, the ability of teachers to relate with students is crucial, especially in relation to how teachers respond to student behaviors. Exclusionary discipline practices are already high in segregated Black schools, but charter schools report even higher rates of discipline and suspension for students of color (Losen, Keith, Hodson, & Martinez, 2016). Freedom from regulations that govern other district schools is one of the distinctive features of charters, and school discipline policies is an area where charters
traditionally have been given more leeway. The experience in Chicago shows that they have used this leeway to contribute to the high rates of exclusionary discipline experienced by students of color.
5.2% 8.9% 5.1% 5.3% 0% 5% 10% 2001 2012