Traffic Accidents at Hazardous Locations of Urban Roads
Mohammed Taleb Obaidat and Thanaa M. Ramadan
Civil Engineering Department, Jordan University of Science and Technology (J.U.S.T.); P.O. Box 3030, Irbid, Jordan. E-Mail: mobaidat@just.edu.jo
ABSTRACT
This study aims at highlighting the most contributing and influential factors to accident occurrence at hazardous locations of local urban roads, and correlating accident characteristics to different factors including geometric elements, traffic speed, pavement type, lighting conditions, type of collisions, pedestrian facilities existence and traffic conditions.
The study was conducted using twenty-eight hazardous locations at Amman-Jordan roads. Each of the hazardous locations had at least twenty accidents and two fatality records per year. Data were collected through different sources that included Great Amman Municipality, Traffic Institute, Police Traffic Department and field studies. Different stepwise statistical regression models were developed to correlate accident characteristics with the studied variables. It was found that the logarithmic and linear models were the most significant and realistic models that can be used to predict the relationship between the accident characteristics as a dependent variable and the other studied variables as independent variables. The developed models were strong and predictable because the coefficient of multiple determinations was very close to the adjusted coefficient of multiple determinations. The following variables were found to be the most significant contributors to traffic accidents at hazardous locations: average running speed, posted speed, maximum and average degree of horizontal curves, number of vertical curves, median width, type of road surface, lighting (day or night), number of vehicles per hour, number of pedestrian crossing facilities and percentage of trucks.
The study could open the door for planners and traffic engineers to overcome the problems associated with traffic accident occurrence at hazardous locations and enhance their safety. The developed models showed that accident characteristics such as number of accidents, number of fatalities, number of injuries, type of accident and number of vehicles involved in accidents, and statistics of hazardous locations could be predicted if the traffic conditions, geometric elements and environmental variables are known. The study could also be enhanced if incorporated with drivers’ characteristics including socio-economic data.
KEYWORDS: Hazardous locations, Traffic accidents, Geometric elements of roads, Statistical models, Urban roads.
INTRODUCTION
Highway safety at a roadway and roadside features are mainly affected by human factors (including driver ability, driver performance, driver knowledge and
awareness), environmental factors and vehicle characteristics. However, there are other factors (such as highway design and design associated geometry) that also have a tangible impact on safety (AASHTO, 2004).
However, the three major factors associated with fatal vehicle accidents are driver behavior, vehicle characteristics and roadway design. It is estimated that roadway design is an important factor in one-third of all fatal and serious traffic accidents (TRIP, 2009). Therefore, improving safety on roadways can be achieved through further improvements in vehicle safety, improvements in driver, pedestrian and bicyclist behaviors as well as a variety of geometric design improvements in roadway safety features.
The primary indicator used in ranking the severity of the road safety situation is the number of fatalities per 10,000 registered vehicles (Traffic Safety Bureau, 2005). Average fatalities per 10,000 registered vehicles in Jordan were 13 for the last three years. This rate is about 6 to 8 times of that in industrialized countries like USA or Sweden (Obaidat et al., 2008; Al-Khateeb et al., 2008; Khedaywi et al., 2008).
In developing countries, accident number and type are mainly registered for the drivers to be the cause of accidents regardless of the real cause of the accident. Neither the roadway geometry nor the environment is considered as a cause for accidents, simply because there is an ambiguity of the accident’s cause for the police officer who registers the accident.
One of the major topics of roadway safety in urban areas is to predict the numbers, types and severities of different types of accidents as functions of geometrical, behavioral and environmental factors. Prediction models related to accidents at hazardous locations could give clear indication for traffic safety issues at urban roads. Further, it would identify the significance of each variable and its contribution to accidents and distinguish the overlap between the geometric and behavioral factors.
This study attempts at predicting the numbers of accidents, as well as their types and severities based on geometrical road elements, environmental factors and driver behavioral issues like speed. Moreover, it will tackle the most influencing and contributing factors to traffic accidents at hazardous locations in urban areas.
LITERATURE REVIEW
Highway geometry should be designed for vehicle traffic safety and efficiency, particularly on trunk roads or express ways on which traffic function must be most important. For example, the minimum radius of horizontal curve is defined with design speed, superelevation and side slip friction factor. The value of the side slip friction factor used in any design standards, such as AASHTO Green Book (AASHTO, 2004), is not clearly determined with changes according to the road surface condition, such as dry, wet or snowy surface. The authors insist that all of the design values should have a unique safety factor to keep consistent traffic safety.
Studies showed that horizontal curves typically have crash rates from 1.5 to 4 times higher than tangent sections. In fact, crash rates tend to increase with the reduced sight distance associated with either a reduced curve radius or an increased deflection angle or curvature. Therefore, it is usually beneficial to design horizontal alignments with combinations of maximum curve radii and minimum deflection angles. On the other hand, the use of composite curves; i.e. spiral curves and simple circular curves, could help to mitigate some of the safety problems associated with horizontal curves by providing a smoother and safer path for drivers from tangent to curve position and a location for the required length of transition from normal crown to full superelevation pavement (NCHRP, 2003; AASHTO, 2004).
Vertical alignment can also lead to higher crash rates due to the reduced sight distance imposed by the crest of a vertical curve. Therefore, the severity of vertical curvatures is minimized. Avoidance of intersections on or near vertical curves represents one of the practical examples in this domain.
Conflicts on roadways are mainly contributed to by intersections. Medians, auxiliary lanes and protected left-turn phasing signals are some of the safety measures that can reduce conflicts. Enlarging the corner radius can increase the roadway crossing width that makes it difficult for pedestrians to cross the road
and allows for increased vehicle speeds around the intersection corner. However, decreasing the radius can cause maneuverability problems for large vehicles (MUTCD, 2003).
Loo (2009) analyzed the spatial characteristics of road crashes in Hong Kong by the hot zone methodology and compared them to those obtained by using the blacksite methodology. His study was important, both theoretically in enriching conceptualizing and identifying hazardous road locations and practically in providing useful information for addressing road safety problems.
McCarthy (2001) made an empirical literature review to study the effect of motor vehicle speed limits on highway speeds and highway safety. Among the findings of his research, small speed limit changes on non-limited-access roads will have a little effect on speed distribution and highway safety unless complemented with speed-reducing actions. Implications for further research relate to the importance of controlling for confounding factors, aggregation and the importance of enforcement in affecting speed distributions and highway safety.
Hong and Oguchie (2005) evaluated the values of operating speed with highway design elements such as curvature of horizontal radius and vertical grade.
Mungnimit (2001) and Bener (2005) explored the pattern of road traffic accidents and their causes in developing countries. They took Thailand and State of Qatar as representative examples for developing countries. Results of their research showed that the major cause of traffic accidents was careless driving (71%). The majority of accident victims (53%) were in the most productive class in the society; i.e., age group 10 to 40 years. Road traffic accidents were the third leading cause of death after the diseases of the circulatory system and cancer. Therefore, they suggested controlling road traffic injuries through strict policy interventions, mass media, road safety programs and a national traffic campaign to increase the use of seat belt (Obaidat et al., 2008; Al-Khateebet al., 2008; Khedaywi et al., 2008).
Khorshid and Alfares (2004) found the optimum speed control hump geometric design by using the sequential quadratic programming method. The speed hump design can be improved in terms of not only the hump dimensions but also the hump profiles in the rise and return stages. Therefore, the polynomial hump has the best design because of its profile flexibility.
The severity of serious traffic crashes at hazardous locations could be reduced through roadway improvements, where appropriate, such as adding turn lanes, removing or shielding obstacles, adding or improving medians, widening lanes, widening and paving shoulders, improving intersection layout, as well as providing better road markings and upgrading or installing traffic signals. Literature showed that geometric design improvement can reduce fatal accident rate. For example, fatal reduction rate due to installation of new traffic signals reaches 53%, turning lanes and traffic signalization 47%, widening or modifying bridges 49%, construction of medians for traffic separation 73%, realigning roadways 66%, removing roadside obstacles 66% and widening or improving shoulders 22%. Roads with poor geometry, with insufficient clear distances, without turn lanes, with inadequate shoulders for the posted speed limits or with poorly laid out intersections or interchanges, pose greater risks to motorists, pedestrians and bicyclists (TRIP, 2009).
Therefore, this paper will focus on hazardous locations in urban areas and the correlation of accident characteristics with geometrical elements of the roads, as well as other factors such as driver behavioral issues like speed, traffic safety factors and environmental factors.
TRAFFIC ACCIDENTS IN JORDAN Jordan, of a population of about six millions, has about one million vehicles. Jordan accident statistics showed that traffic crashes were the first cause of death. Official data shows that the human factor's share; that is represented by the drivers and their behavioral mistakes, reached up to 90% of the accident's responsibility. Further, statistics showed that
more than 85% of the drivers' mistakes were due to speeding; i.e., about 77% of crash causes were due to speeding. However, the share of vehicles, road geometry and environmental factors of accidents' percentage didn't exceed 10% (Jordan Traffic Institute Report, 2008; Obaidat et al., 2008). Of course, these statistics are misleading because many accidents occur due to geometrical problems; however, officials consider them due to drivers’ fatal mistakes. Reporting accident causes depends on accidents’ locations and season. For example, accidents located at curves may share causes of drivers’ behaviors or road geometry because police reports don’t have traffic accident causes. Therefore, this study will focus on the contribution of geometrical factors on traffic accidents using a statistical modeling approach.
The accidents’ percentages for 12 Jordanian governorates for the year 2008 were 94.5% for vehicles’ crashing, 3.7% for pedestrians’ accidents and
1.8% for flipping over accidents. Most of these accident fatalities were due to changing lanes while driving; that shares about 42% of the accident percentages. Of course, lane numbers, road furniture and geometrical elements do have relationships with number and type of accident (Obaidat et al., 2008; Al-Khateebet al., 2008; Khedaywi et al., 2008).
Since Amman, the capital of Jordan, has more than 50% of the Jordanian population and vehicles, it has about 66% of Jordan’s accidents. The percentages of different categories of Amman’s accidents with respect to the other eleven governorates were: 20% of flipping over because it is an urban area, 68% of vehicles’ crashes and 39% of pedestrians’ accidents. Therefore, this study was conducted for hazardous locations on Amman roads (Jordan Traffic Institute Report, 2008).
The most important accident types are: crashes and flipping over accidents, because they are correlated with geometric design elements of the roads.
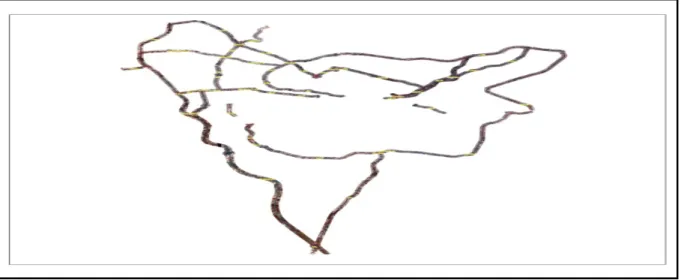
Figure 1: Streets’ Network Having the Studied Hazardous Locations in Amman HAZARDOUS LOCATIONS
Geographic Information System (GIS) concepts and methodologies were used to identify the hazardous locations in Amman-Jordan. The threshold values for the numbers of accidents and fatalities used by the authors to define the hazardous locations were twenty
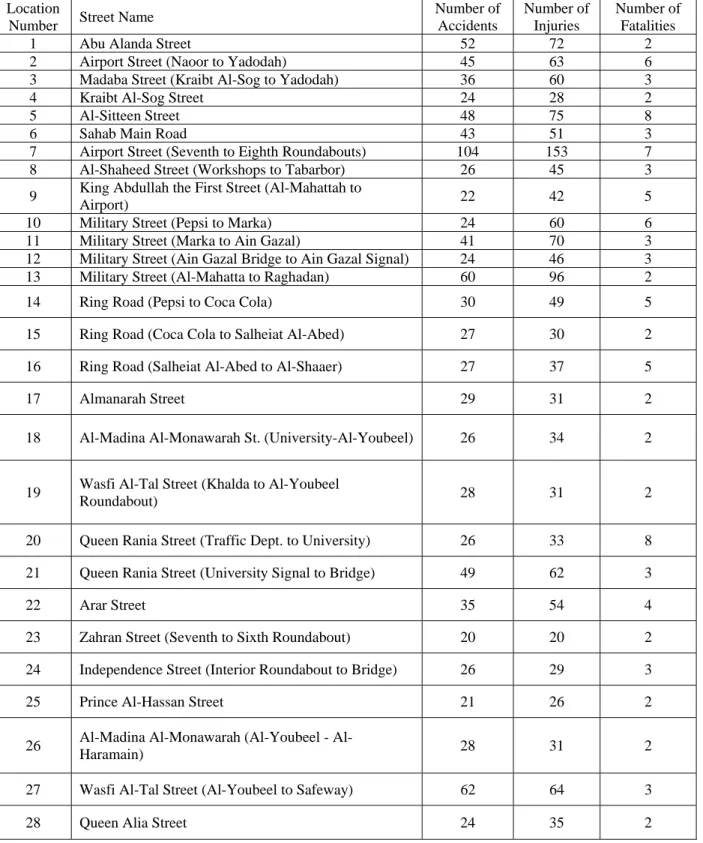
and two, respectively. Table 1 shows the names and locations, numbers of accidents, injuries and fatalities of the studied hazardous locations that represent the yearly average of the years 2005-2008. However, Figure 1 shows the streets’ network containing the studied hazardous locations. Two examples of these locations are shown in Figure 2 for Madina
Al-Monawarah Street. The hazardous locations form black spot areas for traffic accidents where frequent repetitions of accidents happen mainly. The locations represent a length or area rather than spot locations because there is a lack of this piece of information. However, a recent service has been launched at the Police Traffic Department that shows the exact three-dimension (3-D) accident location using portable Global Positioning System (GPS) units. Great Amman
Municipality regularly makes some geometric enhancement on them to control traffic movement, while the locations are always under traffic control and police patrol by the traffic department.
It is worth mentioning here that the definition of hazardous locations is different from a country to another and depends on the number of fatalities or injuries threshold values as well as other geometrical and traffic condition factors.
Figure 2: Examples of Hazardous Locations at Al-Madina Al-Monawarah Street DATA COLLECTION
To achieve the objectives of this paper, data were collected and integrated from different sources and from the field, too. The followings are the main approached agencies and their associated data:
1. Jordan Traffic Institute and Traffic Department: The following data were obtained for roads that contain hazardous locations: Number of vehicles involved in accidents (NVA); Numbers of accidents (NA), injuries (NI) and fatalities (NF) for hazardous locations; Type of accidents (collision/crash, pedestrian (FP for fatalities, IP for injuries and SP number of slight injuries caused by pedestrian accidents), or turnover/flipping over) and their associated numbers of
fatalities (FC fatalities for collision, IC injuries for collision, FT fatalities for turnover and IT injuries for turnover), severe injuries collisions (SEIC), slight injuries collisions (SLIC), severe injuries pedestrian accidents (SEIP), slight injuries pedestrian accidents (SLIP), severe injuries turnover (SEIT), slight injuries turnover (SLIT) and number of accidents (NAC); Type of road surface (dry, wet or unpaved); Lighting conditions and time of accident (night and day); and type of collisions for each type of accident (tail gating, incorrect lane usage, sudden swerve, failing to take measures, disallowing priority, exceeding speed limit, driving opposite to traffic, incorrect bending, failing to comply with obligatory signs, or brake failure).
Table 1. Hazardous Locations in Amman-Jordan Location
Number Street Name
Number of Accidents Number of Injuries Number of Fatalities
1 Abu Alanda Street 52 72 2
2 Airport Street (Naoor to Yadodah) 45 63 6
3 Madaba Street (Kraibt Al-Sog to Yadodah) 36 60 3
4 Kraibt Al-Sog Street 24 28 2
5 Al-Sitteen Street 48 75 8
6 Sahab Main Road 43 51 3
7 Airport Street (Seventh to Eighth Roundabouts) 104 153 7
8 Al-Shaheed Street (Workshops to Tabarbor) 26 45 3
9 King Abdullah the First Street (Al-Mahattah to
Airport) 22 42 5
10 Military Street (Pepsi to Marka) 24 60 6
11 Military Street (Marka to Ain Gazal) 41 70 3
12 Military Street (Ain Gazal Bridge to Ain Gazal Signal) 24 46 3
13 Military Street (Al-Mahatta to Raghadan) 60 96 2
14 Ring Road (Pepsi to Coca Cola) 30 49 5
15 Ring Road (Coca Cola to Salheiat Al-Abed) 27 30 2
16 Ring Road (Salheiat Al-Abed to Al-Shaaer) 27 37 5
17 Almanarah Street 29 31 2
18 Al-Madina Al-Monawarah St. (University-Al-Youbeel) 26 34 2
19 Wasfi Al-Tal Street (Khalda to Al-Youbeel
Roundabout) 28 31 2
20 Queen Rania Street (Traffic Dept. to University) 26 33 8
21 Queen Rania Street (University Signal to Bridge) 49 62 3
22 Arar Street 35 54 4
23 Zahran Street (Seventh to Sixth Roundabout) 20 20 2
24 Independence Street (Interior Roundabout to Bridge) 26 29 3
25 Prince Al-Hassan Street 21 26 2
26 Madina Monawarah (Youbeel -
Al-Haramain) 28 31 2
27 Wasfi Al-Tal Street (Al-Youbeel to Safeway) 62 64 3
Table 2. Developed Linear Models and their Associated Statistical Characteristics Dependent Variable Independent Variables Developed Equations R 2 Adj. R2 Sign. Number of fatalities in all accidents (NF) SEIC (Number of severe injuries caused by collision accidents) NAC (number of accidents caused by incorrect lane usage by pedestrians)
DRY (type of surface) WET (type of surface) UNPAVED (type of surface)
NIGHT (Lighting) DAY (Lighting) VPH (vehicle per hour) PC (% of cars)
B (% of buses) T (% of Trucks)
V (posted speed in km/hr) VAvg (average speed on road) NL (number of lanes) W (width of one way) MW (width of median) PO and PU (# of pedestrian bridges) PM (# of markers for pedestrian walks) NHC (# of horizontal curves) NVC (# of vertical curves) Dmax (maximum Da) Dava (average Da)
NF=+67.423+0.292*Dry+0.0902 *Wet+0.715*Unpaved+0.05376* Night-0.413*Day-0.00065*Vph- 0.377*PC-0.663*B-0.287*T- 0.0714*V-1.142*VAvg- 1.617*NL+0.353*W-0.214*MW+0.803*PO+ 0.138*PM-0.538*NHC+0.428*NVC+1.392* Dmax-1.547*Dava SEIC=362.108+1.86*DRY+1.75 *Wet+7.09*Unpaved- 1.56*Night-1.71*Day- 0.0026*VPH-3.10*PC-2.00*B-2.97*T-1.38*V - 0.35*VAvg+0.56 *NL -0.08*W- 1.20*MW+1.41*PO-0.34*PM-4.04*NHC+3.38NVC+3.92*Dmax -4.163Dava NAC=-9.369+0.05468*Dry+ 0.04532*Wet-0.256*Unpaved- 0.0269*Night-0.00002765*Day+0.02765*Vph+ 0.08721*PC+0.05329*B+0.0817 1*T-0.00985*V+ 0.01030*VAvg+0.04138*NL+ 0.03174*W+0.103*MW+0.0060 26*PO-0.128*PM-0.0303*NHC-0.00388*NVC+0.07062*Dmax -0.115*Dava 0.884 0.971 0.814 0.880 0.950 0.804 0.026 0.015 0.005 NAC (Number of accidents caused by collisions)
Dry (type of surface) Wet (type of surface) Dava ( average degree of curvature)
NAC= -7.487+0.596*Dry+ 1.573*Wet+1.028*Dava
0.919 0.909 0.000
2. Greater Amman Municipality: Degree of curvature based on arc definition (Da) for horizontal curves, maximum and average degree of curvature
(Dmax and Dava, respectively), median width (MW), roadway sketches and dimensions and aerial photographs for hazardous locations.
3. Field Data Collection: Field surveys using different surveying instruments and inventories were conducted to find the following: Road name; Road zone or location; Traffic count (Average Daily Traffic (ADT)), Numbers and percentages of vehicles (passenger cars (PC), buses (B) and trucks (T)); Minimum and maximum posted speed limit (Vmin and Vmax, respectively); Note: Although Jordan uses one posted speed, the authors used the superelevation’s equation to compute these two speeds); Number of lanes (NL); Width of each direction of the road (W); Divided or undivided road (DR and UR, respectively); Median width and type (MW); Number of pedestrians crossing facilities (Overpass (PO), underpass (PU) or marked pedestrian crossing (PM)); Numbers and types of horizontal and vertical curves (NHC and NVC, respectively); Minimum and maximum grade of vertical curves (Gmin and Gmax, respectively).
It is worth mentioning here that the minimum and maximum values for some of the variables were used in statistical analysis although some of them were not statistically significant.
ANALYSIS OF RESULTS AND FINDINGS SPSS software statistical package was used to perform the statistical analysis of this research work (George and Mallery, 2009). Stepwise regression analysis procedure was used to predict statistical models that have the capability of determining the value of the dependent variable (numbers, types and severities of accidents) using different observations of independent variables (geometrical, behavioral and environmental factors). Multiple regression analysis was applied to find the relationship between several independent variables or predictor variables and a dependent or criterion variable. The selection of best models used the general goodness of fit represented by coefficient of simple and multiple regression determination (R2), general linearity by applying F-test, significance of individual variables through t- or F-test, normality of residual distribution and consistency of
variance and standard error of estimate.
The statistical characteristics of the developed linear models are shown in Table 2, whereas the models associated with the logarithmic function are shown in Table 3. As shown in these tables, the developed models were statistically significant at an
α
-level less than 0.05 with R2 around 99% to 100% which can be considered relatively high. Moreover, the differences between R2 and adj. R2 were relatively very small, which is an indication that the models are strong and predictable. The models had small standard errors of estimate. This means that the accident characteristics can be predicted and explained by the included independent variables. Based on these findings, the models shown in Tables 2 and 3 could be used to predict the accident characteristics on urban roads. These models could be applicable and employed by highway and traffic engineers to estimate or predict the occurrence of accidents in terms of numbers and types while the roads are at the early design stages.It’s worth mentioning here that other models such as the power, polynomial and exponential functions have been checked, however, they were statistically insignificant and the linear models and the logarithmic models were statistically better.
Linear models could predict the number of accidents as function of pavement surface whether it is dry, wet or unpaved. However, the number of accident fatalities and the number of accidents caused by incorrect lane usage could be predicted knowing the type of surface, lighting condition, traffic volume, percentage of each vehicle’s type, posted and average running speed, number of lanes, width of each direction of road, median width, number and types of pedestrian crossings, number of horizontal and vertical curves, as well as maximum and average degrees of curvatures on the road. Numbers of accidents caused by collisions are predicted as functions of the types of surfaces and the average degrees of curvature. Of course, these factors form the contributions of different categories causing traffic accidents such as:
Table 3. Developed Logarithmic Models and Their Associated Statistical Characteristics Dependent Variable Independent Variables Developed Equations R 2 Adj. R2 Sign. NF (Number of fatalities) Night (Lighting) VPH (vehicle per hour) Vavg (average speed in km/hr)
Dava (average Da)
NF=-9.67+ night *log1.05-
Vph*log.12+Vavg*log5.97+Dava*log1.15
1 1 0 NI (Number of
injuries)
NI= -56.128+night*log20.67-Vph*log6.10+Vavg*log47.15+ Davg*log22.22
1 1 0 SEIT (Number of
severe injuries caused by turnover)
SEIT= 31.520-night*log6.38-
Vph*log1.58-Vavg*log10.813+Davg*log0.606
1 1 0 NAC (Number of accidents caused by turnover) NAC = 32.520-night*log6.38-Vph*log1.58-avg*log110.81+ Davg *log0.696 1 1 0 NVA (Number of vehicles involved in accidents) NVA= -158.53+night*log69.80+ Vph*log12.77+Vavg*log48.89+ Davg*log13.08
1 1 0 FC (Number of
fatalities by collisions) VPH (vehicle per hour) B (% of buses)
Vavg (Average speed - km/hr)
NVC (# of vertical curves)
Dava (average degree of curvature (Da))
FC = -64.27-Vph*log4.97 +B*log0.065+ Vavg*log29.21
-NVC*log11.70-Davg*log6.32 1 1 0 SLIC (Number of slight injuries by collisions) SLIC = 11.67Vph*log0.108 -B*log9.773- Vavg *log0.881 + NVC *log27.186+ Davg *log20.367
1 1 0 NAC (Number of
accidents caused by collisions)
NAC = 97.21-Vph*log3.217 - B *log7.950- Vavg *log38.410 + NVC *log13.04+ Davg *log5.11
1 1 0 SLIP (Number of
slight injuries by ped. accidents)
DRY(type of surface) W (width of one way) Davg (average Da)
SLIP=-60.58+dry*log53.90-W*log6.05-
Davg *log1.723 1 1 0.003
SLIT (Number of slight injuries caused by turnover)
Night (Lighting) Davg (average Da) PM (# of markers for pedestrian walks)
SLIT= 19.59- night*log19.36+ Davg *log4.095-PM*log1.470
1 1 0.002 TGC (Number of
accidents caused by tail gating collisions)
Vph (vehicle per hour) B (% of buses) Vavg (Average speed- km/hr)
NVC (# of vertical curves)
Dava (average Da)
TGC = 117.36+Vph*log4.13 + B*log2.61- Vavg*log80.81 +NVC*log30.118+Dava*log21.43
1 1 0 NAS (Number of
collisions caused by speed limit exceeding)
NAS= 20.70-Vph*log2.07 +B*log4.93- Vavg *log8.80 -NVC*log3.167+ Dava
*log1.557 1 1 0 NAR (Number of accidents caused by reversing incorrect by pedestrians) Night (lighting) VPH (vehicle per hour) Vavg (average speed in km/hr)
Dava (average Da)
NAR= 2.415+night*log1.875-
Vph*log0.947-Vavg*log0.519+Dava*log0.809 1 1 0 NAL (Number of
accidents caused by incorrect lane usage by pedestrians)
NAL= 15.76- night*log3.195-Vph*log0.790- Vavg *log5.49+ Dava
1. Geometric factors: Number of lanes, width of one way of the road, median width, number and types of pedestrian crossings, number of horizontal and vertical curves, and maximum and average degrees of curvature.
2. Drivers’ behavioral factors: Posted and average running speeds.
3. Environmental factors: Surface type, lighting condition and day/night.
4. Traffic conditions: Traffic volume (ADT) and percentages of different vehicles.
Obviously, the majority of the factors are belonging to geometrical factors. This is an indicator that accidents caused by geometrical errors are wrongly interpreted when recording accidents by the police department. Therefore, at the time of accident and when recording the causes of accidents at the police report, the police department should correctly define new indicators to distinguish between accidents caused by geometrical elements, drivers’ behavioral factors and other factors. Different categories for each variable are assigned different codes in the statistical models. For example, pavement conditions were used as dummy variable: wet pavement has a code of 1, while dry pavement has a code of 0… and so on for the other variables.
The logarithmic models predicted the same dependent variables found by the linear models, besides the numbers of accidents caused by specific types of accidents whether they are collisions, turnover or pedestrians’ accidents. The predicted dependent variables were numbers of accidents, fatalities, injuries and severities for each type of accidents. In the logarithmic models, the most contributing independent variables were:
1. Geometric factors: Average degree of curvature, number of vertical curves, width of one way of the road and number and types of pedestrian crossings. 2. Drivers’ behavioral factors: Average running
speed.
3. Environmental factors: Surface type, lighting condition and day/night.
4. Traffic conditions: Traffic volume (ADT) and percentages of different vehicles.
The logarithmic models show less number of independent variables; i.e., an indication of practicality and ease-of-use of the models. The minimum number of variables may be the reason behind the perfect prediction models. However, the models didn’t use the width of the road; neither its number of lanes nor median width. The models used the average degree of curvature as indicator for the number of horizontal curves and the maximum degree of curvature. They also used the average running speed as indicator for the posted speed. The models are also more realistic and practical by predicting the types of accidents and their associated influencing independent variables.
Most of the developed models lack of traffic variables because variations between Average Daily Traffic (ADT) for the studied roads were not that much and the focus of study was on the other variables of accidents’ causes.
The prediction of the dependent variables could open the door for engineers and roadway designers to enhance their roadway geometric design by minimizing the predicted numbers of accidents, injuries and fatalities. This could be considered as a new methodology to connect roadway design procedures with traffic safety factors or indicators without including the sight distance directly in geometric design. The new methodology could overcome safety problems associated with hazardous locations and eliminate their effects.
CONCLUSIONS
Road accidents in Jordan represent a major social and economic problem that causes a lot of losses in lives and injuries. A new approach was used to tackle the traffic safety issues in urban roads. The approach used stepwise regression statistical analysis concepts besides traffic accidents contributing factors in order to check urban roadway design efficiency as far as safety is concerned during early design stages. Logarithmic
and linear statistical models could efficiently and practically predict the expected numbers of accidents, injuries, fatalities and their associated types as functions of numerous independent variables. It was found that the most important contributing factors to traffic safety issues at urban roads were geometrical, behavioral, traffic condition and environmental factors. The most contributing factors to accidents at hazardous locations on urban roads were speed, degree of curvature, road surface type, traffic properties, number of horizontal and vertical curves, lighting conditions, as well as roadway geometry and dimensions.
City planners, traffic engineers as well as roadway
designers could use the findings of this research work to assure safe planning and geometrical design of new roads at early planning and design stages. Therefore, problems which arise due to traffic safety issues at expected hazardous locations could be controlled.
Of course, road safety works form a complex issue and involve several sectors, which require a multi-disciplinary approach to tackle the problems in order to achieve more practical results. The findings of this study could be enhanced if the data base incorporated with drivers’ characteristics includes socio-economic data and accurate locations of traffic accidents and hazardous locations.
REFERENCES
AASHTO. 2004. A Policy of Geometric Design of Highways and Streets, American Association of State Highway and Transportation Officials (AASHTO), Washington, D.C.
Al-Khateeb, Ghazi, Obaidat, Mohammed Taleband Taiser Khedaywi. 2008. Pedestrian and Driving Behaviors and Traffic Systems Issues in Jordan. Fifth Traffic Safety Conference in Jordan, organized by Jordanian Traffic Institute, Public Security Directorate, Amman-Jordan, April 22-24, 1-2 to 15-2.
Bener, A. 2005. The Neglected Epidemic: Road Traffic Accidents in a Developing Country, State of Qatar, International Journal of Injury Control and Safety Promotion, 12 (1), March 2005, 45-47.
CDOT. 2006. Standard Plans-M. and S Standards, Colorado Department of Transportation.
George, D. and Mallery, P. 2009. SPSS for Windows Step-by-Step: A Simple Guide and Reference 16.0 Update, Ninth Edition, Publisher: Allyn and Bacon, 386 pages. Hong, S. and Oguchie, T. 2005. Evaluation of Highway
Geometric Design and Analysis of Actual Operating Speed. Journal of the Eastern Asia Society for Transportation Studies, 6: 1048-1061.
Jordan Traffic Institute Report. 2008. Public Security
Directory, Ministry of Interior, Amman, Jordan. Khedaywi, Taiser, Obaidat, Mohammed Taleb, Al-Khateeb,
Ghazi and Ramadan, Thanaa. 2008. Pedestrian Accidents: Causes and Solutions, Fifth Traffic Safety Conference in Jordan, organized by Jordanian Traffic Institute, Public Security Directorate, Amman-Jordan, April 22-24, 1-10 to 15-10.
Khorshid, E. and Alfares, M. 2004. A Numerical Study on the Optimal Geometric Design of Speed Control Humps. Engineering Optimization, 36 (1), February, 77-100.
Loo, B. P. Y. 2009. The Identification of Hazardous Road Locations: A Comparison of the Blacksites and Hot Zone Methodologies in Hong Kong. International Journal of Sustainable Transportation, 3 (3), May, 187-202.
McCarthy, P. 2001. Effect of Speed Limits on Speed Distribution and Highway Safety: A Survey of Recent Literature. Transport Reviews, 21 (1), January, 31-50. Mungnimit, S. 2001. Road Traffic Accident Losses.
Transport and Communications Policy and Planning Bureau, Ministry of Transport and Communications, Thailand.
NCHRP. 2003. Geometric Design Consistency on High-Speed Rural Two-Lane Roadways, NCHRP Report 502, Transportation Research Board.
Obaidat, Mohammed Taleb, Al-Khateeb, Ghazi, Khedaywi, Taiser and Bannoura, Balkees. 2008. Evaluation of Drivers’ Behavioral Mistakes In Jordan. Fifth Traffic Safety Conference in Jordan, organized by Jordanian Traffic Institute, Public Security Directorate, Amman-Jordan, April 22-24, 1-6 to 14-6.
Traffic Safety Bureau, Department of Highways. 2005. Traffic Accidents on National Highways.
TRIP. 2009. Future Mobility in West Virginia: Meeting the State’s Need for Safe and Efficient Mobility, U.S. Department of Transportation, Washington, D.C.; www.tripnet.org.
U. S. Department of Transportation. 2003. Federal Highway Administration, Manual on Uniform Traffic Control Devices for Streets and Highways (MUTCD), Washington, D.C.