Comparative Study of Chatter Detection Methods for
High-Speed Micromilling of Ti6Al4V
Kundan K. Singh, Ramesh Singh* and V. Kartik
Department of Mechanical Engineering, Indian Institute of Technology Bombay, Powai, Mumbai, India
[email protected], [email protected], [email protected]
Abstract
Chatter detection is necessary to carry out stable machining. It is extremely critical in high speed micromilling (spindle speeds >100,000 rpm) where the limited tool stiffness and small fluctuations in the cutting forces can lead to dynamic instability. Chatter can deteriorate the surface finish and is detrimental to the tool as well. Hence, chatter identification is important to obtain stable cutting parameters. This chatter free process parameters can be identified by carrying out experiments at different machining conditions. Chatter detection can be accomplished via in-process real time techniques based on force and displacement signals or off-line machined surface characterization. It may be noted that micromilling process uses a miniature end mill whose natural frequencies corresponding to higher modes can be as high as 10 KHz. Consequently, the sensor bandwidth should be sufficient to detect high chatter frequencies in high speed micromilling. The conventional way of detecting chatter via force sensor may not be applicable in high speed micromilling due to its limited bandwidth. The displacement sensors can also have issues with proper placement and the noise. The chatter surface identification is relatively easy via visual inspection of the surface topography but quantitatively specifying a surface parameter which captures chatter is challenging. To address the issues of chatter identification in high speed micromilling, three different experimental techniques have been studied for chatter characterization. Four different experimental conditions (two stable and two unstable processing conditions based on visual surface inspection of scanning electron micrographs) have been characterized by all three methods and a comparative assessment of different chatter detection techniques has been carried out in high speed micromilling of Ti6Al4V. It has been observed that force sensor is unable to identify the chatter and the displacement sensor is noisy but can be used to determine chatter under certain conditions. However, average power spectral density (APSD) obtained from the surface topography can clearly identify chatter. A critical average power spectral density has been identified for the determination of the onset of chatter.
Keywords: Chatter, Micromilling, Displacement sensor, Surface topography, PSD
Volume 1, 2015, Pages 593–606
43rd Proceedings of the North American Manufacturing Research Institution of SME http://www.sme.org/namrc
1 Introduction
Complex 3D micro-scale features can be easily fabricated by micromachining processes in a wide range of engineering materials, like brass, aluminium, and titanium alloy (Jin and Altintas, 2013). Micromilling is a material removal process, which has various industrial applications in the areas of defence, consumer electronics, bio-medical devices and space-flight instruments (Miao et al., 2007). However, the limited stiffness of the micro-end mill makes it susceptible to dynamic instability due to its inability to sustain the fluctuation in load. The micro-tool has lower flexural stiffness than the conventional milling tool and even a small variation in force can induce deflections. The deviation of the cutting forces from the steady state can lead to the onset of dynamic instability and chatter, which can result in poor surface finish and even catastrophic tool failure. One way to counter the limited stiffness of the tool is to reduce the uncut chip thickness. Chip thickness can be reduced by using very high spindle rotational speeds (> 100,000 rpm). As a result, the peripheral cutting velocities can be very high.
Self-excited vibration, which occurs due to interaction between the tool and the workpiece known as regenerative chatter is main obstacles to productivity and part quality (Quintana and Ciurana, 2011). This regenerative vibration occurs due to variation in the chip thickness at present and previous cut, known as regeneration of the waviness of the workpiece surface (Quintana and Ciurana, 2011; Graham et al., 2014). Other types of vibration such as free and forced vibration can be reduced or eliminated by altering the design. But, self- excited vibration is more complex because they grow from the extraction of energy due to interaction between the tool and workpiece (Lamraoui et al., 2014). The increase in chip thickness and dynamic instable close loop cutting process leads to increase in cutting forces; severe tool vibration and tool wear (Jin and Altintas, 2013). Hence, the machining needs to be performed in stable domain for better surface quality and higher tool life. Unstable machining process hampers productivity and quality due to excessive wear/catastrophic failure of the tool and poor surface quality which are aggravated in micromachining processes, such as micromilling. Note that stable machining can be done either by changing the process parameter through online detection of the chatter or by selection of stable process parameters via a stability lobe diagram prior to machining.
Several sensors (dynamometer, accelerometers, acoustic emission and/or electrical power sensors) have been used for chatter detection in milling (Delio et al., 1992). Researchers have extensively used the force dynamometer for identification of chatter in milling. Afazov et al. (2013) analyzed the effects of micromilling cutting condition on the cutting forces and process stability. They used the dynamometer to capture the dynamics of the process for stability analysis. The maximum speed reported in their work was 100000 rpm. They identified the chatter, where the magnitudes of the FFT force at the tool natural frequency were relatively high. However, some of the other studies suggest that the traditional way of chatter detection via force dynamometer may not be effective in the high speed micromilling due to its limited frequency bandwidth. Because of high rotational speed, interaction time is very small and the frequencies corresponding to higher-order modes for the miniature end mill can reach 10 KHz which is difficult to be captured via dynamometer having limited bandwidth (Malekian et al., 2009).
Dynamics of low immersion, low feed and high-speed micromilling operation cannot be detected by the force sensor due to short interaction times but can be captured via displacement sensors (Delio et al., 1992). Other vibration sensors like acoustic, accelerometer, microphone etc. yields noisy data, consequently, filtering is required to extract the vibration signature (Huynh and Desai, 1993). Chatter pattern is mainly recognized either by spectral analysis of acquired signal or by wavelet decomposition of the signal. Acoustic sensor has been extensively used for chatter characterization in micromilling (Malekian et al., 2009). Characterization of machining dynamics by different sensors
depends on the placement of sensor relative to machining process. Placement of these sensors directly or very near to tool or workpiece system allows the direct measurement of the system dynamics. But the formation of chip and the action of the cutting edge make the placement of sensor extremely difficult. In comparison, remote placement of the sensors, at a certain distance from the cutting process and obstacles in the signal path results in the distortion of the signal (Delio et al., 1992).
One way to address these issues is analysis of the machined surfaces. The characterization of the unevenness of the machined surface topography can give the clear indication of the chatter. Zhang et al. (2012) analyzed the dynamics of aerostatic bearing spindle by power spectral density analysis of machine surface topography at different depth of cut and spindle speed in ultra-precision machining. Moon and Sutherland (1994) observed that the dynamics of cutting process have a detrimental effect on the surface profile height and the effect is prominent at lower spatial frequencies. Other studies (Huynh and Desai, 1993; Cheung and Lee, 2012) also highlighted the importance of spectral analysis of machined surface for detection of machining process instability.
Based on the literature review, it is evident that there are issues with different chatter detection techniques, specifically, in high-speed micromachining. Consequently, this paper is focused on comparative assessment of different chatter detection techniques in high-speed micromilling of Ti6Al4V for under different machining conditions. Present study compares real-time and off-line techniques for chatter detection in high-speed micromilling that can be extended to other high-speed machining processes. In addition, a critical/threshold power spectral density has been identified for the determination of the onset of chatter. In order to identify chatter from the vibration signatures obtained from the force and displacement sensors, the tool-tip dynamics need to be determined. The real-time signal acquired from the force sensor has been used for chatter detection in high-speed micromilling process. It has been reported that the force sensor has limited bandwidth and high frequency (>2000 Hz) data acquisition may be an issue. Hence, a laser displacement sensor has been used to obtain vibration signature. The off-line technique of chatter detection based on average power spectral density (APSD) of the machined surface topography has also been used. The power spectral density is expected to capture chatter and provide a quantitative assessment tool for determining chatter. Finally, a comparison matrix has been created listing the pros and cons of different chatter detection techniques in high-speed micromilling.
2 Experimental work
2.1 Experimental Setup
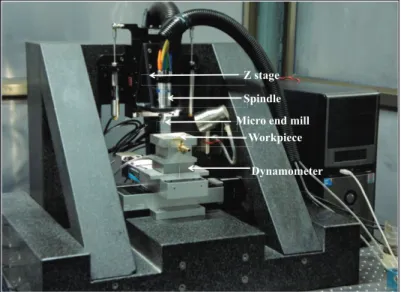
Experiments for the dynamic characterization have been carried out on a high speed micromachining center developed in the Machine Tools Lab at IIT Bombay. The high-speed spindle has a ceramic bearing with a maximum speed of 140000 rpm and average torque of~4.3 N-cm. It is driven by AC synchronous electric motor having a variable frequency drive. The 3-axis micromachining centre has stacked x-y stages having a ball screw driven by a DC brushless servomotor. The x-y stages have a positioning resolution of 0.5 μm and an accuracy of ±1 μm. The z–
stage is a pneumatically counterbalanced with linear motor stage having a positioning resolution of 5 nm. The micromachining centre is placed on a vibration isolation table. The set-up is shown in Fig. 1. Two-flute uncoated tungsten carbide cutting tools of 500 μm in diameter have been used in the experiments. Slot milling operations have been carried out on Ti6Al4Vfor different depth of cuts and spindle speeds. Cutting forces have been measured using a three directional Kistler dynamometer (Minidyne 9256C1) connected to a data acquisition (NI-DAQ) system.
2.2 Experimental conditions
For the analysis of stability of micro milling process, several slot cutting is done by micro milling on a block of Titanium Ti6Al4V of size 60 mm × 40 mm × 0.4 mm. The workpiece was mounted on the aluminium fixture which was fixed on dynamometer table. All the tests are achieved with two-flute uncoated tungsten carbide micro end mill of 500 μm diameter (made by Axis Microtools). Overhang length of the tool was kept at 24 mm for the entire test. Machining is carried out at different spindle speeds ranging from 30000 rpm to 100000 rpm with axial depths of cut varying from 10 μm to 300 μm at a feed of 3μm/flute.
3 Tool tip dynamics
Micromilling process uses the miniature tool having diameter range 20 μm to 1000 μm. Hence, modal parameters at the tool tip cannot be determined by applying the impulse load at the tip of tool. Tool-tip dynamics for stationary tool can be used to predict the process stability with reasonable accuracy. Hence, in the present work, natural frequency of the tool is determined by applying the impulse load close to fluted portion and by measuring the response at the tip of the tool. The arrangement is shown in Fig. 2. The frequency response function (FRF) of the tool-holder-spindle assembly is obtained by
ܩ௫௫ሺ߱ሻ ൌ ሺఠሻ
ிሺఠሻ (1) where ܺሺ߱ሻ is the measured response in the frequency domain and ܨሺ߱ሻis the impulse load applied on the tool.
Impulse load has been imparted by miniature impulse hammer (PCB, model 086E80) having sensitivity 22.5mV/N and the corresponding displacement at the tip is measured by the laser displacement sensor (micro epsilon, LD 1607) having sensitivity 250μm/10V and spot diameter 0.1 mm. Phase delay can give the incorrect frequency response function (Ganguly and Schmitz, 2014).
Z stage Spindle Micro end mill
Dynamometer Workpiece
Hence, displacement and impact force signals are measured simultaneously by NI 4474 dynamic signal conditioner at same sampling frequency to avoid the phase delay between them.
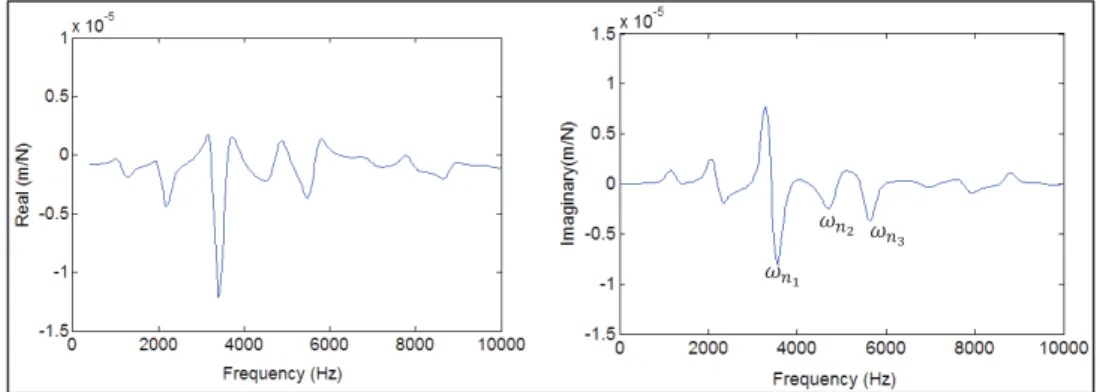
The imaginary parts of the frequency response function for tip dynamics are shown in Fig. 3. The dominant modes have been observed at 3574 Hz (ɘ୬ǡଵሻ, 4707 Hz (ɘ୬ǡଶሻ and 5645 Hz (ɘ୬ǡଷሻwhich correspond to the three lowest points having negative values in the imaginary part of the FRF (see Fig. 3(b)). The modes of the micro end mill with machine tool system compliance are shown in Table 1. These natural frequencies are required to detect the chatter in FFT plot of cutting dynamics.
Mode ω(Hz)
1 3574
2 4707
3 5645
Table 1: Tool tip dynamics
Impulse hammer Laser sensor
Figure 2: Experimental modal analysis set-up
Figure 3: Frequency response function of the tool with machine tool compliance (a) Real part (b) imaginary part
4 Experimental chatter detection techniques
Chatter can be detected either by using the different sensors but finally the visual inspection of the surface topography ascertains presence of chatter. Sensors can be used for online chatter detection during actual machining operation. Major shortcomings of some of these sensors are their limited bandwidth and presence of noise in their output. It is particularly true for high speed micromachining using a low-stiffness miniature end mill where modal frequencies can exceed 10,000 Hz. Consequently, sensor data may not be able to identify chatter under certain conditions. A good alternative to physical sensors is the extraction of different spectral information of the machined surface topography.
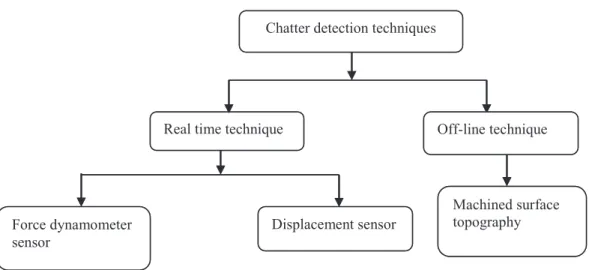
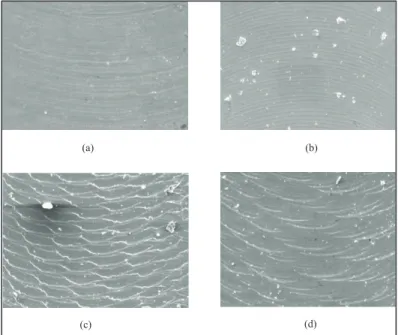
Fig. 4 shows the different techniques used for the chatter detection in this paper. Forces dynamometer lacks the adequate frequency bandwidth for chatter detection in micromilling operation because of the higher natural frequency of the micro end mill. The displacement sensor has issues with placement of the sensor near the tool to measure the vibration of the tool normal to the machining direction. In addition, the chatter detection using the average power spectral density of surface height of the micromilled surface has also been carried out. Cutting experiments were carried out at different process parameters. The surface topography images of the machined surface for two stable and two unstable conditions obtained from scanning electron microscope (SEM) are shown in Fig. 5. Sensor and surface data for these machining conditions have been used to evaluate different chatter detection techniques to see if they can identify chatter signature unambiguously.
analysis Chatter detection techniques
Force dynamometer sensor
Displacement sensor Real time technique
Machined surface topography Off-line technique
4.1 Chatter detection via force sensor
Force dynamometer is extensively used for chatter detection in milling process. However as mentioned previously, the limited bandwidth of the dynamometer may make it unsuitable for chatter detection in high-speed micromachining. In the present work, dynamometer (Kistler MiniDyn 9256C1) has been used for dynamic characterization of process. This force dynamometer is having the four preloaded, three component force sensors incorporated between a titanium cover plate and two lateral plates which make protects it from external noise. This dynamometer having the resonant frequency of 5100 Hz but higher mode for micro end mill for micromilling exceeds 5100 Hz as shown in Fig. 3. The second and third mode frequencies are higher than the resonant frequency of the dynamometer.
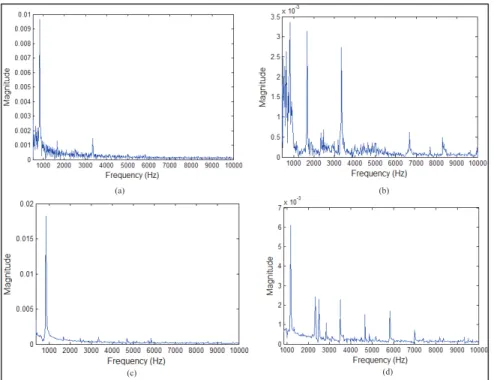
Stable spectrum is seen in force spectrum plot (Fast Fourier Transform of the force data) at 50000 rpm and 50 μm depth of cut and at 100000 rpm and 20 μm depth of cut as shown in Figs. 6(a) and 6(b), respectively. Fig. 6(a) shows the spindle rotational frequency 834 Hz and tooth passing frequency 1667 Hz and its harmonics for 50000 rpm and 50 μm depth of cut at 3 μm feed. Similarly, Fig. 6(b) shows the spindle rotational frequency 1667 and tooth passing frequency 3334 Hz and its harmonics for 10000 rpm. Note that the spindle rotational, tool passing and their harmonics are expected to be present in the force spectrum. There are no peaks beyond the frequency corresponding to the first or higher order modes which is a typical chatter signature indicating that the processes are stable (SEM micrographs in Fig. 5 corroborate the finding).
Fig. 6 (c) shows the spectrum of the cutting forces at a spindle rotation of 50000 rpm, 130 μm depth of cut and a feed of 3μm/flute. Force spectrum shows only the dominant spindle rotational frequency 834 Hz and tooth passing frequency 1667 Hz and its harmonics but the magnitude of tooth passing frequency and harmonics is very low. There are no disturbances near the natural frequencies
(a) (b)
(c) (d)
Figure 5: SEM image of machined surface for (a) 50000 rpm, 50 μm depth of cut and at feed of 3μm/flute, stable (b) 100000 rpm, 20 μm depth of cut and at feed of 3μm/flute, stable (c) 50000 rpm, 130 μm depth of cut and at feed of 3μm/flute, unstable (d) 70000 rpm, 150 μm depth of cut
of the tool, i.e., around 3574 Hz, 4707 Hz and 5645 Hz. Hence, the force spectrum identifies this process as stable even though there is clear evidence of chatter in the SEM image of the surface shown in Fig. 5(c). Based on this observation it can be construed that force spectrum obtained from the dynamometer is not a fool-proof method for identifying chatter.
Fig. 6(d) shows that the spindle frequency 1167 Hz, tooth passing frequency 2334 Hz and its harmonics are the only dominant, though there is peak near to primary mode of the tool at 3496 Hz. Further, this peak near to natural frequency having very low magnitude, hence stable machining. The misalignment effect gets amplified at higher rotational speeds which explains the higher magnitudes at tooth passing frequency in Figs. 6(b) and 6(d) which correspond to 100,000 and 70,000 rpm, respectively. However, the SEM image of the machined surface shown in Fig. 5(d) indicates the presence of chatter. Hence, force sensor is not a reliable source for chatter detection particularly for high speed micromilling operation.
4.2 Chatter detection via Displacement sensor
Chatter emanates from the vibration of workpiece, cutting tool, spindle, machine structure or combination of all these. The sensor should be capable of detecting vibration arising due to all these modes. The mounting of sensor relative to the structure plays a significant role in vibration detection. Direct placement of sensor on any components gives the reduction in amplitude of the vibration, hence, creates the transmissibility problem.
(a) (b)
(c) (d)
Figure 6: Force spectrum for (a) 50000 rpm, 50 μm depth of cut and at feed of 3μm/flute (b) 100000 rpm, 20 μm depth of cut and at feed of 3μm/flute (c) 50000 rpm, 130 μm depth of cut
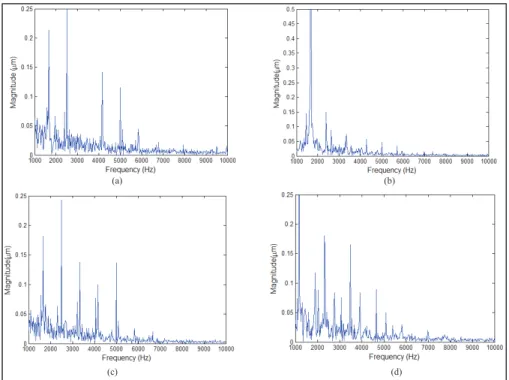
Fig. 7 shows the placement of laser displacement sensor relative to micro end mill. The vibration signature of micro end mill for stable machining conditions corresponding to the SEM micrographs shown in Figs. 5(a) and (b) are shown in Figs. 8 (a) and (b) respectively. The FFT (Fast Fourier transform) of the dynamic tool displacement data shown in Fig. 8 (a) for 50000 rpm shows peaks corresponding to the tooth passing frequency of 1667 Hz and the harmonics of the tooth passing frequency/spindle rotational frequency. No peaks are seen around the modal frequencies hence, stable machining is expected. Similarly, stable machining is observed from vibration spectrum at 100000 rpm (see Fig. 8(b), where only the spindle rotational frequency 1667 Hz and tooth passing frequency 3334 Hz and their harmonics are dominant indicating stable process).
(a) (b)
(c) (d)
Figure 8: Vibration signature for (a) 50000 rpm, 50 μm depth of cut and at feed of 3μm/flute, stable (b) 100000 rpm, 20 μm depth of cut and at feed of 3μm/flute, stable (c) 50000 rpm, 130 μm depth of cut and at feed of 3μm/flute, chatter (d) 70000 rpm, 150 μm depth of cut and at feed of 3μm/flute,
chatter
The vibration signature of micro end mill at a spindle speed of 50000 rpm, 130 μm depth of cut and 3
μm/flute feed is shown in Fig. 8 (c). A peak is observed at 3450 Hz which is near the 1st mode of the
tool vibration; hence, the process is rendered unstable. Similarly, a high magnitude in the spectrum is observed about 3396 Hz in Fig. 8(d) at 70000 rpm which is again undesirable as it does not correspond to either spindle or tooth passing frequencies or their harmonics. Real part of the frequency response function shown in Fig. 3(a) shows the negative amplitude at frequency 3450 Hz and 3396 Hz, hence both are chatter frequency. This clearly indicates that process is unstable. Based on these observations, it can be seen that the displacement sensor is better equipped to detect chatter as compared to force sensor.
4.3 Chatter detection via surface topography
Vibration and chatter marks are considered as the localized rough patches on the machined surface. Here machined surface profile has been scanned by white light interferometry (Wyko NT9100) to get the surface topography. Then, the roughness which is basically an array of irregular height has been converted into frequency domain after FFT. The FFT of the surface topography relates the power spectral density of the roughness parameters at different spatial frequency.
ሺୱሻ ൌ ՜ஶቈ ଶ ୰ ୨ଶ౩ ై మ ିైమ ݀ݎ ଶ (2) where ୱ is the spatial frequency, ୰ is surface profile and L is the sampling length.
Chatter marks on the machined surface generally have larger amplitude at longer surface wavelengths or lower spatial frequency than the actual machining marks (Moon and Sutherland, 1994). Average power spectral density (APSD) plot indicates the waviness of the surface profile due to the displacement of tool relative to workpiece at any spatial wavelength. Higher magnitude of APSD at a smaller spatial frequency (higher spatial wavelength) indicates high amplitude of the wavy surface at the harmonics of feed wavelength. APSD plot shows the peak amplitude at lower spatial frequency, which is generated due to dynamic cutting. Since, the sampling frequency of displacement data is 20 KHz so the Nyquist frequency is 10 KHz during the machining experiments. Also, one revolution of tool captures the feed of the workpiece, which gives the wavelength (spatial frequency) of generated surface. Hence, it is required to convert time frequency into spatial frequency by Eq. (3) (Moon and Sutherland, 1994)
ሺୱሻ ൌ
୧୫ୣ୰ୣ୯୳ୣ୬ୡ୷ሺሻ
ଶכ୷୯୳୧ୱ୲୰ୣ୯୳ୣ୬ୡ୷כୣୣୢሺ౪ሻ (3)
where is the time frequency or tooth passing frequency and its harmonics. ୲ is the feed in mm/rev.
Further, surface waviness is generated because of phase shift of the vibration due to one revolution of the cutter which is given by ൌ ʹɎԖ , where Ԗ is the decimal fraction lies in the range -0.5 to 0.5. Since the vibration frequency is a function of phase shift (Cheung and Lee, 2000), the spatial frequency will also be function of . Hence, vibration frequency ୱ୵ is given by,
െሺͲǤͷ ൈ ʹɎሻ ൈ ୱ ୱ୵ ሺͲǤͷ ൈ ʹɎሻ ൈ ୱ (4)
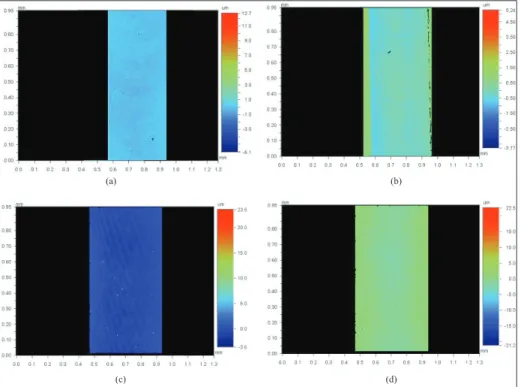
Surface profile and PSD plot for machined surface at a spindle rotation of 50000 rpm, 50 μm depth of cut and 3 μm/flute feed are shown in Figs. 9(a) and 10, respectively. The magnitude of APSD is relatively low indicating little power at high wavelengths or low spatial frequencies and hence stable machining. Chatter free machining is also observed from the APSD plot at 100,000 rpm, 20 μm depth of cut and 3 μm feed shown by Figs. 9(b) and 10, where the spectral density is of the order of 3000
mm nm2. The surface profile and APSD plot of the machined surface at 50,000 rpm and 130 μm depth
of cut is shown in Fig. 9(c) and 10, respectively.
Based on Eq. (4), the vibration frequency for 50000 rpm and 3 μm/flute feed should lie between -8.33/mm to -8.33/mm. It can be seen in Fig. 10, that peak is dominant at 2.56 /mm spatial frequency, which is the vibration frequency. Accordingly, a criterion has been defined that if the magnitude of APSD is more than 5000 mm nm2 then it is assumed as the chatter effect. This criterion emerges from multiple experiments presented in Table 2 (detailed description later). As spatial frequency is inverse of the wavelength of the surface profile and this wavelength is given by:
ߣ ൌ
(5) where v is the cutting speed and f is chatter frequency. As chatter frequency starts from the natural frequency of the tool (3574 Hz), hence, the wavelength of surface profile for 50,000 rpm (v=~78 m/min) is 0.36 mm and the corresponding spatial frequency will be 2.77 /mm. Fig. 10, clearly shows the significant magnitude around the vibrating spatial frequency 2.77 /mm. Similarly, chatter is identified at 70000 rpm and 150 μm depth of cut as shown in Fig. 10 and from surface profile (Fig. 9 (d)). It shows the dominant APSD at a spatial frequency of 3.96 /mm.
(b)
(c) (d)
(a)
Figure 9: Milled surface image for (a) 50000 rpm, 50 μm depth of cut and at feed of 3μm/flute, stable (b) 100000 rpm and 20 μm depth of cut and at feed of 3μm/flute, stable (c) 50000 rpm, 130 μm depth of cut and at feed of 3μm/flute, chatter (b) 70000 rpm, 150 μm depth of cut and
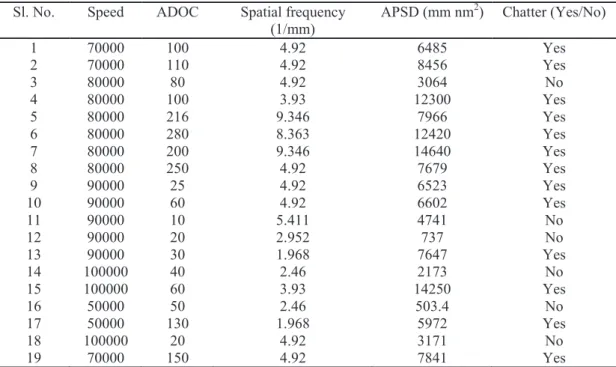
Sl. No. Speed ADOC Spatial frequency (1/mm) APSD (mm nm 2) Chatter (Yes/No) 1 70000 100 4.92 6485 Yes 2 70000 110 4.92 8456 Yes 3 80000 80 4.92 3064 No 4 80000 100 3.93 12300 Yes 5 80000 216 9.346 7966 Yes 6 80000 280 8.363 12420 Yes 7 80000 200 9.346 14640 Yes 8 80000 250 4.92 7679 Yes 9 90000 25 4.92 6523 Yes 10 90000 60 4.92 6602 Yes 11 90000 10 5.411 4741 No 12 90000 20 2.952 737 No 13 90000 30 1.968 7647 Yes 14 100000 40 2.46 2173 No 15 100000 60 3.93 14250 Yes 16 50000 50 2.46 503.4 No 17 50000 130 1.968 5972 Yes 18 100000 20 4.92 3171 No 19 70000 150 4.92 7841 Yes
Table 2: Condition of chatter at different process parameters
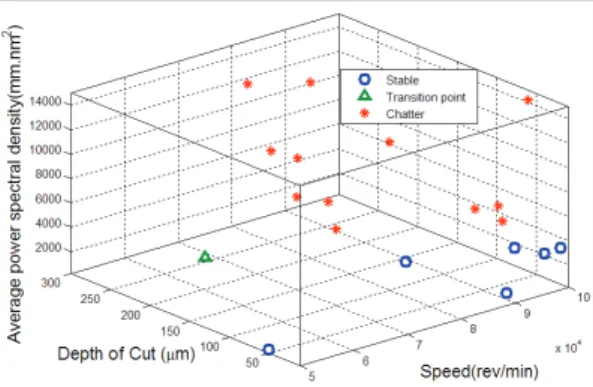
Table 2 shows the machining conditions for identifying a criterion for the onset of chatter. The spatial frequencies at which chatter is likely to occur can be determined via Eqs. (4) and (5) but that does not tell us that if the chatter will occur under a given condition. To ascertain the limit of chatter about 15 experiments under different conditions were carried out as shown in Table 2. Table 2 shows the spatial frequencies and the magnitude of APSD under different conditions along with visual evidence of chatter. Fig. 11 shows clear demarcation between the APSD magnitudes of the stable and unstable
Figure 10: APSD of machined surface for different speed and axial depth of cut (ADOC) at feed of 3μm/flute
machining conditions extracted from Table 2. It can be clearly seen that 5000 mm.nm2 appears to be
the value at which the onset of chatter is observed.
5 Comparative assessments remarks
Different chatter detection techniques like force dynamometer, displacement sensor and surface topography has been analyzed for identification of chatter in high speed micromilling of the Ti-alloy. It is observed that force dynamometer lacks the adequate frequency bandwidth for chatter detection in high speed micromilling operations. Displacement sensor has the frequency range up to 10 kHz and can be used for chatter detection effectively in high-speed micromachining but high noise and faulty placement can distort the signal. Hence, best way to detect chatter is by surface topography characterization of the machined surface via APSD which can clearly capture the chatter onset and severity. A comparative assessment of chatter identification techniques used in the present work is shown in Table 3.
Method Features Limitations
Force sensor Detects the dynamics accurately below the
5000 Hz, hence suitable for low frequency operation
Limited bandwidth for operation like high-speed micromilling
Displacement sensor
High frequency operations range, online chatter detection
High noise in the signal; distorted signal due to improper placement with respect to machining zone. Surface topography based on actual machined surface; hence,
accurately captures the chatter
Offline technique and real-time implementation is challenging; determination of critical value of average power spectral density based on a set of wide range of experiments
Table 3: Comparison of different chatter detection techniques
6 Conclusions
Chatter prediction in high-speed micromilling is a challenging task due to presence of higher frequency modes. In the present work, it has been shown that chatter can go undetected by the data acquired from the force dynamometer. To derive a robust technique for chatter identification a comparative study has been carried out via different techniques in high-speed micromilling. Following conclusions can be drawn from this work:
x Force dynamometer is not able to capture chatter signal in high-speed micromachining if the modal frequencies are higher than 3574 Hz.
x The displacement sensor is capable of chatter detection in high-speed micromilling of Ti-6Al-4V.
x The spatial frequency corresponding to chatter depends on the modal frequency and the cutting speed.
x For the high-speed micromachining of Ti- alloy, the chatter onset corresponds to PSD magnitude of 5000 mm.nm2. If the machined surface topography yields a PSD value exceeding this critical value, it is found to be unstable.
References
Afazov SM., Zdebski D, Ratchev SM, Segal J and Liu S. Effects of micro-milling conditions on the cutting forces and process stability.Journal of Materials Processing Tech 2013; 213(5); 671-684. Cheung CF and Lee WB. A multi-spectrum analysis of surface roughness formation in ultra-precision
machining.Precision Engineering 2000;24(1); 77-87.
Delio T, Tlusty J and Smith S. Use of audio signals for chatter detection and control.Journal of Manufacturing Science and Engineering 1992; 114(2); 146-157.
Ganguly V and Schmitz TL. Phase correction for frequency response function measurements. Precision Engineering 201; 38(2); 409-413.
Graham E, Mehrpouya M, Nagamune R and Park SS. Robust prediction of chatter stability in micro milling comparing edge theorem and LMI. CIRP Journal of Manufacturing Science and Technology 2014; 7(1); 29-39
Huynh VM and Desai S. An Optical Method for Chatter and Form Error Detection in Grinding. Canadian Acoustics 1993;21(3); 95-96.
Jin X and Altintas Y. Chatter stability model of micro-milling with process damping. Journal of manufacturing science and engineering 2013; 135(3); 031011.
Lamraoui M, Thomas M, El Badaoui M and Girardin F. Indicators for monitoring chatter in milling based on instantaneous angular speeds. Mechanical Systems and Signal Processing 2014;44(1); 72-85.
Malekian M, Park SS and Jun MB. Modeling of dynamic micro-milling cutting forces. International Journal of Machine Tools and Manufacture 2009; 49(7); 586-598.
Miao JC, Chen GL, Lai XM, Li HT and Li CF. Review of dynamic issue in micro-end milling. The International Journal of Advanced Manufacturing Technology 2007; 31(9-10); 897-904.
Moon KS and Sutherland JW. The origin and interpretation of spatial frequencies in a turned surface profile. Journal of Manufacturing Science and Engineering 1994;116(3); 340-347.
Quintana G and Ciurana J. Chatter in machining processes: a review. International Journal of Machine Tools and Manufacture 2011; 51(5); 363-376.