Comparison of microwave and optical cloud water path estimates
from TMI, MODIS, and MISR
A´ kos Horva´th1,2and Roger Davies1,3
Received 20 January 2006; revised 11 July 2006; accepted 7 September 2006; published 9 January 2007.
[1] This study investigated the consistency between microwave and optical water path
estimates of oceanic clouds from Tropical Rainfall Measurement Mission (TRMM) Microwave Imager (TMI), Moderate Resolution Imaging Spectroradiometer (MODIS), and Multiangle Imaging Spectroradiometer (MISR). We used microwave estimates from the Wentz algorithm for warm, nonprecipitating clouds and both Wentz retrievals and standard TMI profiles for cold, precipitating clouds. Optical estimates were derived from cloud optical thickness and particle effective radius. For warm, nonprecipitating clouds the two methods showed good agreement at the 25-km resolution of the microwave
measurements, with liquid water path means being within 5– 10%, an overall correlation of 0.85, and RMS difference of25 g m2. Multiangle optical retrievals showed only weak variations with view zenith angle, building further confidence in the results. An error analysis suggested that optical estimates were more certain than microwave ones, primarily because 1-D plane-parallel radiative transfer seemed to apply well at the coarser comparison scales. However, there appeared to be a slight but systematic dependence on cloud amount as microwave retrievals increasingly overestimated optical ones at cloud fractions below 65%. For cold, precipitating clouds we tested three common
interpretations of optical retrievals: liquid water path, ice water path, and total water path. The relationship between microwave and optical estimates was weak in all cases, with correlations no more than 0.5, and RMS differences at least an order of magnitude larger than for warm clouds. The weakest correlation (0.37) was found when optical retrievals were interpreted as ice water paths. If anything, optical estimates appeared best correlated with microwave cloud liquid water paths.
Citation: Horva´th, A´ ., and R. Davies (2007), Comparison of microwave and optical cloud water path estimates from TMI, MODIS, and MISR,J. Geophys. Res.,112, D01202, doi:10.1029/2006JD007101.
1. Introduction
[2] Cloud water is an important geophysical quantity forming a crucial link between hydrological and radiative properties of the climate system. Clouds can contain hydro-meteors of various sizes and phases, from the large precip-itation-sized to smaller cloud particles, in either liquid or ice phase. This study focuses on cloud water contained in nonprecipitating hydrometeor species with emphasis on warm, nonprecipitating clouds, but also touching upon cold, precipitating clouds.
[3] Knowledge about liquid and ice cloud condensate is crucial from a modeling standpoint. For instance, in climate model intercomparisons large differences in simulated net cloud radiative feedback have been found to be directly
related to differences in the amount of cloud liquid water produced by the models [e.g., Cess et al., 1996]. Further-more, Vavrus [2004] has concluded that basing cloud fraction on cloud water content rather than relative humid-ity, and accounting for the impact of differential fallout rates of frozen and liquid condensate on cloud concentration, are essential for realistically simulating the annual cycle of Arctic cloudiness. Finally,Clement and Soden[2005] have shown that the tropical-mean radiation budget can be quite sensitive to precipitation efficiency, better estimates of which require improved knowledge of the amount of cloud water relative to precipitating water. Such modeling work would no doubt benefit from accurate cloud water path retrievals; however, such retrievals are still problematic, especially for cold, precipitating clouds.
[4] Currently available passive satellite remote sensors retrieve column integrated liquid water content (liquid water path) from two different methods. The microwave approach, usually limited to oceanic areas but applicable day or night, infers liquid water path (LWP) from brightness temperatures measured at several frequencies, after first removing the influence of surface emissivity and water vapor absorption. The optical method, applicable over both land and ocean but for
Full Article
1Jet Propulsion Laboratory, California Institute of Technology,
Pasadena, California, USA.
2Now at Rosenstiel School of Marine and Atmospheric Science,
University of Miami, Miami, Florida, USA.
3Now at Department of Physics, University of Auckland, Auckland,
New Zealand.
Copyright 2007 by the American Geophysical Union. 0148-0227/07/2006JD007101$09.00
during daytime only, infers liquid water path from cloud optical thickness and cloud droplet effective radius, the directly retrieved quantities in this approach. Optical thickness and droplet effective radius are, in turn, inferred from simultaneous solar reflectance measurements at a nonabsorbing visible and a water-absorbing near-infrared wavelength.
[5] Microwave and optical techniques represent fully independent approaches, but because both techniques rely on simplified models of the geometric or microphysical structure of clouds to obtain their retrievals, comparisons are still needed to examine their respective error character-istics. However, only a few such studies have been published to date. Lojou et al. [1991] compared liquid water path estimates derived from Nimbus-7 Scanning Multichannel Microwave Radiometer (SMMR) and Geo-stationary Operational Environmental Satellite 1 (GOES 1) Visible and Infrared Spin-Scan Radiometer (VISSR) mea-surements over the Indian Ocean. They found satisfactory agreement between the methods, with a correlation coeffi-cient of 0.83 and a root-mean-square (RMS) difference of 70 g m2. Greenwald et al. [1993] compared Special Sensor Microwave/Imager (SSM/I) and Advanced Very High Resolution Radiometer (AVHRR) retrievals in areas of nonprecipitating marine stratocumulus clouds off the California coast. They concluded that the two methods gave consistent results, with an RMS difference of 60 g m2 and a slight positive bias in microwave estimates.Lin and Rossow[1994] also found good consistency between SSM/I microwave and International Satellite Cloud Climatology Project (ISCCP) optical retrievals for warm, nonprecipitat-ing clouds. For cold and/or precipitatnonprecipitat-ing clouds, however, they found large differences between the two methods, which they attributed to the presence of ice and/or rain. Similar conclusions were reached by Lin and Rossow [1996] for nonprecipitating oceanic clouds in a later ISCCP-SSM/I comparison. Greenwald et al. [1997] com-pared liquid water path estimates obtained by SSM/I and GOES 8 imager for nonprecipitating marine stratocumulus clouds in the Eastern Pacific. Their microwave and optical techniques yielded average LWP values within 10 – 20% of one another with a typical correlation coefficient of 0.6 – 0.9 and RMS difference of 30 – 60 g m2. The study byWood et al. [2002] employed TRMM (Tropical Rainfall Measure-ment Mission) Microwave Imager and MODIS (Moderate Resolution Imaging Spectroradiometer) retrievals over the Northeastern Pacific. Their analysis of the average LWP of 1° 1° regions of warm, nonprecipitating marine clouds showed the two instruments agreeing within 10 g m2with an RMS difference of 17 g m2.
[6] The studies described above used data from instru-ments on different satellites. Masunaga et al. [2002b] employed microwave and optical sensors from the same platform, the TRMM satellite. In their study, liquid water path estimates from TRMM Microwave Imager (TMI) and Visible and Infrared Scanner (VIRS) were compared for low, warm, nonprecipitating clouds. They found that the correlation coefficient between the instruments was 0.62 for all clouds, and 0.91 for marine stratocumulus regions.Ho et al.[2003] also used TMI and VIRS in their comparison. For warm, nonprecipitating clouds their microwave and optical estimates showed a difference of less than 10 g m2 in
global means. For cold, nonprecipitating clouds, however, their microwave LWP estimates were only 25 – 30% of their optical retrievals. LikeLin and Rossow [1994], they inter-preted the difference as the amount of cloud ice.
[7] Taken together, these studies have established that there is good agreement between microwave and optical retrievals of liquid water path for low-water-content, warm, nonprecipitating clouds. The studies of Greenwald et al. [1997] andMasunaga et al. [2002b] have also underlined the importance of cloud fraction information within the microwave footprint in order to achieve a meaningful comparison. Specifically, either microwave measurements have to be scaled up because they are averages over entire footprints including clear areas, or optical retrievals have to be scaled down because they are limited to cloudy areas.
[8] Conversely, cold and/or precipitating clouds have been found to pose a much greater challenge for micro-wave-optical comparison. Microwave brightness temper-atures are sensitive to the total amount of liquid water (cloud plus rain) within an atmospheric column. Separation of the cloud component (i.e., small droplet mode) from the rain component (i.e., large drop mode) is difficult, usually requiring a priori assumptions. In addition, precipitation-sized particles scatter microwave radiation, a process which has to be included in retrieval models, especially at higher frequencies. Optical measurements, on the other hand, saturate over thicker, brighter clouds, resulting in truncation of optical thickness retrievals at typical values of50 – 100. In these clouds, an ice layer is usually present above the liquid layer. This makes interpretation of the retrieved optical thickness difficult, because the reflected signal is a mixture of contributions from liquid droplets and ice crys-tals. Furthermore, the retrieved droplet effective radius is characteristic of ice crystals at cloud top rather than of liquid droplets deeper in the cloud. To avoid these difficulties, previous microwave-optical comparisons have usually been limited to warm, nonprecipitating clouds. The few studies on cold clouds [e.g.,Lin and Rossow, 1994, 1996;Ho et al., 2003] have typically assumed that optical retrievals repre-sent the total water path (TWP), and that the difference between optical and microwave retrievals can be interpreted as ice water path (IWP).
[9] In this paper we report upon how we took advantage of the availability of improved optical measurements, spec-tral radiances from MODIS and multiangle radiances from the Multiangle Imaging Spectroradiometer (MISR), both aboard the Terra satellite, in order to extend the comparison of microwave and optical retrievals of cloud water. (The terms ‘‘cloud LWP,’’ ‘‘cloud IWP,’’ and ‘‘cloud TWP’’ henceforth refer to cloud water contained in liquid, ice, and all (liquid and ice) nonprecipitating hydrometeor spe-cies, respectively, with the contribution from precipitating species being explicitly ignored. The generic term cloud ‘‘water path’’ (WP) refers to either cloud LWP or cloud IWP.) In particular, we examined the interpretation of optical retrievals in cold, precipitating clouds, such as deep convective systems. Here, optical retrievals from Terra were compared against conventional microwave estimates from coincident passes of the TRMM satellite using both the Wentz algorithm [Wentz, 1997; Wentz and Spencer, 1998] and the standard TRMM profiling algorithm [Kummerow et al., 2001] on TMI data. We employed MODIS data because
they represent state-of-the-art 1-D retrievals of cloud optical thickness and cloud droplet radius [King et al., 1997], and multiangle MISR data because they allow evaluation of the consistency of these 1-D optical retrievals [Horva´th and Davies, 2004]. In the remainder of this paper, we describe our coincident, collocated microwave and optical data sets; explain the comparison methodology; present results for warm, nonprecipitating and cold, precipitating clouds, re-spectively; and discuss the significance of our findings in more detail.
2. Data
2.1. Microwave Measurements
[10] Our microwave measurements were obtained by the TMI nine-channel passive microwave radiometer aboard the TRMM satellite [Kummerow et al., 1998]. We used two sets of TMI retrievals representing different developmental his-tories. The first data set was obtained from the Wentz algorithm, originally developed for nonprecipitating oceanic clouds [Wentz, 1997], and later extended to include rain observations as well [Wentz and Spencer, 1998]. This unified, all-weather ocean algorithm simultaneously finds near-surface wind speed, columnar water vapor, columnar cloud liquid water, and rain rate by varying the values of these geophysical parameters in a radiative transfer model until simulated ocean brightness temperatures match obser-vations. The inversion uses a primarily emission-based scheme with some adjustments for scattering and relies on measurements from the 19.35-GHz, 21.3-GHz, and 37-GHz channels. The actual data used in this study were version 3a gridded maps with a pixel resolution of 0.25° (25 km) provided by Remote Sensing Systems.
[11] The second data set was composed of the standard 2A12 TMI hydrometeor profiles [Kummerow et al., 2001]. This algorithm uses all TMI channels to retrieve the rainfall rate and vertical structure of precipitating cloud systems. The 2A12 algorithm considers a total of four classes of hydrometeors and retrieves the amount of cloud liquid, cloud ice, precipitation liquid, and precipitation ice in 14 vertical layers. Water path values can then be calculated by integrating these profiles. Unlike the Wentz algorithm that provides retrievals in all clouds, the 2A12 algorithm only works in precipitating clouds. The characteristic feature of this profiling algorithm is that it relies on an a priori database of cloud-resolving model simulations and an improved treatment of microwave radiative transfer in the computation of brightness temperatures that are matched to TMI observations. The 2A12 version 5a data set was obtained from the TRMM Science Data and Information System (TSDIS) site and had a resolution of
5 km (at 85.5 GHz).
[12] The global rainfall distributions produced by the Wentz and 2A12 algorithms show structures similar to those in previously published rain climatologies. However, sig-nificant regional biases are known to exist between the Microwave Sounding Unit [Spencer, 1993] and Wentz rain rates, and between the 2A12 and TRMM precipitation radar products [Masunaga et al., 2002a], the resolution of which remains the focus of active research. The error character-istics of Wentz and 2A12 cloud water retrievals, especially in cold, precipitating clouds, are even less understood.
Nevertheless, we used these data in our cloud water study because we believe they still represent the current state of the art among microwave retrievals.
2.2. Optical Measurements
[13] Our optical estimates of cloud water were based upon 1-D plane-parallel retrievals of cloud optical thick-ness (t) and cloud particle effective radius (re). The principle of the technique is that solar reflectance in a nonabsorbing visible channel is primarily a function of optical thickness, while reflectance at water-absorbing near-infrared wavelengths depends upon cloud particle effective radius and optical thickness. When both wave-lengths are available, optical thickness and effective radius can be retrieved simultaneously [Nakajima and King, 1990]. When only visible reflectances are available, one has to assume an effective radius in order to retrieve optical thickness [Rossow and Schiffer, 1991]. Converting optical thickness to water path is by no means straightfor-ward and is prone to errors, particularly for cloud ice. However, if one uses a general definition of effective radius for both liquid and ice particles based upon the ratio of size distribution volume to projected area, then both liquid water path and ice water path can be estimated from the following well-known formula [Stephens, 1978]:
LWP or IWP¼4rtre
3Qe
: ð1Þ
Here, Qeis the extinction efficiency, which can be set to2 at visible wavelengths, andr=rw= 1 g cm3is the density of water or r = ri is the density of ice. (Ice density measurements show large variations. MODIS uses a value of ri = 0.93 g cm3.) The above expression assumes vertically uniform effective radius and treats the phase of cloud top as that of the entire column. Hence the resulting water path is usually labeled as either ‘‘liquid water path’’ or ‘‘ice water path,’’ depending on cloud top phase.
[14] In this study we used optical retrievals from two different instruments aboard the Terra satellite. The first data set was composed of cloud optical thickness, particle effective radius, and water path from the Collection 4 MOD06 product provided by the MODIS scanner [King et al., 1997]. These cloud top properties were given for both liquid and ice clouds on a 1-km scale. The second data set was composed of cloud optical thickness calculated sepa-rately for each view angle of the MISR instrument. (MISR measures reflected sunlight near-simultaneously with nine pushbroom sensors oriented at different angles along track [Diner et al., 2002]. The traditional nadir view is comple-mented by four pairs of oblique cameras positioned at nominal view zenith angles of 26.1°, 45.6°, 60.0°, and 70.5°, each pair consisting of one camera looking forward and one looking backward in relation to the direction of flight.) The standard lookup-table-based retrieval algorithm was similar to that of MODIS with the exception that a fixed value had to be assumed for droplet effective radius in the absence of water-absorbing MISR channels. We computed reflectances for a reof 5mm, 8mm, and 15mm and obtained optical thickness by interpolating or extrapolating from these calculations based on the actual MODIS effective radius value. MISR retrievals were limited to liquid clouds
only and had a resolution ranging from 214 m at nadir to 707 m at the most oblique angle with a sample spacing of 275 m at all angles. For algorithm details (ozone and Rayleigh corrections, parallax removal, coregistration, etc.) seeHorva´th[2004].
[15] In general, the MISR nadir camera and MODIS yielded similar optical thicknesses for thin or moderately thick water clouds. For clouds witht> 50, however, MISR retrieved significantly larger optical thicknesses than MODIS, primarily because of its higher calibration [Bruegge et al., 2002]. The3% MISR-MODIS calibration difference was substantially amplified for such thick clouds by the strongly nonlinear relationship between reflectance and optical thickness.
3. Comparison Methodology
[16] Because our microwave and optical sensors were on different satellites, some care had to be taken to ensure high temporal and spatial collocation of the data sets. We searched approximately 400 randomly downloaded MISR orbits for TRMM-Terra coincidences, selecting only those cases for analysis that were within 15 min with respect to the observation time of the MISR nadir camera. The 50 or so coincident cloudy scenes were predominantly from February 2004, July and August 2003, and April 2001. The solar zenith angle varied from 17 – 53°with most scenes falling into the 25 – 35°range.
[17] To facilitate the comparison of these coincident observations, TMI and MODIS data were first remapped to the common MISR grid via nearest-neighbor sampling using their corresponding geographic latitude and longitude values. Next, the high-resolution optical and 2A12 micro-wave retrievals were averaged down to the25 km scale of the Wentz data set. Finally, we had to account for the fact that optical LWPs were normalized by the cloud-covered area, while microwave measurements were normalized by the total (clear plus cloudy) area of a domain. A head-to-head comparison between such optical and microwave LWPs would have revealed a systematic low bias in the latter, the so-called ‘‘beam-filling error.’’ Greenwald et al. [1997] have shown that simple linear corrections based on the subdomain cloud fraction can largely eliminate beam-filling errors, at least in 37-GHz observations of water clouds. Therefore we renormalized the optical estimates via multiplication by the subdomain cloud fraction. For consistency we used the same cloud fractions, calculated from the 1-km cloud mask in the MOD06 product, for the renormalization of both MODIS and MISR retrievals.
[18] In order to investigate the potentially more problem-atic cold, precipitating clouds separately, we sorted our cloud scenes into the following two categories based upon microwave rainfall, MODIS cloud top phase, and MISR cloud top height data. The first group, totaling 22 scenes from 21 MISR orbits, consisted of low-water-content, warm, nonprecipitating clouds. Areas where TMI indicated the presence of rain or MODIS the presence of ice or mixed-phase droplets were excluded. Domain average Wentz LWPs did not exceed 300 g m2 for these scenes. The majority of clouds were marine St/Sc, trade Cu, or popcorn
Cu, but three scenes contained midlevel As/Ac clouds. Nevertheless, we called this category ‘‘boundary layer clouds’’ because of the predominance of shallow cloud types.
[19] The second group, totaling 24 scenes from 24 MISR orbits, consisted of high-water-content, precipitating clouds with ice at the top (i.e., cold rain). All areas were eliminated where MODIS indicated liquid droplets only. Simply scal-ing the optical estimates with cloud fraction would probably not have been valid for these thick clouds; however, this was not necessary in any case because all 25-km domains were overcast. For these clouds the domain average atmo-spheric LWP as determined by the Wentz algorithm was usually considerably larger than 300 g m2, often on the order of 1000 g m2. The separation of precipitating clouds from nonprecipitating ones at a threshold LWP of300 g m2 was related to assumptions about the onset of appreciable precipitation inherent in the Wentz algorithm. We called this category ‘‘cold precipitating clouds.’’
[20] Finally, we needed to estimate the magnitude and effect of possible sensor collocation errors due to cloud height and cloud motion. The TMI instrument has a view zenith angle of 53°, which could result in a parallax relative to the location of nadir-registered optical measure-ments. In addition, clouds could be advected by wind during the time difference between the TRMM and Terra satellites. To estimate these effects we used stereoscopic cloud height and cloud motion retrievals obtained by MISR [Horva´th and Davies, 2001].
[21] For boundary layer scenes, MISR retrievals indicated a typical cloud top height of 1 – 2 km, and a typical cloud motion wind of 5 – 15 m/s. These small cloud top heights resulted in negligible parallax no more than 0.1 Wentz domains. Cloud motion, on the other hand, could cause more significant collocation errors up to 0.5 domains. Most scenes, however, had an error much smaller than that. Nevertheless, we tested a cloud motion correction scheme and found that it had only a marginal effect on our results. [22] For cold, precipitating scenes, such as deep convec-tive cloud systems, it was more difficult to estimate parallax effects, because MISR cloud motion and height retrievals were much sparser; stereo matching between the nadir and most oblique views, which was required for motion retrieval, often failed because of lack of observable structure in the anvil cirrus at the top of such clouds. The few successful retrievals indicated cloud top heights between 8 km and 16 km, and wind speeds up to 30 m/s, each potentially resulting in large collocation errors up to 1 domain. How-ever, visually matching clear areas in MODIS/MISR imagery with low TMI LWP values rarely indicated collocation errors of such magnitude. This suggested partial cancella-tion between cloud height and cloud mocancella-tion effects, or the presence of other compensatory factors. As a final test, we investigated cold, precipitating scenes for which the time difference between TRMM and Terra was very small; hence only the height parallax was important. We found that applying a parallax correction based upon MISR stereo heights had only a small effect on the results. In light of the above findings, we concluded that collocation uncer-tainty due to cloud motion and height was not a major
limiting factor in our comparisons of 25 25 km2-area averages.
4. Results
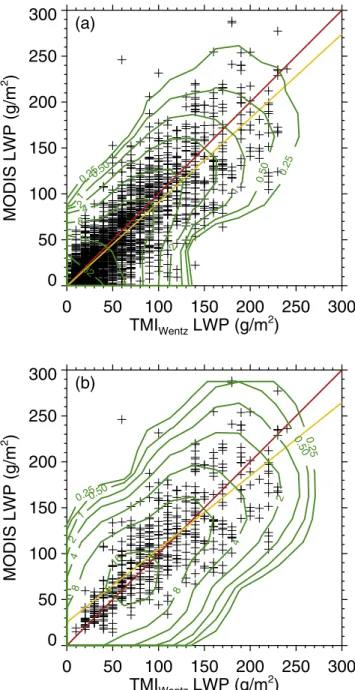
[23] The comparison between microwave and optical retrievals is shown in Figure 1 for all TRMM-Terra coin-cidences. In this and similar figures, each plus sign refers to a 2525-km2domain, while the red line corresponds to a 1:1 relationship. Figures 1a and 1b summarize the results for Wentz and 2A12 microwave data, respectively. Note that a bias offset was added to 2A12 data as explained in
section 4.3. For warm, nonprecipitating clouds only Wentz retrievals (black) were available; therefore this data set was common to both panels.
[24] As shown, the microwave and optical methods generally agreed well for warm, nonprecipitating clouds characterized by typical water path values no more than 250 – 300 g m2. For this cloud type, retrievals by both techniques could straightforwardly be interpreted as cloud liquid water path. Conversely, for cold, precipitating clouds, microwave and optical estimates started to seriously diverge. In this regime the comparison was complicated by the fact that MODIS retrievals could be interpreted (labeled) as cloud ice water path because of the presence of cloud top ice, while the Wentz algorithm attempted to estimate cloud liquid water path. Therefore comparing Wentz and MODIS retrievals for these clouds (green) might have been misleading. Arguably, it would have been more reasonable to compare optical retrievals with the standard TRMM profiling products, especially 2A12 cloud ice water path. However, as shown in Figure 1b, 2A12-MODIS comparisons did not yield an agreement any better than the Wentz-MODIS comparison regardless of whether MODIS estimates were compared with cloud liquid water path (blue), cloud ice water path (cyan), or cloud total water path (gold).
4.1. Boundary Layer (BL) Clouds
[25] Having sketched the general picture, let us now separately consider warm, nonprecipitating and cold, pre-cipitating cases in more detail. For warm, nonprepre-cipitating clouds, only the Wentz microwave data set was available. The comparison of Wentz LWP to MODIS LWP for all domains irrespective of cloud fraction is shown in Figure 2a. In this and similar figures, the gold line indicates a linear fit to the data, and green curves are relative density contours in arbitrary units. Note that in the Wentz data set, values were quantized to integer multiples of 10 g m2. Statistical summaries of this case (column BL 1) and all subsequent comparisons are given in Table 1. Results showed an average Wentz and MODIS LWP of 47 g m2 and 42 g m2, respectively, and an RMS difference between the data sets of 25 g m2, with a correlation coefficient of 0.85 (R2= 0.72).
[26] The overcast subset of the data above (20% of all domains) is plotted separately in Figure 2b. (See also column BL 2 in Table 1.) The Wentz algorithm and MODIS yielded a mean cloud LWP of 102 g m2 and 106 g m2, respectively. These values were in good agreement with ship-based microwave observations of marine Sc by Zuidema et al. [2005], and also compared well with the estimate ofPruppacher and Jaenicke[1995], who obtained a global (land plus ocean) mean cloud LWP of 100 g m2for St/Sc clouds.
[27] In sum, the mean Wentz LWP and MODIS LWP were consistent within 5 – 10% for boundary layer clouds. When all cloud fraction bins were considered, the Wentz average was higher than MODIS; however, the reverse was true for strictly overcast domains. The higher Wentz average in the ‘‘all’’ case was likely due to a positive bias in the microwave results over partially cloud-covered domains, which dominated the data set. For example, completely clear domains, as determined by the MODIS cloud mask, showed a positive Wentz LWP bias of 15 g m2, which then Figure 1. MODIS WP versus (a) TMIWentzand (b) TMI2A12
retrievals for all TRMM-Terra coincidences. Black corre-sponds to Wentz LWP for warm, nonprecipitating clouds, while green, blue, cyan, and gold refer to Wentz LWP, 2A12 LWP, 2A12 IWP, and 2A12 TWP, respectively, for cold, precipitating clouds. Note that 2A12 data were offset for a low LWP bias. The red line is the 1:1 line.
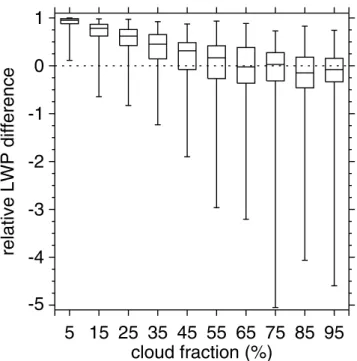
carried over to partially cloud-covered domains to a some-what lesser extent. This explanation was supported by the fact that if we set MODIS LWP to 10 – 15 g m2over the clear portions of domains, then the relative Wentz overes-timation disappeared. As further proof of our explanation, we stratified the results according to cloud fraction. Figure 3 shows box-whisker plots of Wentz-MODIS relative LWP differences for 10%-wide cloud fraction bins. As shown, the largest positive differences occurred for mostly clear domains with low cloud fractions. As the cloud fraction increased, the relative difference decreased, switching sign
from positive to negative at a cloud fraction of65%. What might explain the Wentz-MODIS bias?
[28] We have identified three potential sources of the bias. First, a recent investigation byZuidema et al.[2005] indi-cates that gaseous and liquid absorption models used in most microwave algorithms prior to 1995 led to overestimates of 10 – 25 g m2in instantaneous microwave LWP retrievals for warm marine clouds. They found that a more accurate depiction of the water vapor continuum in models from 1995 onward tends to reduce the retrieved LWP. Thus the use of older absorption models in the Wentz algorithm might cause a slight positive bias for lower cloud fractions. For larger cloud fractions, however,Zuidema et al.[2005] found that MODIS optical retrievals, too, can overestimate LWP, thereby balancing the overestimation in microwave esti-mates. A second error source could be the truncation of the Wentz data set at zero LWP. In cases of small cloud amounts, microwave retrievals at times yield negative LWP values because of their inherent uncertainties. In the Wentz data set, such negative retrievals are set to zero (C. Gentemann, personal communication, 2006), possibly biasing the mean results at low LWP values. Finally, there is also some evidence that the MODIS cloud mask may have missed a significant number of shallow Cu clouds [Zhao and Di Girolamo, 2006], thereby causing an underestimation in the subdomain cloud fraction, and resulting in an underestima-tion of the domain-average optical LWP. In a future study, we plan to further investigate the relative importance of these factors in causing the bias.
[29] Turning to individual scenes, results revealed that the correlation between Wentz and MODIS LWPs varied from 0.59 (R2 = 0.35) to 0.92 (R2 = 0.85), with most scenes having R 0.8 (R2 0.64). The RMS difference between the data sets was as low as 13 g m2and as high as 45 g m2; however, it was below 30 g m2for most scenes. Differences in scene average LWP values were typically no more than 25% of the Wentz mean, but occasionally they were as high as 50%. Large differences only occurred for broken Sc patches or small popcorn Cu fields, which were low cloud fraction scenes characterized by a positive microwave bias as explained earlier.
[30] The previous comparisons made use of MODIS effective radius retrievals. In order to investigate the effect of an ISCCP-type approach relying on a fixed effective radius, we computed optical thickness from MISR nadir camera reflectances assuming a fixed droplet effective radius of 10 mm. Results are shown in Figures 4a and 4b
Table 1. Statistical Summary of Microwave and Optical Liquid Water Path Estimates for Boundary Layer (BL) Cloudsa
BL 1 BL 2 BL 3 BL 4
Domains all overcast all overcast re MODIS MODIS re= 10mm re= 10mm Microwave mean 47 102 47 102 Optical mean 42 106 29 76 Bias 5 4 18 26 RMS 25 36 29 42 Correlation 0.85 0.78 0.76 0.62 Number of points 3080 541 3277 651 a
Means, biases, and RMS errors (after bias removal) are given in g m2. Figure 2. MODIS LWP versus TMIWentz LWP for
boundary layer clouds: (a) all domains and (b) overcast domains. In this and similar scatterplots, the red line is the 1:1 line, the gold line represents a linear fit, and the green curves are relative density contours in arbitrary units.
for all domains and overcast cases, respectively. (See also columns BL 3 and BL 4 in Table 1.) The most important change was a 30 – 40% underestimation in the optical mean LWP with respect to the microwave estimate. In addition, there was a significant increase in the RMS difference, and a significant decrease in the correlation between the data sets. This indicated that an effective radius of 10 mm was generally an underestimate for our boundary layer cloud scenes. In fact, the modal effective radius was at or above 13 – 15mm for most scenes, according to MODIS. For the much larger ISCCP data set a fixed value of 10 mm may have given an unbiased mean result. Nevertheless, the increased correlation and decreased RMS difference clearly demonstrated the advantage of retrieved effective radius over a fixed value.
[31] Finally, we evaluated the validity of the plane-parallel assumption used in the previous nadir optical retrievals by combining MISR angular optical thicknesses with MODIS effective radii and analyzing the view angle dependence of the resulting LWPs. As depicted in Figure 5a for all and overcast cases, the mean optical LWP showed a systematic but small increase with view zenith angle. With the exception of the most oblique angles, which were generally much more difficult to model, angular optical means were within ±15% of the microwave mean and within ±7% of one another. The variation of RMS difference as a function of view angle is depicted in Figure 5b. The microwave-optical comparison became noisier as the view zenith angle increased, and was accompanied by a simultaneous decrease in correlation (not shown) from 0.85 (R2 = 0.72) to 0.76 (R2 = 0.58). Nevertheless, the relatively weak view angle dependence of the results indicated some confidence in optical LWP retrievals for boundary layer clouds.
[32] These coarse resolution results can be contrasted with the high-resolution multiangle analysis of Horva´th and Davies [2004]. Our angular consistency test applied to simultaneous pixel-level (275-m) radiances suggested that only 20% of maritime liquid water clouds fit a 1-D reflectance model within ±5%. Here, the good consistency of mean angular optical LWP values suggested that hetero-geneity errors mostly canceled out when calculating large-scale averages. This was not surprising for thin boundary layer clouds, because the relationship between reflectance and optical thickness was close to linear.
Figure 4. MISR LWP versus TMIWentzLWP for boundary layer clouds: (a) all domains and (b) overcast domains. Optical estimates assumed a fixed droplet effective radius of 10mm (compare Figure 2).
Figure 3. Relative difference between TMIWentz and MODIS LWP estimates for boundary layer clouds as a function of subdomain cloud fraction.
4.2. Error Analysis
[33] In the scatterplots presented previously, we did not indicate error bars because this would have resulted in incomprehensible plots. Here we present an alternative error analysis in this section.
[34] For microwave retrievals, we assumed the nominal error characteristics given byWentz[1997]. For nonprecipi-tating water clouds with LWP500 g m2, Wentz estimated
bias and RMS errors of the algorithm at 5 g m2and 25 g m2, respectively. He also considered an additional 10% error introduced by the uncertainty in specifying cloud tempera-ture. This might have been an underestimate, however, because there is at least a factor of two variation in liquid water absorption coefficients as a function of temperature, as pointed out byPetty and Katsaros[1992]. Furthermore, the above accuracies were obtained for a spatial resolution of 50 km. Thus the actual microwave uncertainties in our 25 km data might have been larger than the nominal values we considered. For optical retrievals, we estimated the accuracy for each domain as the standard deviation of the nine angular LWP values computed using MISR data. Note that by using this approach we considered the uncertainty in LWP due to optical thickness errors but ignored uncertainty due to effective radius errors, because the same MODIS re was used for all MISR angles. Thus these errors were likely underestimates. We then compared the absolute difference between microwave and optical retrievals with the expected uncertainty, calculated by adding the estimated microwave and optical uncertainties in quadrature. If the absolute difference was less than the expected uncertainty, then the two different techniques gave consistent results within their respective error bounds.
[35] We found that for 82% of the domains, microwave and optical estimates appeared consistent with each other. Furthermore, in most cases the optical uncertainty was found to be much smaller than the microwave one. For example, the average standard deviation among the nine angular optical values was 9 g m2, which was only1/3 of the microwave uncertainty. We also found that for the majority of the inconsistent retrievals, the Wentz algorithm overestimated the optical technique. These cases were likely to be domains with low cloud fractions, for which Wentz retrievals showed a positive bias as discussed earlier. The error analysis yielded very similar results when only over-cast domains were considered. In this case, however, the average optical standard deviation increased to 18 g m2, and for inconsistent retrievals microwave overestimation was just as likely as underestimation.
4.3. Cold Precipitating (CP) Clouds
[36] In general, microwave and optical retrievals are challenging in cold, precipitating cloud systems because of the additional presence of cloud ice crystals and precip-itation (both liquid and ice). As a result, one main difficulty in microwave models is to properly account for scattering by large particles. The retrieval of cloud liquid/ice water is further complicated by the fact that smaller cloud droplets contribute little to the signal that is, instead, modulated primarily by the graupel-water content, or in some cases by the upper rain layers if graupel is less in evidence [Smith et al., 1992]. Nevertheless, the Wentz algorithm attempts to estimate cloud liquid water while the 2A12 profiling method tries to retrieve both cloud liquid and ice water from their weak signals.
[37] Optical retrievals, on the other hand, are generally insensitive to precipitation-sized particles; however, the significant amount of cloud ice above liquid cloud droplets results in an optical signal that is some combination of the cloud liquid water and cloud ice signals. The inherent problem with optical techniques is that the cloud liquid Figure 5. View zenith angle dependence of (a) mean
optical LWP and (b) Wentz microwave – optical RMS LWP difference for boundary layer clouds. Optical estimates were calculated using MISR angular cloud optical thickness and MODIS droplet effective radius. The solid red and blue lines correspond to the microwave mean for all and overcast domains, respectively. Dots depict the ±15% range about the microwave means.
and ice water contents cannot be separated. These difficul-ties have resulted in ambiguous interpretations of optical retrievals in cold clouds, with some authors interpreting the results as ice water path, some as liquid water path, and still others as total water path, that is, the sum of the liquid and ice components.
[38] In order to gain further insight into microwave-optical comparisons in cold, precipitating clouds, we first investigated the microphysical intercorrelations as captured by microwave data. In particular, we plotted microwave cloud LWP as a function of rain rate in Figure 6a. Here, black plus signs correspond to the Wentz algorithm while red dashes refer to the 2A12 product. An inherent
assump-tion in the Wentz algorithm is that light rain starts at a threshold cloud LWP value of 180 g m2, after which cloud LWP increases with rain rate, and then levels off for the highest rainfalls. This relationship is explicitly incorporated in the algorithm via the following expression (‘‘equation (36)’’ in the work byWentz and Spencer[1998], constitut-ing only the nonprecipitatconstitut-ing hydrometeor category):
LWP¼180 1þ ffiffiffiffiffiffiffiHrr
p
: ð2Þ
Here, rris rain rate in mm/hr and H is the rain column height in km, which is partly based upon the altitude of the freezing level as derived from radiosonde observations. The threshold cloud LWP of 180 g m2was determined from an investigation of Pacific extratropical storms. We note that other authors found somewhat larger rain thresholds varying between 250 and 500 g m2. In the Wentz algorithm, H is a tuning parameter specified so as to match the freezing level height for low values of the sea surface temperature and to reach a maximum value of Hmax= 3 km for the warmest sea surfaces. Wentz LWP values calculated from equation (2) using Hmaxare plotted as the gold curve in Figure 6a. The scatter below this envelope is due to the sea surface temperature dependence of H.
[39] The specified relationship between rain rate and cloud LWP is rather arbitrary in the Wentz algorithm. One might expect this relationship to be more accurately cap-tured in 2A12 retrievals, because they are based upon cloud-resolving model simulations. As shown by the red dashes in Figure 6a, cloud LWP is strongly and positively correlated with rain rate in the 2A12 product as well, with a correlation coefficient of 0.77. (A similar analysis between 2A12 cloud IWP and rain rate revealed a much weaker correlation of 0.48.) In 2A12 data, cloud LWP seems to increase linearly with rr; however, there is a break at a rain rate of 4 – 5 mm/hr below which the increase is faster than above it. More importantly, the 2A12 algorithm produces much smaller cloud LWP values than the Wentz algorithm. This point is further demonstrated in Figure 6b, which shows a head-to-head comparison between 2A12 and Wentz cloud LWPs. As shown, the two microwave cloud LWP estimates are highly correlated (correlation coefficient 0.80); however, 2A12 retrievals are biased low by400 g m2. This low bias is partly due to the fact that the 2A12 algorithm assigns zero cloud LWP to small rain rates. This is obviously incorrect because light rain should start at some finite threshold cloud LWP. What may cause this unphysical result?
[40] One possible explanation is that light rain cases tend to be dominated by footprints containing very small raining areas (as opposed to footprints filled entirely with light rain), given the relatively large footprint of TMI and the predominance of tropical cases in the 2A12 a priori data-base. That is, the cloud resolving models are not putting much cloud water at the edges of the simulation. It may also have to do with the fact that the simulations cannot account for clouds produced by weather systems other than tropical storms (C. Kummerow, personal communication, 2005).
[41] In light of the above, we decided to offset 2A12 cloud LWPs by a constant 180 g m2 for further compar-ison. In other words, we forced 2A12 data to start precip-itation at the same threshold cloud LWP as the Wentz data. Figure 6. Comparison of two microwave algorithms for
cold, precipitating clouds. (a) Cloud LWP as a function of rain rate derived from Wentz data (black plus signs) and 2A12 data (red dashes). The gold curve is equation (2) for Wentz data, while the gold lines are linear fits to 2A12 data. (b) Wentz cloud LWP versus 2A12 cloud LWP.
Such systematic adjustment of 2A12 cloud LWPs resulted in profiles no longer matching the measured brightness temperatures, since the original profiles produced by the algorithm were already optimized as such. The fact that the algorithm could reproduce microwave observations with physically inconsistent cloud liquid water highlighted the reduced sensitivity of the retrievals to this parameter. For us, the choice was between consistent cloud properties or matched brightness temperatures. We opted for the former, because therein laid our interest. Similar biases likely affected 2A12 cloud ice water paths as well. However, in the absence of any clear hints on the magnitude of such possible biases, we decided not to modify 2A12 ice water path values.
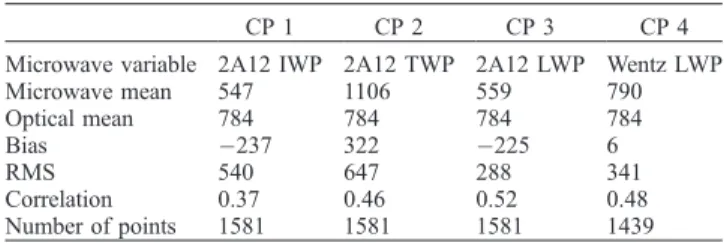
[42] After the modifications noted above, we next com-pared MODIS water path values to various microwave retrievals from the 2A12 product and the Wentz algorithm in order to investigate how to best interpret optical retriev-als. Our results are summarized in Table 2. Note that the added bias offset in 2A12 cloud liquid water path (and hence cloud total water path) affected the biases but not the correlations and residual RMS differences in the following comparisons. The first two columns (CP 1 and CP 2) refer to the most common cases, that is, when optical retrievals are interpreted as either cloud ice water path or cloud total water path. The last two columns (CP 3 and CP 4) correspond to comparisons with 2A12 and Wentz cloud liquid water path retrievals, respectively. The corresponding scatterplots are given in Figures 7 and 8.
[43] As shown, all comparisons revealed a much weaker relationship between microwave and optical retrievals for cold clouds than for warm, boundary layer clouds. Corre-lation coefficients were generally no better than 0.5 (R2
0.25), and the RMS difference between the techniques was at least an order of magnitude larger than for warm clouds. However, the weakest correlation of 0.37 (R2= 0.14) was obtained when MODIS retrievals were compared with 2A12 cloud ice water paths, even though this interpretation of optical measurements was the most straightforward, be-cause MODIS retrievals were based upon an ice scattering phase function. A somewhat better agreement was achieved when optical retrievals were compared with 2A12 cloud total water path values. Surprisingly, however, the highest correlations of 0.48 – 0.52 (R2 0.25) and smallest RMS differences were obtained when optical results were inter-preted as cloud liquid water path. Compared to 2A12 cloud liquid water paths, the MODIS results showed a large overestimation; however, they gave a basically unbiased
estimate when compared to Wentz cloud liquid water paths. Further analysis revealed that MODIS effective radius was poorly correlated with both cloud LWP and cloud IWP for these cold clouds. Therefore the correlation between optical and microwave cloud water path estimates was driven by optical thickness.
5. Summary and Discussion
[44] We have investigated the consistency of cloud water path retrievals obtained by microwave and optical methods in a multispacecraft and multisensor comparison. Because of the limited nature of our data set, our preliminary results may not be valid in all seasons and geographic locations. Nevertheless, we believe they convey useful information for understanding satellite observations. Our findings corrobo-rate previous studies that found good agreement between
Table 2. Statistical Summary of Microwave and Optical Water Path Estimates for Cold Precipitating (CP) Cloudsa
CP 1 CP 2 CP 3 CP 4
Microwave variable 2A12 IWP 2A12 TWP 2A12 LWP Wentz LWP Microwave mean 547 1106 559 790 Optical mean 784 784 784 784 Bias 237 322 225 6 RMS 540 647 288 341 Correlation 0.37 0.46 0.52 0.48 Number of points 1581 1581 1581 1439 a
Means, biases, and RMS errors (after bias removal) are given in g m2.
Figure 7. MODIS WP versus (a) TMI2A12 IWP and (b) TMI2A12 TWP for cold, precipitating clouds.
microwave and optical LWP estimates for warm, nonpreci-pitating boundary layer clouds. In addition, the weak view zenith angle dependence of optical retrievals found in this study builds further confidence in the results. The fact that multiangle optical LWP means have shown good consis-tency (within 7%) suggests that the significant heterogeneity errors found in plane-parallel optical retrievals in high-resolution data [Horva´th and Davies, 2004] are largely canceled out when calculating coarse resolution LWP aver-ages in relatively thin and low-water-content clouds. We have also established that a slight bias exists between Wentz microwave and MODIS optical estimates, with microwave retrievals increasingly overestimating optical ones at lower cloud fractions. We have identified three possible sources of this bias: the use of older gaseous and liquid absorption models in Wentz retrievals, the elimination of negative values in the Wentz data set, and possible errors in the
MODIS cloud mask over small Cu fields. We will investi-gate the relative importance of these factors in a future study.
[45] In addition to warm, nonprecipitating clouds for which both microwave and optical water path retrievals show considerable skill as discussed above, cold, precipi-tating clouds are also important from a climate perspective. Unfortunately, all cloud water retrievals may be of ques-tionable accuracy for such cloud systems. A major source of uncertainty in microwave methods is the treatment of radiative transfer processes for different absorption and scattering agents, in particular, scattering by large, precip-itation-sized particles. The Wentz algorithm, which is an emission-based scheme, has only ad hoc corrections for scattering. The TMI profiling algorithm, on the other hand, is a more complex, multichannel method that includes explicit handling of scattering and therefore might be expected to perform better. However, all microwave meth-ods suffer from the fundamental limitation that cloud water contributes little to the signal which originates primarily from precipitating particles. Hence the total water cannot be partitioned into cloud water and rainwater based upon radiometric observations only, and the retrieval of cloud water within precipitation is subject to large uncertainty, always requiring a priori assumptions. In the Wentz algo-rithm this is achieved by assuming a rather arbitrary analytical relationship between cloud LWP and rain rate. In the TMI profiling algorithm, cloud water is characterized from cloud-resolving model simulations, ultimately a more physically consistent approach. However, we have found that TMI model simulations can produce precipitation without appreciable amounts of cloud liquid water, which results in obviously underestimated LWP retrievals. There-fore it seems that while current profiling techniques might be superior to the simpler Wentz-type methods in terms of rainfall retrieval, their advantage in estimating the amount of cloud condensate is not as obvious.
[46] Uncertainties in optical retrievals of cold, precipitat-ing clouds are also considerable. The inherent problem with optical techniques (other than heterogeneity and saturation effects) is that cloud top reflectance is a combination of the cloud ice and cloud water signals that cannot be unscrambled from a single measurement. This difficulty is analogous to separating cloud water from rainwater in microwave measurements. Unlike in microwave methods, signal separation is not even attempted in optical tech-niques, although it is probably fair to say that the signal is more sensitive to cloud top ice. As a testimony to this somewhat confused situation, there have been different ways of interpreting optical estimates. Earlier versions of ISCCP were based upon a liquid scattering phase function, labeling retrievals as cloud LWP [Rossow and Schiffer, 1991]. Other authors have assumed that optical retrievals represent total water path, that is, the sum of the liquid and ice components [e.g., Lin and Rossow, 1994, 1996]. The most current ISCCP and MODIS algorithms rely on ice scattering phase functions for cold clouds and interpret the results accordingly as cloud IWP.
[47] These conflicting interpretations in cold, precipitat-ing clouds have never been tested before. In this paper, we have made an attempt to compare MODIS water paths with the various microwave retrievals from the TMI profiling and Figure 8. MODIS WP versus (a) TMI2A12 LWP and
Wentz algorithms. We have found that regardless of inter-pretation, the relationship between optical and microwave retrievals is much weaker for cold clouds than for warm clouds. Surprisingly, the relationship between the two methods is weakest when optical estimates are interpreted as cloud IWP, even though such labeling of MODIS retrievals appears the most straightforward for ice-topped clouds. If anything, MODIS retrievals are best correlated with microwave cloud LWP estimates (both TMI profiling and Wentz). As a final note, however, we have to emphasize that the divergence of microwave and optical methods in cold clouds might be due in large part to their different sensitivities to the various hydrometeors, as discussed earlier. Therefore more detailed modeling studies are needed before the techniques can be successfully reconciled.
[48] Acknowledgments. The research in this paper was conducted when A´ . Horva´th and R. Davies were at the Jet Propulsion Laboratory (JPL), California Institute of Technology, under contract with NASA. MISR and MODIS data sets were provided by the Langley and Goddard DAAC, respectively. TMI Wentz data were produced by Remote Sensing Systems (RSS) and sponsored by the NASA Earth Science REASoN DISCOVER Project. Data are available at http://www.remss.com. The standard 2A12 product was obtained from TSDIS. We thank Marty Brewer from RSS for his help in using the Wentz data and Steve Bilanow from TSDIS for his advice on the use of the TRMM Overflight Finder. We are also indebted to Chris Kummerow for his insights into the workings of the 2A12 algorithm. Thanks go to David Diner and Paquita Zuidema for stimulating discussions. The comments and suggestions of three anonymous reviewers greatly enhanced the quality of the paper. Finally, we thank Cynthia Archerd for her invaluable editorial assistance.
References
Bruegge, C. J., N. L. Chrien, R. R. Ando, D. J. Diner, W. A. Abdou, M. C. Helmlinger, S. H. Pilorz, and K. J. Thome (2002), Early validation of the Multi-angle Imaging SpectroRadiometer (MISR) radiometric scale,IEEE Trans. Geosci. Remote Sens.,40, 1477 – 1492.
Cess, R. D., et al. (1996), Cloud feedback in atmospheric general circula-tion models: An update,J. Geophys. Res.,101, 12,791 – 12,794. Clement, A. C., and B. Soden (2005), The sensitivity of the tropical-mean
radiation budget,J. Clim.,18, 3189 – 3203.
Diner, D. J., J. C. Beckert, G. W. Bothwell, and J. I. Rodriguez (2002), Performance of the MISR instrument during its first 20 months in Earth orbit,IEEE Trans. Geosci. Remote Sens.,40, 1449 – 1466.
Greenwald, T. J., G. L. Stephens, T. H. Vonder Haar, and D. L. Jackson (1993), A physical retrieval of cloud liquid water over the global oceans using Special Sensor Microwave/Imager (SSM/I) observations,J. Geo-phys. Res.,98, 18,471 – 18,488.
Greenwald, T. J., S. A. Christopher, and J. Chou (1997), Cloud liquid water path comparisons from passive microwave and solar reflectance satellite measurements: Assessment of sub-field-of-view clouds effects in micro-wave retrievals,J. Geophys. Res.,102, 19,585 – 19,596.
Ho, S., B. Lin, P. Minnis, and T. Fan (2003), Estimates of cloud vertical structure and water amount over tropical oceans using VIRS and TMI data,J. Geophys. Res.,108(D14), 4419, doi:10.1029/2002JD003298. Horva´th, A´ . (2004), Differences between satellite measurements and
theo-retical estimates of global cloud liquid water amounts, Ph.D. dissertation, 215 pp., Univ of Ariz., Tucson.
Horva´th, A´ ., and R. Davies (2001), Feasibility and error analysis of cloud motion wind extraction from near-simultaneous multiangle MISR mea-surements,J. Atmos. Oceanic Technol.,18, 591 – 608.
Horva´th, A´ ., and R. Davies (2004), Anisotropy of water cloud reflectance: A comparison of measurements and 1D theory,Geophys. Res. Lett.,31, L01102, doi:10.1029/2003GL018386.
King, M. D., S.-C. Tsay, S. E. Platnick, M. Wang, and K.-N. Liou (1997), Cloud retrieval algorithms for MODIS: Optical thickness, effective par-ticle radius, and thermodynamic phase,MODIS Algorithm Theoretical
Basis Document ATBD-MOD-05, version 5, NASA Goddard Space Flight Cent., Greenbelt, Md. (Available at http://modis-atmos.gsfc.nasa. gov/_docs/atbd_mod05.pdf)
Kummerow, C., W. Barnes, T. Kozu, J. Shiue, and J. Simpson (1998), The Tropical Rainfall Measuring Mission (TRMM) sensor package,J. Atmos. Oceanic Technol.,15, 809 – 817.
Kummerow, C., Y. Hong, W. S. Olson, S. Yang, R. F. Adler, J. McCollum, R. Ferraro, G. Petty, D.-B. Shin, and T. T. Wilheit (2001), The evolution of the Goddard Profiling Algorithm (GPROF) for rainfall estimation from passive microwave sensors,J. Appl. Meteorol.,40, 1801 – 1820. Lin, B., and W. B. Rossow (1994), Observations of cloud liquid water path
over oceans: Optical and microwave remote sensing methods,J. Geo-phys. Res.,99, 20,907 – 20,927.
Lin, B., and W. B. Rossow (1996), Seasonal variation of liquid and ice water path in nonprecipitating clouds over oceans,J. Clim.,9, 2890 – 2902.
Lojou, J.-Y., R. Frouin, and R. Bernard (1991), Comparison of Nimbus-7 SMMR and GOES-1 VISSR atmospheric liquid water content,J. Appl. Meteorol.,30, 187 – 198.
Masunaga, H., T. Iguchi, R. Oki, and M. Kachi (2002a), Comparison of rainfall products derived from TRMM microwave imager and precipita-tion radar,J. Appl. Meteorol.,41, 849 – 862.
Masunaga, H., T. Y. Nakajima, T. Nakajima, M. Kachi, R. Oki, and S. Kuroda (2002b), Physical properties of maritime low clouds as retrieved by combined use of Tropical Rainfall Measurement Mission Microwave Imager and Visible/Infrared Scanner: Algorithm,J. Geophys. Res.,107(D10), 4083, doi:10.1029/2001JD000743.
Nakajima, T., and M. D. King (1990), Determination of the optical thick-ness and effective particle radius of clouds from reflected solar radiation measurements, I, Theory,J. Atmos. Sci.,47, 1878 – 1893.
Petty, G. W., and K. B. Katsaros (1992), The response of the SSM/I to the marine environment. Part I: An analytic model for the atmospheric com-ponent of observed brightness temperatures,J. Atmos. Oceanic Technol.,
9, 746 – 761.
Pruppacher, H. R., and R. Jaenicke (1995), The processing of water vapor and aerosols by atmospheric clouds, a global estimate,Atmos. Res.,38, 283 – 295.
Rossow, W. B., and R. A. Schiffer (1991), ISCCP cloud data products,Bull. Am. Meteorol. Soc.,72, 2 – 20.
Smith, E. A., A. Mugnai, H. J. Cooper, G. J. Tripoli, and X. Xiang (1992), Foundations for statistical-physical precipitation retrieval from passive microwave satellite measurements. Part I: Brightness-temperature proper-ties of a time-dependent cloud-radiation model,J. Appl. Meteorol.,31, 506 – 531.
Spencer, R. W. (1993), Global oceanic precipitation from the MSU during 1979 – 92 and comparisons to other climatologies, J. Clim.,6, 1301 – 1326.
Stephens, G. L. (1978), Radiation profiles in extended water clouds, II, Parameterization schemes,J. Atmos. Sci.,35, 2123 – 2132.
Vavrus, S. (2004), The impact of cloud feedbacks on Arctic climate under greenhouse forcing,J. Clim.,17, 603 – 615.
Wentz, F. J. (1997), A well-calibrated ocean algorithm for special sensor microwave/imager,J. Geophys. Res.,102, 8703 – 8718.
Wentz, F. J., and R. W. Spencer (1998), SSM/I rain retrievals within a unified all-weather ocean algorithm,J. Atmos. Sci.,55, 1613 – 1627. Wood, R., C. S. Bretherton, and D. L. Hartmann (2002), Diurnal cycle of
liquid water path over the subtropical and tropical oceans,Geophys. Res. Lett.,29(23), 2092, doi:10.1029/2002GL015371.
Zhao, G., and L. Di Girolamo (2006), Cloud fraction errors for trade wind cumuli from EOS-Terra instruments,Geophys. Res. Lett.,33, L20802, doi:10.1029/2006GL027088.
Zuidema, P., E. R. Westwater, C. Fairall, and D. Hazen (2005), Ship-based liquid water path estimates in marine stratocumulus,J. Geophys. Res.,
110, D20206, doi:10.1029/2005JD005833.
R. Davies, Department of Physics, University of Auckland, Private Bag 92019, Auckland, New Zealand.
A´ . Horva´th, Rosenstiel School of Marine and Atmospheric Science, University of Miami, 4600 Rickenbacker Causeway, Miami, FL 33149-1031, USA. (ahorvath@rsmas.miami.edu)