Copyright © 2019. Kejna and Sobota. This is an open-access article distributed under the terms of the Creative Commons Attribution-NonCommercial-NoDerivatives License (CC BY-NC-ND 3.0 https://creativecommons.org/licenses/by-nc-nd/3.0/), which permits use, distribution, and reproduction in any medium, provided that the article is properly cited, t he use is non-commercial, and no modifications or adaptations are made.
Meteorological conditions on Kaffiøyra (NW Spitsbergen)
in 2013–2017 and their connection
with atmospheric circulation and sea ice extent
Marek KEJNA1* and Ireneusz SOBOTA21 Nicolaus Copernicus University, Faculty of Earth Sciences,
Department of Meteorology and Climatology, Lwowska 1, 87-100 Toruń, Poland
2Nicolaus Copernicus University, Faculty of Earth Sciences,
Department of Hydrology and Water Management, Lwowska 1, 87-100 Toruń, Poland
* corresponding author <marek.kejna@umk.pl>
Abstract: This article comprises an analysis of the variability of meteorological conditions on Kaffiøyra (NW Spitsbergen, Svalbard) in 2013–2017 in connection with atmospheric circulation and the extent of sea ice. The obtained results were compared with the results of observations made at the Ny-Ålesund station. Due to the situation of the area in the polar region and the large amount of clouds, especially in summer, the annual sum of incoming solar radiation was small, amounting to an average of 2,237.8 MJ.m-2 per year.
The mean air temperature in the considered period was -2.0°C. Its extreme values ranged from 15.2°C to -23.8°C. In the annual course, the highest mean temperature occurred in July (6.5°C), and the lowest in March (-7.8°C). The mean relative humidity of air was high (83%). The prevailing wind directions were from south and north sectors and this coincided with the orientation of Forlandsundet. The mean wind speed was 3.6 m.s-1.
In the summer season in 1975–2017, a statistically significant air temperature increase was observed, reaching 0.28°C/10 years. The high variability of local weather condi-tions was caused mainly by atmospheric circulation and the impact of sea ice was much smaller in comparison.
Key words: Arctic, Svalbard, climate change, weather conditions, synoptic situations, sea ice cover.
Introduction
In recent years, the Arctic has seen major climate changes and the air temperature has been increasing twice as fast there compared to the rest of the world (Osborne et al. 2018). A particularly strong increase in air temperature
has been observed in the Atlantic sector of the Arctic (Przybylak 2016). In the area of Svalbard, according to data sourced from the Svalbard Lufthavn weather station, the temperature trend in 1892–2012 was 2.6°C/100 years (Nordli et al.
2014). Such a striking change in temperature resulted from positive feedback mechanisms, so-called Arctic amplification (Serreze and Barry 2011), connected to, among others, a reduction in the area of sea ice and land deglaciation (Screen and Simmonds 2010; Isaksen et al. 2016). In the Arctic, at the time of maximum solar irradiance (i.e. summer) the extent of sea ice shrank by approx. 50% (Stammerjohn et al. 2012). As a result of climatic changes in Svalbard, the glaciated area has decreased by an average of 80 km2 over the
past 30 years, representing a reduction of 7% (Nuth et al. 2013) and about 43% in the Kaffiøyra region (Sobota 2013; Sobota et al. 2016a). Significant changes in snow cover have also been observed (Sobota 2017). The reflectivity of the surface is changing (albedo), causing increased absorption of solar radiation (Maturilli et al. 2015; Kejna et al. 2017). The temperature of the ground is increasing (Sobota and Nowak 2014; Araźny et al. 2016) and the permafrost is thawing (Etzelmüller et al. 2011).
The rate of Arctic climate changes is different for particular regions of the Arctic (Przybylak 2016). Only few stations in Svalbard maintain long data series (Gjelten
et al. 2016; Isaksen et al. 2016), so temporary stations operating in summer provide researchers with valuable input. Moreover, observation networks based on automatic meteorological stations have been set up in various parts of Spitsbergen (Araźny
et al. 2010, 2017; Bednorz and Kolendowicz 2010; Láska et al. 2012; Przybylak
et al. 2012, 2014; Małecki 2015; Ambrožová and Láska 2017; Cisek et al. 2017; Kendzierski et al. 2018; Araźny 2019). The Nicolaus Copernicus University Polar Station on Kaffiøyra (NW Spitsbergen) also carries out long-term observations. These started in 1975 (Leszkiewicz 1977) as part of expeditions, at first in summer seasons and later, after automatic loggers were introduced in 2005, continuously (Przybylak et al. 2012, 2018; Przybylak and Araźny 2016).
The purpose of this article is to investigate changes in meteorological conditions on Kaffiøyra in the years 2013–2017 to find out their connection with atmospheric circulation and the extent of sea ice in the area of Svalbard. Therefore, the pressure field and sea ice extent were analysed for the warmest and coldest months in individual seasons of the year in the above time period.
Research area
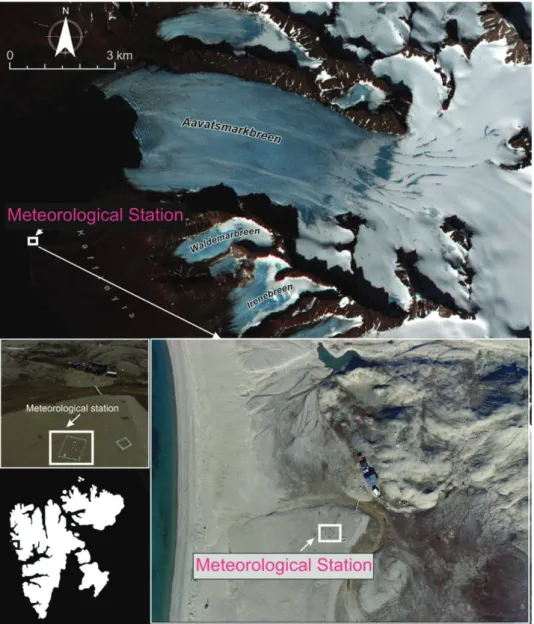
Kaffiøyra is a coastal plain situated on the banks of Forlandsundet in NW Spitsbergen. The plain’s natural boundaries are marked by the Aavatsmarkbreen terminating in Hornbækbukta in the north, and the Dahlbreen flowing into a related bay (Figs. 1 and 2; Sobota et al. 2016b). In the east, Kaffiøyra
borders six glaciers descending from the Prince Heinrich and Jacobson mountain ranges: Waldemarbreen, Irenebreen, Elisebreen, Eivindbreen, Andreasbreen and Oliverbreen. The region of Kaffiøyra with the adjacent glaciers, Aavatsmarkbreen (75 km2) and Dahlbreen (132 km2), has an area of about 300 km2.
The plain is widest in the north, stretching over 3.4 km. Its width decreases in a south-westerly direction to 2.4 km at Elisebreen, and further towards Andreasbreen to 1.5 km. Coastal terraces cut into proglacial river valleys. In
Fig. 1. Location of the meteorological station near the Nicolaus Copernicus University Polar Station on Kaffiøyra in 2013–2017 (photo I. Sobota).
the north, the outwash fan of the Waldemar River reaches 900 m at its widest. The outwash areas of the Elise River and Irene River are up to 1.4 km wide. The rest of the sandur and other valleys are much narrower (Lankauf 2002).
Glaciers of this region are polythermal, with cold ice and a temperate surface layer of 10–15 m depth during the summer (Sobota 2011). This supposition is supported by the presence of icings in the forefield of the glaciers. The mass balance of the Kaffiøyra region glaciers is clearly negative (Sobota 2013; Sobota
et al. 2016a, b).
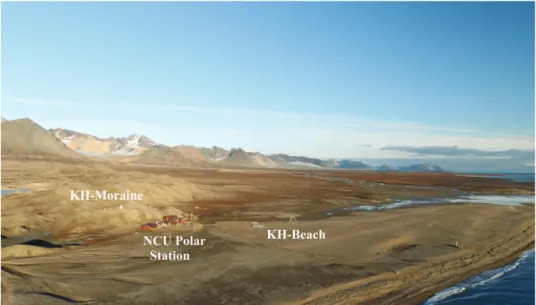
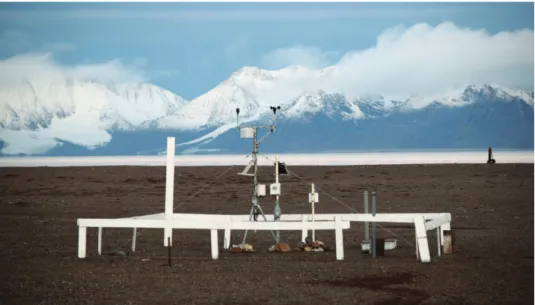
Meteorological observations on Kaffiøyra began on a beach at 3 m a.s.l. in 1975 (Leszkiewicz 1977). In 1978, the observation site was moved to the moraine of the Aavatsmarkbreen (KH-Moraine) located at 11 m a.s.l. In July 2013, at the initial location, an automatic weather station (KH-Beach) was put into operation (Fig. 3); its measurements provided the basis for this study. The coordinates of the KH-Beach station are 78°40’34”N and 11°49’38”E.
Climatic factors
Climate conditions in the Svalbard area are determined by the polar location of the archipelago, which also determines the amount of incoming solar energy. At the NCU Polar Station on Kaffiøyra, the polar night is from 26 October to 16 February (114 days), whereas the polar day lasts from 17 April to 25 August
Fig. 2. Localization of the Nicolaus Copernicus University Polar Station and meteorological stands: KH-Moraine and KH-Beach on Kaffiøyra (photo I. Sobota).
(131 days). In the remaining part of the year, there are both daytime and night-time periods within 24 hours. The maximum solar elevation angle at midday at the time of summer solstice (22 June) is 34.8° (Kejna 2012).
The weather and climate conditions on Spitsbergen are largely affected by the oceanic waters surrounding the island. The warm West Spitsbergen Current, with average water temperature of 5–7°C, runs along the western coastline of Spitsbergen (Walczowski 2007). On the eastern side of the island, however, some of the ice-cold waters of the East Spitsbergen Current flow round the southern end of Spitsbergen and head north as the so-called Sørkapp Current. The reach of sea ice is also important, as it has been largely reduced in recent years (Meier et al. 2014; Orr 2019).
Atmospheric circulation in the area is controlled by barometric highs and lows. Cyclones generally form over the Northern Atlantic (the Icelandic Low) and move eastwards south of Svalbard along the so-called Iceland–Kara Trough (Käsmacher and Schneider 2011; Turner and Marshall 2011). Some of these centres turn north along Svalbard’s coastline. Anticyclonic centres also significantly affect the weather in the area: the permanent Greenland High and the high over the Barents Sea, the latter mainly having influence in summer. The frequency of cyclonic weather patterns (56.5%) in the area of Svalbard is higher than the occurrence of anticyclonic situations (40.6%; data for the years 1951–2006; Niedźwiedź 2006). In the spring and summer, the contribution of cyclonic and anticyclonic patterns becomes similar. The baric field arrangement in the area of Spitsbergen
is characterised by great dynamics and changeability, both daily and annually. On Svalbard, easterly advection prevails (Niedźwiedź and Łupikasza 2015), although air masses coming from the west and south are also common.
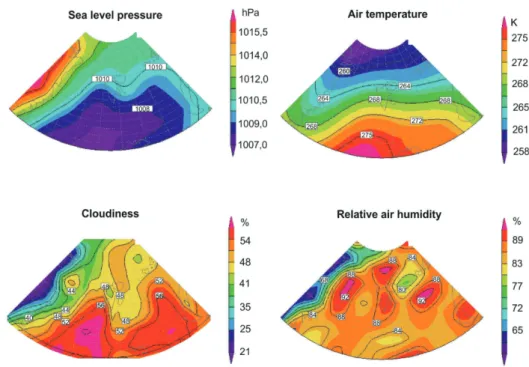
Figure 4 presents an average baric field at sea level in the Svalbard area in the period 1981–2010. Atmospheric pressure reduced to sea level drops from approx. 1011 hPa to 1008 hPa from north to south in the Svalbard area. The barometric situation is nonetheless dynamic, and changes day by day. The isotherms do not follow the latitudes (Fig. 4). The influence of the West Spitsbergen Current makes air temperature along the western coast of the archipelago higher, whereas on the eastern side of Svalbard, the East Spitsbergen Current brings cold waters from the north, which also affects the local air temperature, at least in winter.
The Svalbard area is characterised by substantial cloudiness, especially along the west coast (Fig. 4) where humid air masses frequently come from the south. In the interior of Spitsbergen and in the east of the archipelago, there is less cloudiness due to the influence of snow and glacial ice. The cloud amount is greater in summer, when air masses moving over water and ice fields cool, contributing to the condensation of water vapour and the formation of sheet
Fig. 4. Maps of average atmospheric pressure fields (in Pa), air temperature (in K), cloud cover (in %) and relative air humidity (in %) in the area of Svalbard in 1981–2010. The source of
clouds. At the Ny-Ålesund weather station, the greatest cloudiness occurs in summer, when low level clouds often develop (Shupe et al. 2011). In the most recent years, over the Arctic Ocean there has been an increase in cloudiness in spring and autumn. There has been a greater amount of low-level clouds in the sky (Eastman and Warren 2010).
The average air relative humidity in Svalbard is high, exceeding 88%. Only in the eastern part of the archipelago do lower water vapour saturation levels occur (Fig. 4).
Data and processing methodology
Data were obtained from a HOBO Onset automatic weather station located near the Nicolaus Copernicus University Polar Station on the Kaffiøyra (KH-Beach) (Figs. 2 and 3). Sensor parameters are presented in Table 1 according to the manufacturer’s data (http://www.onsetcomp.com).
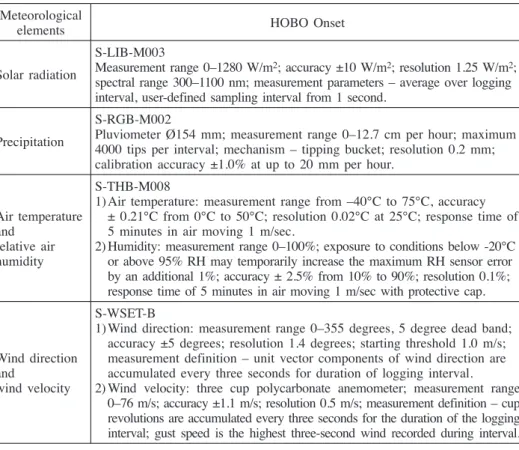
Table 1 Technical specifications of the HOBO Onset weather station.
Meteorological
elements HOBO Onset
Solar radiation
S-LIB-M003
Measurement range 0–1280 W/m2; accuracy ±10 W/m2; resolution 1.25 W/m2;
spectral range 300–1100 nm; measurement parameters – average over logging interval, user-defined sampling interval from 1 second.
Precipitation
S-RGB-M002
Pluviometer Ø154 mm; measurement range 0–12.7 cm per hour; maximum 4000 tips per interval; mechanism – tipping bucket; resolution 0.2 mm; calibration accuracy ±1.0% at up to 20 mm per hour.
Air temperature and
relative air humidity
S-THB-M008
1) Air temperature: measurement range from –40°C to 75°C, accuracy ± 0.21°C from 0°C to 50°C; resolution 0.02°C at 25°C; response time of 5 minutes in air moving 1 m/sec.
2) Humidity: measurement range 0–100%; exposure to conditions below -20°C or above 95% RH may temporarily increase the maximum RH sensor error by an additional 1%; accuracy ± 2.5% from 10% to 90%; resolution 0.1%; response time of 5 minutes in air moving 1 m/sec with protective cap.
Wind direction and
wind velocity
S-WSET-B
1) Wind direction: measurement range 0–355 degrees, 5 degree dead band; accuracy ±5 degrees; resolution 1.4 degrees; starting threshold 1.0 m/s; measurement definition – unit vector components of wind direction are accumulated every three seconds for duration of logging interval. 2) Wind velocity: three cup polycarbonate anemometer; measurement range
0–76 m/s; accuracy ±1.1 m/s; resolution 0.5 m/s; measurement definition – cup revolutions are accumulated every three seconds for the duration of the logging interval; gust speed is the highest three-second wind recorded during interval.
Every hour, the station recorded parameters such as mean wind direction, mean and maximum wind speed, mean solar radiation, mean air temperature, mean relative humidity and total precipitation. The unit was powered by a solar panel and a battery to ensure continuous operation. No disruptions in data logging were encountered. Precipitation data was not taken into consideration, as the rain gauge was not heated.
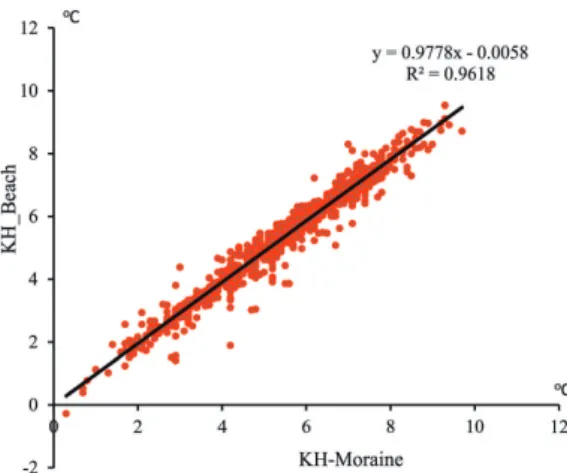
The location of the automatic weather station on the beach, a few dozen metres from the moraine station (KH-Moraine, used in the years 1978–2015), did not affect the equivalence of obtained results, as evidenced by parallel observations carried out in the summer of 2014. The correlation coefficient for the two sites was 0.98 for temperature (Fig. 5), 0.96 for RH, 0.82 for solar radiation, and 0.98 for wind speed.
The data used for comparison and reconstruction purposes was obtained from the nearby Ny-Ålesund station and sourced from the Norwegian Meteorological Institute (eKlima Portal, http://sharki.oslo.dnmi.no). Maps of the distribution of meteorological elements in the area of Svalbard were also used and these were obtained from the NCEP/NCAR 40-year reanalysis project (Kalnay et al.
1996) – http://www.esrl.noaa.gov. The maps of sea-ice concentration on the 15th day of the month in the Svalbard area were downloaded from the website
of the European Organisation for the Exploitation of Meteorological Satellites (EUMETSAT) Ocean and Sea Ice Satellite Application Facility (OSI SAF, http:// osisaf.met.no).
Results
Wind direction and speed. — The wind direction on Kaffiøyra is determined
by the synoptic scale pressure field and heavily modified by the surface features in the area of Forlandsundet (Przybylak et al. 2012). The arrangement of the Oscar II Land mountain ranges and Prins Karl Forland forces a specific flow of air masses from the north and the south.
Fig. 5. Correlations between air temperature values on the KH-Beach and on the KH-Moraine on Kaffiøyra
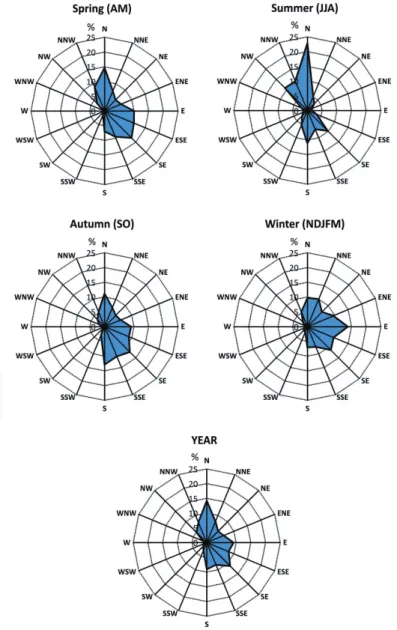
In the years 2013–2017, the wind on Kaffiøyra most often blew from the N (14.3%), SE (11.3%) and S and E (9.1% in each case) directions (Fig. 6). The substantial share of eastern sector winds is due to the local circulation connected with a katabatic flow of air masses along the glaciers from the interior of Spitsbergen (Przybylak et al. 2012). Periods of calm air hardly occurred and
Fig. 6. Frequency of wind directions (%) on Kaffiøyra during the year and in individual seasons in 2013–2017.
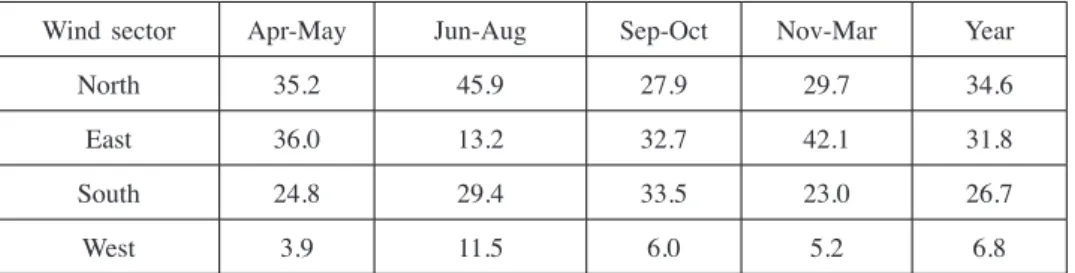
Table 2 Frequency of occurrence of wind sectors on Kaffiøyra in 2013–2017.
Wind sector Apr-May Jun-Aug Sep-Oct Nov-Mar Year
North 35.2 45.9 27.9 29.7 34.6
East 36.0 13.2 32.7 42.1 31.8
South 24.8 29.4 33.5 23.0 26.7
West 3.9 11.5 6.0 5.2 6.8
Explanations:
North = ½NW + NNW + N + NNE + ½NE; East = ½NE + ENE + E + ESE + ½SE; South = ½SE + SSE + S + SSW + ½SW; West = ½SW + WSW + W + WNW + ½NW.
there were no hours with no wind recorded. A seasonal variability was observed in the frequency of wind directions. In spring, air most often came from the eastern sector (36.0%) and the north (35.2%), less frequently from the south (24.8%) and hardly ever from the western sector (3.9%) (Table 2). In summer, northern sector winds prevailed (45.9%), followed by southern winds (29.4%). Western sector winds were more frequent than in the other seasons (11.5%). In autumn, the share of the southern and eastern sector increased (33.5% and 32.7%, respectively), but northerly and westerly advection decreased (27.9% and 6.0%, respectively). Winters are characterised by a large share of eastern sector winds (42.1%). Northern winds blow less often (29.7%) and so do southern winds (23.0%). Western sector winds were occasional (5.2%). The seasonal changes in the frequency and direction of the wind are connected with changes in the configuration of the pressure field in Svalbard.
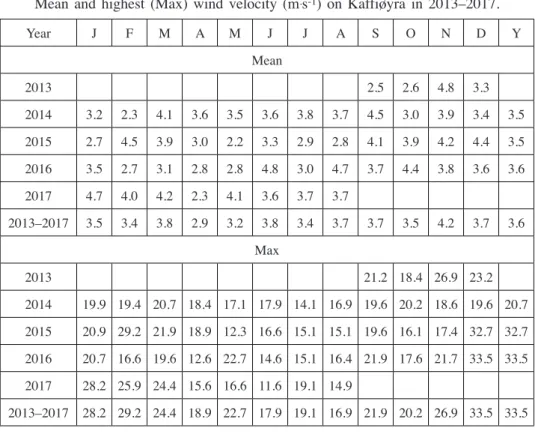
The mean wind speed in the analysed period on Kaffiøyra was 3.6 m.s-1
(Table 3). In the annual course, the highest mean speed occurred in November (4.2 m.s-1), whereas the lowest speed was observed in April (2.9 m.s-1). In
individual years, however, the strongest winds occurred in different months: in 2014 in September (4.5 m.s-1), in 2015 in February (4.5 m.s-1), and in 2016
in June (4.8 m.s-1). Maximum recorded wind speeds exceeded 30 m.s-1, e.g. in
December 2016 it was 33.5 m.s-1, and 32.7 m.s-1 in December 2015. By contrast,
in summer and in April maximum wind speeds did not exceed 20 m.s-1.
The wind speed demonstrates considerable day-to-day changes (Fig. 7), which are determined by changes in the synoptic pressure gradient in the Svalbard area. Sudden rises in wind speed, lasting a few days and resulting from a cyclone passing by the archipelago, are common. The wind channeling effect at Forlandsundet increases at such times.
The greatest mean value of wind speed was observed for S winds (5.7 m.s-1)
and N winds (5.0 m.s-1). The lowest wind speeds were recorded for ENE (1.4 m.s-1)
Table 3 Mean and highest (Max) wind velocity (m.s-1) on Kaffiøyra in 2013–2017.
Year J F M A M J J A S O N D Y Mean 2013 2.5 2.6 4.8 3.3 2014 3.2 2.3 4.1 3.6 3.5 3.6 3.8 3.7 4.5 3.0 3.9 3.4 3.5 2015 2.7 4.5 3.9 3.0 2.2 3.3 2.9 2.8 4.1 3.9 4.2 4.4 3.5 2016 3.5 2.7 3.1 2.8 2.8 4.8 3.0 4.7 3.7 4.4 3.8 3.6 3.6 2017 4.7 4.0 4.2 2.3 4.1 3.6 3.7 3.7 2013–2017 3.5 3.4 3.8 2.9 3.2 3.8 3.4 3.7 3.7 3.5 4.2 3.7 3.6 Max 2013 21.2 18.4 26.9 23.2 2014 19.9 19.4 20.7 18.4 17.1 17.9 14.1 16.9 19.6 20.2 18.6 19.6 20.7 2015 20.9 29.2 21.9 18.9 12.3 16.6 15.1 15.1 19.6 16.1 17.4 32.7 32.7 2016 20.7 16.6 19.6 12.6 22.7 14.6 15.1 16.4 21.9 17.6 21.7 33.5 33.5 2017 28.2 25.9 24.4 15.6 16.6 11.6 19.1 14.9 2013–2017 28.2 29.2 24.4 18.9 22.7 17.9 19.1 16.9 21.9 20.2 26.9 33.5 33.5
Fig. 7. Time series of wind velocity (mean – bold line, max – dotted blue line) on Kaffiøyra in 2013–2017.
Fig. 8. Time series of global solar radiation (daily values) on Kaffiøyra in the period 9.08.2013–4.09.2017.
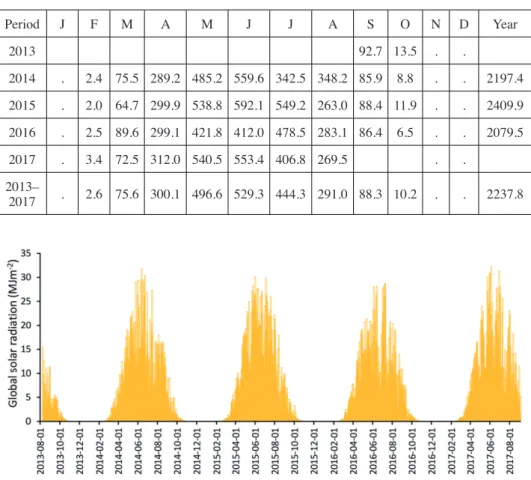
Table 4 Monthly and yearly sums of the global solar radiation (MJ.m-2) on Kaffiøyra
in 2013–2017. Period J F M A M J J A S O N D Year 2013 92.7 13.5 . . 2014 . 2.4 75.5 289.2 485.2 559.6 342.5 348.2 85.9 8.8 . . 2197.4 2015 . 2.0 64.7 299.9 538.8 592.1 549.2 263.0 88.4 11.9 . . 2409.9 2016 . 2.5 89.6 299.1 421.8 412.0 478.5 283.1 86.4 6.5 . . 2079.5 2017 . 3.4 72.5 312.0 540.5 553.4 406.8 269.5 . . 2013– 2017 . 2.6 75.6 300.1 496.6 529.3 444.3 291.0 88.3 10.2 . . 2237.8
Solar radiation. — The mean annual sum of solar radiation on Kaffiøyra
amounted to 2,237.8 MJ.m-2. In the years for which data series were complete,
it ranged from 2,079.5 MJ.m-2 (2016) to 2,409.9 MJ.m-2 (2015) (Table 4).
In the annual course, the most solar energy reached the surface on average in June: 529.3 MJ.m-2 (204.2 W.m-2) and May: 529.3 MJ.m-2 (185.4 W.m-2), i.e.
during the polar day, when the sun reaches the highest altitude. The reduced incoming solar radiation in July (444.3 MJ.m-2) was due to substantial cloudiness
that occurred in that month. In individual months, big differences in the amount of incoming solar radiation are observed between one year and another. For example, in June it ranges from 412.0 MJ.m-2 (2016) to 592.1 MJ.m-2 (2015).
549.2 MJ.m-2 (2015). The changes are due to cloudiness. From November to
January it was polar night. The greatest diurnal sums of solar radiation exceeded 30 MJ.m-2 in the months with the highest solar elevation angle (Fig. 8).
Air temperature. — In 2013–2017, the mean air temperature on Kaffiøyra
was -2.0°C (Table 5). In the years for which data series were complete, it ranged from -0.5°C (2016) to -2.2°C (2014). In the annual course, the coldest month was March (-7.8°C) and the warmest was July (6.6°C). The annual amplitude of air
Table 5 Monthly and yearly values of air temperature (°C) on Kaffiøyra in 2013–2017.
Mean air temperature
Year J F M A M J J A S O N D Y 2013 4.1 –4.5 –8.0 –7.5 2014 –3.9 –2.1 –7.8 –9.0 –2.8 2.0 5.9 5.3 1.2 –1.1 –6.1 –7.7 –2.2 2015 –5.9 –12.7 –5.6 –5.2 –2.4 3.9 6.9 6.3 2.4 –1.1 –3.5 –6.4 –1.9 2016 –4.2 –6.1 –6.8 –6.1 1.3 3.8 7.7 4.9 3.8 2.4 –0.7 –5.6 –0.5 2017 –10.6 –6.9 –10.8 –7.1 –3.9 3.5 5.9 4.9 2013–2017 –6.1 –7.0 –7.8 –6.8 –1.9 3.3 6.6 5.3 2.9 –1.1 –4.6 –6.8 –2.0
Maximum of air temperature (hourly values)
Year J F M A M J J A S O N D Y 2013 10.6 3.2 2.2 4.4 2014 1.7 4.2 4.3 –0.2 2.5 9.6 10.4 9.5 6.5 9.6 2.9 2.0 10.4 2015 2.7 1.5 2.7 3.4 5.3 8.4 13.7 15.2 6.2 5.5 6.0 5.9 15.2 2016 3.5 2.2 3.0 1.4 5.3 7.7 12.4 10.1 9.7 7.5 5.5 3.1 12.4 2017 0.4 3.3 –0.5 1.7 5.8 8.5 11.3 8.8 2013–2017 3.5 4.2 4.3 3.4 5.8 9.6 13.7 15.2 10.6 9.6 6.0 5.9 15.2
Minimum of air temperature (hourly values)
Year J F M A M J J A S O N D Y 2013 –1.3 –12.3 –17.7 –20.2 2014 –16.7 –11.9 –21.1 –17.1 –12.2 –2.5 1.6 –0.3 –5.3 –12.5 –14.6 –17.0 –21.1 2015 –22.4 –23.8 –19.9 –15.8 –10.9 –0.8 3.3 0.7 –4.5 –12.5 –13.6 –19.2 –23.8 2016 –13.5 –15.3 –19.5 –17.0 –2.8 –1.3 3.2 0.6 –0.8 –4.3 –10.4 –20.1 –20.1 2017 –21.4 –21.1 –22.0 –17.4 –10.0 –0.6 2.3 –0.3 2013–2017 –22.4 –23.8 –22.0 –17.4 –12.2 –2.5 1.6 –0.3 –5.3 –12.5 –17.7 –20.2 –23.8
temperature amounted to 14.4°C, which indicates a strong influence of oceanicity making autumn much warmer than spring. In October, the mean air temperature was -1.1°C, and in April it was -6.8°C. The period of positive mean temperature lasted from June to September, and in 2016, mean temperatures above zero were observed even in October and May. Dramatic changes in temperature conditions from one year to the next are typical of Spitsbergen – in February 2014 the mean air temperature was -2.1°C, whereas in 2015 it was -12.7°C. Similarly, in November 2016 it was -0.7°C, and -8.0°C in November 2013.
Maximum air temperature values exceeded 10–15°C; for example: in July 2015 (13.7°C), August 2015 (15.2°C) and September 2013 (10.6°C). In every month of the year, including winter, the temperature can rise above zero (Fig. 9). In winter thaw periods, it reached 5°C (5.9°C in December 2015). Only in July there was no frost (the lowest recorded temperature was 1.6°C in 2014). In the other months the temperature would drop to -23.8°C (February 2015).
During the year, there were on average 135.7 warm days with Tmin≥ 0°C on
Kaffiøyra, most often in July (31 days) and August (30.6 days) (Table 6). Days like that occurred even in winter (November–April): e.g. in March (0.3 day). Very warm days with Tmax ≥ 10°C were observed only from July (5.8 days
on average) to September (0.5 day). Frost days (Tmax ≥ 0°C and Tmin < 0°C)
occurred 58.7 times in a year. Ground frost was not observed in July, and was most frequent in May (10.3 days) and October (8.3 days). Days with Tmin < 0°C
accounted for 229.6 days in a year. They were the most frequent in March (30.7 days) and December (30.0 days). In winter, cold days prevail (Tmax < 0°C), e.g. in 26.0 days in March. During the year, 24-hour frost occurred in 171 days.
Minimum temperatures below -10°C were observed in 89 days, from October to May, reaching their peak frequency in March (18.3 days). Extreme cold days (Tmin < -20°C) were rare and occurred on average 5 times a year, from
December to March.
In the analysed period, there were particularly warm days, e.g. in July 2015 and 2016 10 days with Tmax ≥ 10°C were observed, and there were very
cold months, e.g. in February 2015 the temperature remained below -10°C for 24 days, 8 of which were with Tmin < -20°C.
Air humidity. — The location of the weather station on the beach of the
Greenland Sea makes it subject to maritime air masses and hence the high relative humidity. In the analysed period, the relative humidity of air reached 83% and did not vary much in individual years (Table 7).
The annual course of relative humidity is well expressed, with the highest values observed in summer (90% in August) and a lower saturation of air with water vapour in the cold half of the year (76% in December, 78% in April). In winter, sea ice cover increased around Svalbard, which substantially limits the supply of water vapour to the atmosphere. Sublimation from snow and ice covers is much less effective. In the time series of relative humidity, there are days with a sharp drop in the parameter (up to 65%) (Fig. 10). As shown in previous research, this is due to foehnisation processes that occur when air masses flow over the nearby mountains (Przybylak et al. 2012).
Table 6 Average monthly and yearly of days with specific air temperatures
on Kaffiøyra in 2013–2017. Days with: J F M A M J J A S O N D Y Tmax≥ 10°C . . . 5.8 2.2 0.5 . . . 8.5 Tmin≥ 0°C 1.8 2.0 0.3 0.5 6.5 26.7 31.0 30.6 23.2 9.3 2.8 1.0 135.7 Tmax≥ 0°C and Tmin < 0°C 6.0 6.3 4.8 2.0 10.3 3.0 . 0.4 5.0 8.3 7.3 5.5 58.9 Tmin < 0°C 29.2 26.3 30.7 29.5 24.5 3.3 . 0.4 6.8 21.7 27.2 30.0 229.6 Tmax < 0°C 23.2 20.0 26.0 27.5 14.2 0.2 . . 1.7 13.5 20.0 24.5 171.0 Tmin < –10°C 13.5 14.5 18.3 14.3 1.5 . . . . 2.8 10.3 14.0 89.0 Tmin < –20°C 1.0 2.5 1.0 . . . 0.5 5.0
The influence of atmospheric circulation and sea ice on air temperature. — The temperature conditions in the area of Svalbard are modified by the local atmospheric circulation (Przybylak et al. 2018) and the presence of sea ice around the archipelago (Gjelten et al. 2016). In this study, the distribution of the synoptic pressure field and the extent of sea ice were analysed for the warmest and the coldest months in individual seasons and years of the 2013–2017 period. In January, the highest mean air temperature was observed in 2014 (-3.9°C) (Table 5). In that month, the temperature remained above zero for a number of days. An averaged distribution of the synoptic pressure field shows a cyclonic trough between Svalbard and Greenland. A higher pressure area occurred east of the archipelago (Fig. 11). This kind of isobaric arrangement favours southerly
Table 7 Average monthly and yearly values of relative air humidity (%) on Kaffiøyra
in 2013–2017. Year J F M A M J J A S O N D Y 2013 87.0 77.4 75.6 70.1 2014 84.1 78.5 75.7 78.8 83.0 88.0 93.9 89.1 86.3 79.7 81.3 72.9 82.6 2015 77.2 78.6 82.0 76.2 85.1 85.2 85.2 90.4 92.0 87.7 77.7 79.0 83.0 2016 80.8 78.0 82.3 81.5 85.5 91.0 88.5 89.7 92.3 91.8 81.9 80.7 85.3 2017 74.7 79.2 82.9 76.4 82.5 91.9 90.0 89.9 2013–2017 79.2 78.6 80.7 78.2 84.0 89.0 89.4 89.8 89.4 84.1 79.1 75.7 83.1
advection of air masses. The sea to the west of Svalbard was not frozen over in that month. However, in January 2017, the mean air temperature was -10.6°C and remained below zero throughout the month, with periods of temperatures from -10°C to -15°C. The pressure field was different than in 2014: a low pressure area occurred over the east of Svalbard and a high developed over Greenland. That favoured an inflow of northern air masses. The sea ice, despite the low air temperature, occurred far in the north of Svalbard, whereas no ice cover built up around the archipelago or even on the Barents Sea.
In April, winter conditions remain on Svalbard. The mean air temperature in that month ranged from -9.0°C in 2014 to -5.2°C in 2015. In the exceptionally
Fig. 11. The course of air temperature on Kaffiøyra, the averaged atmospheric pressure field in January 2014 and 2017, and the concentration of sea ice on the 15th day of the month in the
Svalbard area. The source of maps: air pressure NCEP/NCAR – http://www.esrl.noaa.gov, sea ice concentration OSI SAF – http://osisaf.met.no.
cold April of 2014, the meridional arrangement of isobars indicates a prevalence of northerly advection (Fig. 12).
There was a barometric high over Greenland, and in the east of Svalbard, over the Barents Sea, the pressure was lower. By contrast, in the warm April of 2015, an area with lower pressure developed over the south of the archipelago. The sea ice situation was similar in both months. A stretch of ice-free sea surrounded the west coast of Svalbard, whereas on the east side, sea ice was carried by the East Spitsbergen Current from the north all the way to the southern end of Spitsbergen (Sørkapp).
In July, solar radiation reaches the ground all the time during the polar day, which stabilises temperature conditions. Nevertheless, there are some differences
Fig. 12. Time series of air temperature on Kaffiøyra, the averaged atmospheric pressure field in April 2014 and 2015, and the concentration of sea ice on the 15th day of the month in the
Svalbard area. The source of maps: air pressure NCEP/NCAR – http://www.esrl.noaa.gov, sea ice concentration OSI SAF – http://osisaf.met.no.
(Fig. 13). The warmest July in the analysed period was in 2016 (mean air temperature 7.7°C), and the coolest was in 2014 (5.9°C). There were considerable differences in the baric field and sea-ice extent between the two Julies. In the warm July (2016), the lower pressure area covered the south of Svalbard and sea ice occurred to the north. In the cool July (2014), Svalbard was affected by a high pressure wedge centred over the Barents Sea. The lowest pressure was observed in the west and north of the archipelago. Such an arrangement of pressure centres favoured easterly advection. Sea ice reached the north coast of Svalbard and even floated along the coast and around Sørkapp up north to the entrance of Isfjorden.
Fig. 13. Time series of air temperature on Kaffiøyra, the averaged atmospheric pressure field in July 2014 and 2016, and the concentration of sea ice on the 15th day of the month in the
Svalbard area. The source of maps: air pressure NCEP/NCAR – http://www.esrl.noaa.gov, sea ice concentration OSI SAF – http://osisaf.met.no.
In October winter begins in Svalbard. In 2014, the mean air temperature in that month was -1.1°C, and it was on average much cooler in 2013 (-4.5°C). The higher temperature of 2014 was due to the SE advection of air masses (Fig. 14). Looking at the maps of averaged pressure, the low was SW of Svalbard and there was higher pressure over the Barents Sea. Sea ice was maintained at the east coast and the north of the archipelago. In the colder October (2013), the isobars favoured NE advection. In spite of a low mean air temperature, the whole Barents Sea was free of sea ice and so was the sea around Svalbard. Synoptic atmospheric circulation that controlled the local air temperature rather than the sea ice. This indicates a greater impact of atmospheric circulation than the impact of sea ice on the air temperature at Kaffiøyra.
Fig. 14. Time series of air temperature on Kaffiøyra, the averaged atmospheric pressure field in October 2013 and 2014, and the concentration of sea ice on the 15th day of the month in the
Svalbard area. The source of maps: air pressure NCEP/NCAR – http://www.esrl.noaa.gov, sea ice concentration OSI SAF – http://osisaf.met.no.
The influence of wind direction on the weather. — The weather conditions on Spitsbergen are largely determined by the local air circulation. Different physical characteristics of incoming air masses cause a significant variability in weather conditions, both day to day and year to year (Przybylak et al. 2018).
On Kaffiøyra, the lowest mean air temperature occurred with eastern sector winds (E -6.7°C and ENE -6.6°C), and the highest occurred when the wind blew from the SSW (2.7°C) and SW (2.3°C). These relationships changed in individual seasons (Table 8). In spring, it was the warmest when the winds came from the SSW (-0.2°C), and the lowest temperatures were observed for E winds (-7.2°C). In summer, the warmest air came from the W (6.6°C), and the coldest from the N (4.4°C). In autumn, negative mean air temperatures were typical for days with winds blowing from the NNW to ESE, and the lowest mean temperature was observed for E (-2.8°C). The warmest air masses came from the SW (3.4°C). In winter, the coldest air blew from the NNE (-11.1°C), and SW winds brought warmer air (-0.8°C).
The relative humidity of the air also depended on the type of incoming air masses. During the year, the air coming from the south was the most saturated (93%), while eastern sector air (E and ENE) was the driest (72%). The differences between air masses were smallest in summer: from 77% (ENE) to 95% (S), and a bit bigger in winter: from 68% (ENE) to 92% (S). The southern sector winds brought the most humid air in all the seasons. The air came from ice-free waters of the Norwegian Sea and the Greenland Sea. On the other hand, the air coming from the east built up over the northern part of the Barents Sea, which was frozen-over for the most of the year. West of Spitsbergen, those air masses undergo foehnisation processes when they move over the mountainous interior of the island.
Air temperature trend. — Temperatures have been recorded continuously
on Kaffiøyra since 2005 (Przybylak et al. 2012). Also, a longer data series from the nearby Ny-Ålesund station (about 40 km to the north) could be used (eKlima Portal http://sharki.oslo.dnmi.no; Maturilli et al. 2013). The mean air temperature registered at that station in 2005–2017 (-3.3°C) was lower than on Kaffiøyra (-2.4°C). At both sites, the warmest month was July: 6.0°C and 6.3°C, respectively, and March was the coldest: -11.0°C and -8.4°C, respectively. On Kaffiøyra all months of the year were warmer, except for June, when the mean air temperature was the same (3.2°C) (Fig. 15). The higher temperature values on Kaffiøyra result not only from the difference in latitude but also from the influence of climatic factors (e.g. air circulation – foehnic effects).
The variability of air temperature at the two stations is substantially correlated. Pearson’s linear correlation coefficient in the years 2005–2017 has reached 0.993. Therefore, it was possible to use data sourced from Ny-Ålesund to reconstruct the Kaffiøyra data series for the period going back to 1975. That was carried
T
able 8
Mean values of air temperature and relative air humidity on Kaf
fiøyra
according to the wind direction in 2013–2017.
W ind direction W ind frequency (%) Air temperature (°C)
Air relative humidity (%)
AM JJA SO NDJFM YEAR AM JJA SO NDJFM YEAR AM JJA SO NDJFM YEAR N 14.7 22.9 11.2 9.7 14.3 -5.1 4.4 -0.5 -8.6 -1.4 80.5 89.2 86.6 81.3 85.2 NNE 7.3 5.2 6.9 10.1 7.8 -6.2 5.5 -0.9 -1 1.1 -5.9 75.2 85.3 83.3 75.7 78.5 NE 5.3 3.3 5.4 7.0 5.5 -5.9 5.9 -1.8 -9.4 -5.1 73.3 80.2 78.2 69.6 73.3 ENE 6.1 1.6 6.0 9.6 6.3 -6.7 5.5 -2.5 -9.0 -6.6 73.2 81.6 77.1 68.5 71.5 E 10.0 1.7 9.0 13.8 9.1 -7.2 4.6 -2.8 -8.6 -6.7 73.9 84.5 77.6 69.4 72.3 ESE 10.8 3.4 9.0 9.6 8.0 -5.6 5.3 -0.6 -7.0 -4.1 78.4 86.4 81.4 75.5 78.4 SE 13.0 9.7 12.1 11.2 11.3 -4.8 5.4 1.1 -5.0 -1.5 81.2 93.8 85.9 81.9 85.2 SSE 9.5 6.9 10.9 7.4 8.2 -2.9 5.1 1.8 -3.7 -0.4 87.0 92.5 88.8 84.3 87.6 S 7.0 11.1 12.9 7.1 9.1 -1.3 5.6 2.8 -2.4 1.6 91.1 94.6 94.2 91.6 93.2 SSW 1.5 5.3 3.1 1.9 3.0 -0.2 5.5 3.1 -1.6 2.7 90.9 89.9 92.6 88.5 90.1 SW 0.8 2.5 0.9 1.9 1.7 -0.5 6.1 3.4 -0.8 2.3 87.1 86.4 92.8 89.0 88.1 WSW 0.6 1.5 0.9 1.3 1.1 -0.8 5.7 2.8 -2.3 1.2 86.8 88.2 89.1 86.6 87.5 W 0.6 1.3 0.9 0.7 0.9 -2.1 6.6 2.9 -2.7 1.9 84.8 84.4 83.4 84.5 84.3 WNW 0.6 2.1 2.1 1.2 1.5 -2.1 6.0 1.5 -4.3 1.0 86.1 84.2 84.1 81.4 83.4 NW 3.6 10.8 3.5 2.1 4.9 -4.1 4.6 0.6 -5.2 1.4 86.9 88.1 83.6 85.3 87.0 NNW 8.8 10.8 5.4 5.4 7.4 -6.7 4.5 -1.0 -8.3 -2.1 80.7 87.3 83.4 80.8 83.6
out for the summer season (21 July–31 August) up to 2014 by Przybylak and Araźny (2016). For the purpose of this study, the data series has been extended to 2017.
The mean air temperature in summer on Kaffiøyra was 5.0°C. The warmest summer occurred in 2015 (6.6°C), and the coldest in 1982 (3.3°C). The temperature changed between seasons, and the standard deviation was determined at 0.74°C. In the analysed period of 1975–2017, there was a statistically significant (p < 0.05) air temperature increase of 0.29°C/10 years (Fig. 16). On Kaffiøyra, the air temperature in summer increased by 1.2°C over the last 43 years.
Fig. 15. Mean yearly courses of air temperature at Ny-Ålesund (NYA) and Kaffiøyra (KH) in 2005–2017.
Fig. 16. Time series of air temperature in summer season (21.07–31.08) on Kaffiøyra in 1975–2017. Observational data marked with circles; the remaining years were reconstructed on the basis of data from Ny-Ålesund. Source: Norwegian Meteorological Institute (eKlima Portal,
http://sharki.oslo.dnmi.no). Years
Discussion
The meteorological observations carried out on Kaffiøyra (NW Spitsbergen) in 2013–2017 confirm the fast rate of climate change. The air temperature in that area of the Arctic is quickly increasing (Przybylak 2016) and this warming is mainly caused by positive feedback mechanisms – Arctic amplification (Serreze and Barry 2011). The air temperature recorded in 1892–2012 at the Svalbard Lufthavn station in central Spitsbergen increased at a rate of 2.6°C/100 years (Nordli et al. 2014). Such changes are an effect of large-scale changes in atmospheric circulation, the type of incoming air masses and the changing extent and concentration of sea ice (Isaksen et al. 2016). Ocean currents play a major role in shaping the climate on the coast of Svalbard, bringing thermally diverse water (Walczowski and Piechura 2011). In the 21st century, the water
temperature in the fjords of western Spitsbergen is increasing, both in summer (up to 2°C/10 years) and in winter (approx. 1°C/10 years) (Orr et al. 2019).
The varied orography of the land and surface features affect the development of local air circulation and variable weather conditions (Kruszewski 2007). This has been proven in topoclimatic research conducted in various parts of the archipelago (Araźny et al. 2010, 2017).
The availability of a complete observational data series covering a few years (2013–2017) for the region of Kaffiøyra made it possible to identify climate conditions not only in summer but also in the other seasons.
The solar radiation conditions on Spitsbergen are determined by its polar location. During the polar day, as much as 30 MJ.m-2 reached the ground in
the form of solar radiation. The mean annual sum of solar energy registered on Kaffiøyra was 2,237.8 MJ.m-2, and it was clearly variable, ranging from
2,079.5 MJ.m-2 in 2016 to 2,409.9 MJ.m-2 in 2015. In the years 2013–2014,
the amount of solar radiation on Kaffiøyra reached 2,089.4 MJ.m-2 (Kejna et al. 2017). A positive trend in solar radiation was observed on Spitsbergen: for example, at Ny-Ålesund it reached 4.1 Wm-2/year for the years 1993–2010
(Maturili et al. 2015). The amount of incoming solar radiation is affected by the amount of cloud in a given year (Kejna et al. 2012).
The mean annual air temperature on Kaffiøyra was -2.0°C and ranged from -0.5°C in 2016 to -2.2°C in 2014. The annual amplitude of temperature was not high (14.4°C), which indicates a strong oceanic influence. During the year, there were on average 135.7 warm days (Tmin≥ 0°C) in the analysed period, while very warm days
(Tmax ≥ 10°C) occurred occasionally. Days with Tmin < -20°C occurred hardly ever
– there were 5 such days on average in a year. Frequent changes in air temperature from one day to the next are typical of the climate in that region. In winter, thawing weather is common and air temperature increases. A data series reconstructed based on Ny-Ålesund data for the summer expedition period (21 July–31 August) shows that the air temperature trend on Kaffiøyra is 0.28°C/10 years, and the warming in
1975–2017 reached 1.2°C. The trend is consistent with the findings for previous years (Przybylak and Araźny 2016). A similar positive trend was observed in other parts of Svalbard. For the period 1979–2015, the linear trends range from 1.0 to 1.38°C/10 years for the annual time series and from 2.0 to 2.38°C/10 years in winter (Gjelten et al. 2016). In Ny-Ålesund, the mean annual temperature trend in 1988–2017 reached 1.4°C/10 years (Orr et al. 2019).
The relative humidity of the air was quite high (average 83%), with a minimum occurring in the cold half of the year (76%, December). In summer, the air is saturated with water vapour at 90% (August). There are foehnic episodes in the time series of relative humidity, where the saturation of air falls to only 50%–60%.
The anemometric conditions in the area of Kaffiøyra are shaped by the overall synoptic situation and local orography and winds (glacial wind, foehns; Kruszewski 2007). The Venturi effect further modifies the direction of air masses to coincide with the orientation of Forlandsundet – most air comes from the northern or southern sector (Przybylak et al. 2012). The seasonal differences result from redevelopment of the synoptic pressure field in the area of Svalbard. An increase in the frequency of incoming eastern air masses in winter was confirmed by reanalysis results for NW Spitsbergen (Strzyżewski and Ulandowska-Monarcha 2016). The mean wind speed was low (3.6 m.s-1),
but wind speeds exceeding 30 m.s-1 also occurred. The wind speed in NW
Spitsbergen increased by 0.5 m.s-1 during the last 100 years (Strzyżewski and
Ulandowska-Monarcha 2016). At the Ny-Ålesund station, based on NCEP/NCAR and ERA-Interim reanalysis data, Pilguj et al. (2019) found that the wind velocity in that region increased. In the years 1986–2015, there was a falling trend in the number of days with low wind speeds (≤ 2 m.s-¹) while the frequency of
high wind speeds (> 10 m.s-¹) increased.
On Kaffiøyra, the air temperature and humidity are mainly defined by wind direction and type of incoming air mass. The lowest mean temperature occurred with the wind blowing from the eastern sector (6.7°C) and the highest was recorded for SSW winds (2.7°C). This dominant influence of circulation on temperature conditions is confirmed in the analysis of synoptic pressure field distribution maps for the exceptionally warm and cold months. In all seasons, unusually warm months coincided with southerly advection of air masses with low pressure centres situated west or south of Svalbard. On the other hand, at the time of prevalence of low pressure centres over the Barents Sea (east of Svalbard) very cold air masses come from the north. Winter is the time when the influence of atmospheric circulation on air temperature is particularly evident (Przybylak et al. 2012; Niedźwiedź and Łupikasza 2015; Isaksen et al. 2016). In summer, the temperature decreases because of a barometric high over the Barents Sea and easterly advection. However, on Kaffiøyra, due to foehnic effects, the air masses moving across the mountainous interior of Spitsbergen in
summer become warmer (Przybylak and Araźny 2016). As shown by Niedźwiedź and Łupikasza (2015), in the area of Spitsbergen, there was an increase in the frequency of occurrence of cyclonic centres and the share of westerly advection in the period 1950–2015. Isaksen et al. (2016) found that the recent warming was not driven by increased frequencies of “warm” atmospheric circulation types but rather from sea ice decline, higher sea surface temperatures, and a general background warming (Overland and Wang 2005; Isaksen et al. 2016).
Sea-ice cover and the associated sea-surface temperature have a large influence on the air temperature (Isaksen et al. 2016). However, no direct connection was found between temperature conditions on Kaffiøyra and the extent and concentration of sea ice. The ice moves along the east coast of Svalbard carried by the East Spitsbergen Current. The west coast is often free of ice (as a result of the influence of the warm West Spitsbergen Current). In some unusually cold months, more sea ice develops to the north of Svalbard than in warmer months. Atmospheric warming observed in Spitsbergen is driven by heat exchange from the larger open water area in the Barents Sea and region north of Spitsbergen. (Isaksen et al. 2016). The magnitude of changes in temperature demonstrates local conditioning, e.g. stronger warming at Svalbard Lufthavn in comparison to other stations on Spitsbergen (Gjelten et al. 2016).
The climate changes are causing disturbances in the functioning of the environment of Kaffiøyra. The ground temperature is increasing (Araźny et al. 2016). On Svalbard, the increase in the temperature of the surface layer of permafrost reached 1–2°C during the last 6 to 8 decades of the 20th century
(Isaksen et al. 2007). Research carried out on Hornsund (South Spitsbergen) shows that the temperature increase has accelerated markedly in recent years (Wawrzyniak et al. 2016). On Kaffiøyra, mean values of the observed near-surface temperature in 2007–2011 were more than 1.0°C higher than in the earlier years (Sobota and Nowak 2014). As in the other parts of Svalbard (Etzelm̈uller
et al. 2011), the permafrost is being thawed to a greater depth. In 1996–2012, on the beach and on the moraine the trend of change in the active layer thickness was +1.3 cm.yr-1 and +2.5 cm.yr-1, respectively (Sobota and Nowak 2016; Sobota et al. 2018). The glaciers are retreating faster and their total surface area on Svalbard has shrunk by 80 km2 (7%) over the last 30 years (Nuth et al. 2013).
In the Kaffiøyra area, changes are even more profound – deglaciation reached 42% (Sobota at al. 2016a). The rate of deglaciation is largely affected by weather conditions in the ablation season (Sobota 2011, 2013; Małecki 2015) and mid-winter warming periods with rainfall (Sobota 2017; Łupikasza et al. 2019).
Acknowledgements. — The authors would like to thank all members of the Nicolaus
Copernicus University expeditions to Svalbard for their assistance in fieldwork as well as Krzysztof Migała and an anonymous reviewer for constructive advice that helped to improve the manuscript. This study was carried out as part of the project funded
by the National Science Centre, Poland (2017/25/B/ST10/00540) entitled Changes of north-western Spitsbergen glaciers as the indicator of contemporary transformations occurring in the cryosphere.
References
AMBROŽOVÁ K. and LÁSKA K. 2017. Air temperature variability in the vertical profi le over the coastal area of Petuniabukta, central Spitsbergen. Polish Polar Research 38: 41–60.
ARAŹNY A. 2019. Temporal and spatial variability of thermal and humidity stimuli in the Hornsund area (Svalbard). Polish Polar Research 40: 29–53.
ARAŹNY A., MIGAŁA K., SIKORA S. and BUDZIK T. 2010. Meteorological and biometeorological conditions in the Hornsund area (Spitsbergen) during the warm season. Polish Polar Research
31: 217–238.
ARAŹNY A., PRZYBYLAK R. and KEJNA M. 2016. Ground temperature changes on the Kaffi øyra Plain (Spitsbergen) in the summer seasons, 1975–2014. Polish Polar Research 37: 1–21. ARAŹNY A., PRZYBYLAK R., WYSZYŃSKI P., WAWRZYNIAK T., NAWROT A. and BUDZIK T. 2017.
Spatial variations in air temperature and humidity over Hornsund fjord (Spitsbergen) from 1 July 2014 to 30 June 2015. Geografi ska Annaler: Series A, Physical Geography 100: 1–17. BEDNORZ E. and KOLENDOWICZ L. 2010. Summer 2009 thermal and bioclimatic conditions in Ebba
valley, Central Spitsbergen. Polish Polar Research 31: 327–348.
CISEK M., MAKUCH P. and PETELSKI T. 2017. Comparison of meteorological conditions in Svalbard fjords: Hornsund and Kongsfjorden. Oceanologia 59: 413–421.
EASTMAN R. and WARREN S.G. 2010. Arctic cloud changes from surface and satellite observations.
Journal of Climate 23: 4233–4242.
ETZELMÜLLER B., SCHULER T.V., ISAKSEN K., CHRISTIANSEN H.H., FARBROT H. and BENESTAD R. 2011. Modeling the temperature evolution of Svalbard permafrost during the 20th and 21st century. The Cryosphere 5: 67–79.
GJELTEN H.M., NORDLI Ø., ISAKSEN K., FØRLAND E.J., SVIASHCHENNIKOV P.N., WYSZYNSKI P., PROKHOROVA U.V., PRZYBYLAK R., IVANOV B.V. and URAZGILDEEVA A.V. 2016. Air temperature variations and gradients along the coast and fjords of Western Spitsbergen. Polar
Research 35: 29878.
ISAKSEN K., NORDLI Ø., FØRLAND E.J., ŁUPIKASZA E., EASTWOOD S. and NIEDŹWIEDŹ T. 2016. Recent warming on Spitsbergen - Infl uence of atmospheric circulation and sea ice cover.
Journal of Geophysical Research Atmospheres 121: 11,913–11,931.
KALNAY E., KANAMITSU M., KISTLER R., COLLINS W., DEAVEN D., GANDIN L., IREDELL M., SAHA S., WHITE G., WOOLLEN J., ZHU Y., LEETMAA A., REYNOLDS B., CHELLIAH M., EBISUZAKI W., HIGGINS W., JANOWIAK J., MO K.C., ROPELEWSKI C., WANG J.J. and ROY J.D.
1996. The NCEP/NCAR 40-year reanalysis project. Bulletin of the American Meteorological
Society 77: 437–470.
KEJNA M. 2012. Primary climatic controls. In: R. Przybylak, A. Araźny and M. Kejna (eds)
Topoclimatic diverisity in Forlandsundet region (NW Spitsbergen) in global warming
conditions. Ofi cyna Wydawnicza “Turpress”, Toruń: 17–25.
KEJNA M., PRZYBYLAK R. and ARAŹNY A. 2012. The infl uence of cloudiness and synoptic situations on the solar radiation balance in the area of Kaffi øyra (NW Spitsbergen) in the summer seasons 2010 and 2011. Bulletin of Geography 5: 77–95.
KEJNA M., MATURILLI M., ARAŹNY A. and SOBOTA I. 2017. Radiation balance diversity on NW Spitsbergen in 2010–2014. Polish Polar Research 38: 62–82.
KÄSMACHER O. and SCHNEIDER C. 2011. An objective circulation pattern classifi cation for the region of Svalbard. Geografi ska Annaler Series A Physical Geography 93: 259–271.
KENDZIERSKI S., KOLENDOWICZ L. and PÓŁROLNICZAK M. 2018. The infl uence of synoptic conditions patterns on air temperature and humidity in Petuniabukta (Svalbard) in summer 2016. Polish Polar Research 39: 371–392.
KRUSZEWSKI G. 2007. The changes of zonal wind speed component (U-wind) east of Svalbard area (1981–2005). Problemy Klimatologii Polarnej 17: 77–85 (in Polish).
LANKAUF K.R. 2002. Recesja lodowców rejonu Kaffi øyry (Ziemi Oskara II – Spitsbergen) w XX wieku. Prace Geografi czne 183, Warszawa, 221 pp. (in Polish).
LÁSKA K., WITOSZOVÁ D. and PROŠEK P. 2012. Weather patterns of the coastal zone of Petuniabukta, central Spitsbergen in the period 2008–2010. Polish Polar Research 33: 297–318.
LESZKIEWICZ J. 1977. Meteorological conditions in the northern part of Kaffi øyra Plain during the period from July 1 to August 21, 1975. Acta Universitatis Nicolai Copernici, Geografi a 23: 98–111.
ŁUPIKASZA E.B., IGNATIUK D., GRABIEC M., CIELECKA-NOWAK K., LASKA M., JANIA J., LUKS B., USZCZYK A. and BUDZIK T. 2019. The Role of Winter Rain in the Glacial System on Svalbard.
Water 11: 334.
MAŁECKI J. 2015. Glacio-meteorology of Ebbabreen, Dickson Land, central Svalbard, during 2008– 2010 melt seasons. Polish Polar Research 36: 145–161.
MATURILLI M., HERBER A. and KÖNIG-LANGLO G. 2013. Climatology and time series of surface meteorology in Ny-Ålesund, Svalbard. Earth System Science Data 5: 155–163.
MATURILLI M., HERBER A. and KÖNIG-LANGLO G. 2015. Surface radiation climatology for Ny-Ålesund. Svalbard (78.9°N) basic observations for trend detection. Theoretical and Applied
Climatology 120: 331–339.
MEIER W., HOVELSRUD G., VAN OORT B., KEY J., KOVACS K., MICHEL C., HAAS C., GRANSKOG M., GERLAND S.K., PEROVICH D., MAKSHTAS A. and REIST J. 2014. Arctic sea ice in transformation: A review of recent observed changes and impacts on biology and human activity. Reviews of
Geophysics 52: 185–217.
NIEDŹWIEDŹ T. 2006. The main forms of atmospheric circulation above Spitsbergen (December 1950–September 2006). Problemy Klimatologii Polarnej 16: 91–105 (in Polish).
NIEDŹWIEDŹ T. and ŁUPIKASZA E. 2015. Dynamics of circulation indices over Spitsbergen. Problemy
Klimatologii Polarnej 25: 153–167 (in Polish).
NORDLI Ø., PRZYBYLAK R., OGILVIE A.E. and ISAKSEN K. 2014. Long-term temperature trends and variability on Spitsbergen: the extended Svalbard Airport temperature series, 1898–2012. Polar
Research 33: 21349.
NUTH C., KOHLER J., KÖNIG M., VON DESCHWANDEN A., HAGEN J.O., KÄÄB A., MOHOLDT G. and PETTERSSON, R. 2013. Decadal changes from a multi-temporal glacier inventory of Svalbard.
The Cryosphere 7: 1603–1621.
ORR E., HANSEN G., LAPPALAINEN H., HÜBNER C. and LIHAVAINEN H. (eds) 2019. SESS report
2018. The State of Environmental Science in Svalbard – an annual report. Svalbard Integrated
Arctic Earth Observing System, Longyearbyen: 214 pp.
OSBORNE E., RICHTER-MENGE J. and JEFFRIES M. (eds) 2018. Arctic Report Card 2018. https:// www.arctic.noaa.gov/Report-Card.
OVERLAND J.E. and WANG M. 2005. The Arctic climate paradox: The recent decrease of the Arctic Oscillation. Geophysical Research Letters 32(L06701): 1–5.
PILGUJ N., KOLENDOWICZ L., KRYZA M., MIGAŁA K. and CZERNECKI B. 2019. Temporal changes in wind conditions at Svalbard for the years 1986–2015. Geografi ska Annaler: Series A, Physical
Geography 101: 136–156.
PRZYBYLAK R. 2016. The Climate of the Arctic, Vol. 287. Springer, Heidelberg, New York, Dordrecht, London: 287 pp.
PRZYBYLAK R. and ARAŹNY A. 2016. Warming and drying of tundra and glacier summer climate in NW Spitsbergen from 1975 to 2014. Polish Polar Research 37: 173–192.
PRZYBYLAK R., ARAŹNY A. and KEJNA M. (eds) 2012. Topoclimatic diverisity in Forlandsundet
region (NW Spitsbregen) in global warming conditions. Ofi cyna Wydawnicza “Turpress”,
Toruń: 174 pp.
PRZYBYLAK R., ARAŹNY A., NORDLI Ø., FINKELNBURG R., KEJNA M., BUDZIK T., MIGALA K., SIKORA S., PUCZKO D., RYMER K. and RACHLEWICZ G. 2014. Spatial distribution of air temperature on Svalbard during 1 year with campaign measurements. International Journal of
Climatology 34: 3702–3719.
PRZYBYLAK R., ARAŹNY A. and ULANDOWSKA-MONARCHA P. 2018. The infl uence of atmospheric circulation on the spatial diversity of air temperature in the area of Forlandsundet (NW Spitsbergen) during 2010–2013. International Journal of Climatology 38: 230–251.
SCREEN J.A. and SIMMONDS I. 2010. The central role of diminishing sea ice in recent Arctic temperature amplifi cation. Nature 464: 1334–1337.
SERREZE M.C. and BARRY R.G. 2011. Processes and impacts of Arctic amplifi cation: A research synthesis. Global Planet Change 77: 85–96.
SHUPE M.D., WALDEN V.P., ELORANTA E., UTTAL T., CAMPBELL J.R., STARKWEATHER S.M. and SHIOBARA M. 2011. Clouds at Arctic Atmospheric Observatories – Part I: Occurrence and macrophysical properties. Journal of Applied Meteorologyand Climatology 50: 626–644. SOBOTA I. 2011. Snow accumulation, melt, mass loss, and the near-surface ice temperature structure
of Irenebreen, Svalbard. Polar Science 5: 321–336.
SOBOTA I. 2013. Contemporary changes of the cryosphere of north-western Spitsbergen based on
the example of the Kaffi øyra region. Wydawnictwo Naukowe UMK, Toruń: 459 pp. (in Polish).
SOBOTA I. 2017. Selected problems of snow accumulation on glaciers during long-term studies in north-western Spitsbergen, Svalbard. Geografi ska Annaler: Series A, Physical Geography 99: 177–192.
SOBOTA I. and NOWAK M. 2014. Changes in the dynamics and thermal regime of the permafrost and active layer of the High Arctic coastal area in North-West Spitsbergen. Svalbard. Geografi ska
Annaler: Series A, Physical Geography 96: 227–240.
SOBOTA I., NOWAK M. and WECKWERTH P. 2016a. Long-term changes of glaciers in north-western Spitsbergen. Global and Planetary Changes 144: 182–197.
SOBOTA I., WECKWERTH P. and NOWAK M. 2016b. Surge dynamics of Aavatsmarkbreen, Svalbard, inferred from the geomorphological record. Boreas 45: 360–376.
SOBOTA I., WECKWERTH P., GRAJEWSKI T., DZIEMBOWSKI M., GREŃ K. and NOWAK M. 2018. Short-term changes in thickness and temperature of the active layer in summer in the Kaffi øyra region, NW Spitsbergen, Svalbard. Catena 160: 141–153.
STAMMERJOHN S., MASSOM R., RIND D. and MARTINSON D. 2012. Regions of rapid sea ice change: An inter-hemispheric seasonal comparison. GeophysicalResearchLetters 39(L06501): 1–8. STRZYŻEWSKI T. and ULANDOWSKA-MONARCHA P. 2016. Variability of Wind Speed and Direction
over the NW Spitsbergen in the period 1901-2010 using Era-20C reanalises. Przegląd
Geofi zyczny 1–2: 31–44 (in Polish).
TURNER J. and MARSHALL G.J. 2011. Climate Change in the Polar Regions. Cambridge University Press, Cambridge, 434 pp.
WALCZOWSKI W. 2007. Warm anomalies propagation in the West Spitsbergen Current. Problemy Klimatologii Polarnej 17: 71–76 (in Polish).
WALCZOWSKI W. and PIECHURA J. 2011. Infl uence of the West Spitsbergen Current on the local climate. International Journal of Climatology 31: 1088–1093.
WAWRZYNIAK T., OSUCH M., NAPIÓRKOWSKI J. and WESTERMANN S. 2016, Modelling of the thermal regime of permafrost during 1990–2014 in Hornsund, Svalbard. Polish Polar Research
37: 219–242.
Received 16 March 2019 Accepted 20 May 2019