Six Sigma-Based Approach to Improve Performance
in Construction Operations
Seung Heon Han, M.ASCE
1; Myung Jin Chae, Ph.D., P.E.
2; Keon Soon Im, P.E.
3; and Ho Dong Ryu
4Abstract:Many researchers and project managers have attempted to improve project performance by applying new philosophies such as lean principle, just-in-time, pull scheduling, and last planner. However, very little research has been conducted on setting definite quantitative goals for performance improvement while considering the defect rate involved in the construction operations. This research explores practical solutions for construction performance improvement by applying the six sigma principle. This principle provides the metrics required to establish performance improvement goals and a methodology for measuring and evaluating improvement. The proposed approach is expected to achieve more reliable workflows by reducing process variability to fit in a desirable range—thereby improving the overall performance through the evaluation of the quality level in current construction operations. To verify the suggested methodology, two case studies have been presented and process simulation analyses are performed to observe the performance changes based on the six sigma principle. Critical total quality control, as the sigma level rises, is also discussed.
DOI:10.1061/共ASCE兲0742-597X共2008兲24:1共21兲
CE Database subject headings:Quality control; Simulation; Productivity; Construction management.
Introduction
In the pursuit of productivity improvement, it is important to en-sure the quality of work processes to enhance the overall reliabil-ity and stabilreliabil-ity of construction operations. There have been a number of construction productivity improvement principles such as lean production, just-in-time 共JIT兲, rapid machinery changeovers, pull scheduling, last planner, etc. 共Thomas et al. 2003兲. Despite the successful applications, however, most of the results fell short of our expectations of a quantitative and practical method or metrics for assessing the defect rates of construction operations.
The defect rate in construction processes is largely caused by unreliable workflow when sources of process variability are in-volved 共Tommelein 2000; Hopp and Spearman 2000; Howell et al. 2001; Thomas et al. 2002兲. The lean principle attempts to address the effect of variability, but not to eliminate or reduce variability by removing the root causes of the whole共Abdelhamid 2003兲. In order to estimate the defect rates involved in construc-tion operaconstruc-tions in a more quantitative and organized way, this research applies the six sigma principle. The six sigma principle
has been an effective statistical-based methodology in measuring the defect rate in an attempt to maintain a high-standard quality level, particularly in construction materials. This study focuses on the development of the general methodology to apply the six sigma principles on construction operations rather than construc-tion materials in terms of the barometers to measure, evaluate, and improve construction performance.
This study also pursues process effectiveness differently from an existing efficiency-oriented approach that is simply an average production divided by time or resources while disregarding the variation of the production rate and resource usage. We investi-gate the concept that the reduction of variability in view of pro-cess effectiveness共i.e., stable resource usage, reduced variation in cycle time, etc.兲will improve project performance through such outputs as the drop of cycle time, enlargement of productivity, optimization of buffer size, etc.
Typically, project performance is measured after a project is completed so it might be difficult to improve process effective-ness without a definite goal for performance improvement. In this sense, a project manager must have a before-the-fact performance indicator to measure the project performance of an ongoing project. In this paper, this “performance indicator” is called six sigma. Project managers can use it to establish an explicit goal as well as to evaluate the level of project performance nearly perfectly.
To achieve its end, methodology requires several steps: 共1兲 development of the six sigma principle strategy and procedure; 共2兲establishment of quantitative metrics based on the six sigma principle approach;共3兲test of a series of case studies and process simulation analysis on six sigma principle applications to verify the principle; 共4兲 discussion of the simulation results; and 共5兲 provision of a generalized guideline to expand the application of six sigma principle for performance improvement. Among a va-riety of types of construction projects, this research is focused on a simple and repetitive construction process as an exploratory application. The proposed principle is also intended to be appli-cable to construction operations with more complex processes.
1
Associate Professor, Dept. of Civil & Environmental Engineering, Yonsei Univ., Seoul 120-749, Korea 共corresponding author兲. E-mail: [email protected]
2
Senior Researcher, Korean Institute of Construction Technology, Seoul, Korea. E-mail: [email protected]
3
Manager, Daelim Industrial Construction Company, Seoul, Korea. E-mail: [email protected]
4
Engineer, Hyundai Engineering and Construction Co., Seoul, Korea. E-mail: [email protected]
Note. Discussion open until June 1, 2008. Separate discussions must be submitted for individual papers. To extend the closing date by one month, a written request must be filed with the ASCE Managing Editor. The manuscript for this paper was submitted for review and possible publication on November 27, 2006; approved on May 11, 2007. This paper is part of theJournal of Management in Engineering, Vol. 24, No. 1, January 1, 2008. ©ASCE, ISSN 0742-597X/2008/1-21–31/$25.00.
Background of Six Sigma Principle
Recently, many organizations have attempted to achieve customer satisfaction. One of the most important aspects of customer satis-faction is achieved through a high quality product, which also means a low defect product. Traditionally, defects include prod-ucts containing a flaw in the manufacturing process, customer dissatisfaction in the service department, or documentation errors in an office. Lindermann et al.共2003兲stated that six sigma prin-ciple is a statistics-based methodology that relies on the scientific method to make significant reductions in customer-defined defect rates in an effort to eliminate defects from every product, process, and transaction.
The six sigma principle can be represented on a normally dis-tributed product quality distribution curve. When the mean is lo-cated at the center of the normal distribution curve, the lower and upper limits are six times the standard deviation共sigma兲from the center line. In other words, the range of the lower or upper limit defect is ±6 sigma from the mean. Ultimately, it aims to keep the defect rates under 0.002 parts per million 共ppm兲 共1 / 106兲. If the data set falls within ±3 sigma from the mean as the upper and lower specification limits, it represents a 2,700 ppm共0.27%兲 de-fect rate that is considerably larger than 0.002 ppm. Specifically, assuming that the ideal mean is moved up to ±1.5 sigma, it ad-justs the defect rate into 3.4 ppm within the quality level of ±6 sigma. Motorola used it 共3.4 ppm兲as the target level of the six sigma principle movement共Lindermann et al. 2003兲. It signifies only 3.4 defects/million parts or operations. Comparatively, this level is equivalent to one misspelled word in all the books in a small library, while the current quality level, as an example of 4 sigma, represents approximately one misspelled word per every 30 pages共Breyfogle et al. 2001兲. While the 3.4 ppm defect rate is considered an inappropriate goal for construction operations, the fundamental concept of taking the six sigma principle’s statistical definition associated with minimizing the defect rates along with different sigma levels and the continuous pursuit of performance improvement can be a drastic extension of the traditional ap-proaches for achieving a high level of process quality.
Six sigma principle initiatives are implemented through a problem-solving framework such as “define-measure-analysis-improvement-control” 共DMAIC兲 共Harry and Schroeder 2000; Ahn 2000兲. It emphasizes the identification and avoidance of variations. Moreover, six sigma principle underlines the explicit recognition of the root causes of defects and statistical process control to sustain continuous improvements共Abdelhamid 2003兲. Each step includes the following concepts:共1兲Define: what prob-lem needs to be solved and what are the critical customer require-ments and key factors affecting process output? 共2兲 Measure: what is the relevant data to the problem and what is the current performance based on a sigma calculation? 共3兲Analyze: when, where, and why do defects occur and what are the root causes? 共4兲 Improve: how can the problem be solved using alternatives derived in the analysis phase? 共5兲 Control: how can sustainable quality improvements be made through the institutionalization of the improved process?
In the construction industry, the use of the six sigma principle for performance assessments, particularly aimed at high quality and variability control, first appeared in 2000. Buggie共2000兲 in-troduced the six sigma principle as one of the approaches to aug-menting productivity, which concentrated on reducing cycle time and eliminating any defects or errors engaged in the processes. Kroslid共2002兲explained how six sigma principle and lean prin-ciple can be combined and used in a beneficial way to achieve
outstanding performance. He also demonstrated that the synergies and advantages for such a merger have been assessed as strong. Abdelhamid共2003兲also suggested a six sigma principle applica-tion and research opportunities to reduce the variability in lean construction. More recently, Cha and O’Connor共2005兲described the six sigma principle as one of 44 state-of-the-practice tools for value management applicable to a construction project, based on the identification efforts conducted by the Construction Industry Institute共CII兲 project team 184. However, best research studies have been limited to the description of the six sigma principle and almost no project-oriented construction case study has been re-ported as a discipline to improve construction performance, while maintaining a high quality of products. Further, current applica-tions of six sigma principle do not focus on construction opera-tions, but rather on construction materials, safety, or health.
Framework for Six Sigma Principle Implementation In contrast to the manufacturing industry, construction work is characterized by its fragmented and project-oriented work pro-cesses. For successful application of the six sigma principle, this paper presents a framework to provide guidelines for six sigma principle implementation for construction operations.
Integration of Six Sigma Principle and Lean Construction Technique
To take advantage of existing techniques, a combination of two techniques—the six sigma principle and lean construction—is suggested for both productivity and quality improvement at the same time. Combining these two principles is not a new idea. There are examples of combining lean manufacturing with the six sigma principle in a manufacturing process. Steelcase Co. achieved improvements in cost, quality, and time reduction through incorporating a lean manufacturing system and statistical tools 共DFSS 2002兲. In addition, Kroslid 共2002兲 concluded that integration of both lean and six sigma principle can result in an improved performance. More specifically, Abdelhamid 共2003兲 suggested a conceptual six sigma principle application in lean construction using a lean project delivery system 共LPDS兲 devel-oped by Ballard共2000兲. He demonstrated how lean construction can show better results when combined with six sigma principle concepts.
Even though lean construction alone has provided the idea of viewing production as a flow and led to the principle of removing waste to achieve better workflow 共Howell and Ballard 1994; Howell 1999兲, it does not clearly show the underlying mechanism of how to measure the level of defects in the current work pro-cesses. Lean construction also cannot set a quantitative goal to improve this workflow by removing the critical causes of defects in process variability.
For example, in the specific case of inventory management, typical lean production or JIT philosophy attempts to attain “near zero inventories” rather than finding an optimal level of inventory so many researchers raised the question about the size of resource buffers to achieve the best performance in a volatile and uncertain construction environment 共Ballard and Howell 1995; Al-Sudairi et al. 1999; Pheng and Chuan 2001; Sakamoto et al. 2002兲. Spe-cifically, based on the observations from three real projects, Hor-man and Thomos共2005兲concluded that productivity deteriorated when inventory size and time lag became zero. This fact implies that inventory management aiming at JIT is a challenging task in
construction when the uncertainties of a look-ahead schedule and work process variability are inherently involved. Table 1 explains the main differences between lean and six sigma principle in view of inventory management.
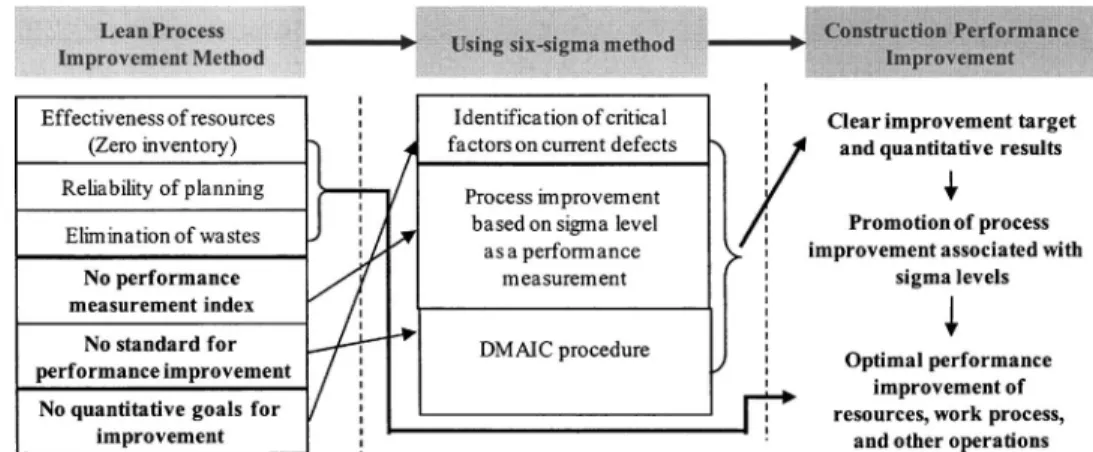
Based on the previous attempts on this issue, this paper complements the limits of lean principle by presenting the meth-odological metrics to set a definite goal of improvements and to reduce the process variability through the evaluation of quality level共six sigma indicator兲in current construction operations. Ac-cordingly, it is necessary to evaluate the quality of the current operation and to quantify the definite goals of improvements for the targeted operation so as to control the critical sources of vari-ability. Fig. 1 presents an approach for combining lean and six sigma principle in this aspect. As for the previous example of inventory management, this paper suggests a reasonably sized resource buffer rather than the “near zero inventory” which can be achieved through:共1兲minimizing wastes based on the lean con-struction; and 共2兲 establishing quantitative targets of process variations and defect measurements based on the six sigma prin-ciple application.
Six Sigma Principle Performance Indicators„Metrics… A performance measurement system should be developed prior to the six sigma principle deployment. The key activities of the per-formance measurement system are: 共1兲 setting up a company-wide quality control strategy and policies; and 共2兲 arranging performance indicators based on that strategy. In order to set up performance indicators, it is necessary to identify activities and key factors that are critical to the success of the project at each construction phase. Toward this end, critical total quality共CTQ兲 is the most closely related element to a process performance in-dicator. For example, if “productivity” is a performance indicator for a certain project, the reliability of the resource flow can be assumed to be a main CTQ because it has the closest association
with productivity. In implementing six sigma principle, CTQ is a main input variable, particularly in the phases of DMAIC. Through defining and measuring the status of various CTQs such as variations in cycle time, idle, or waiting time of labor/ equipment, excess or shortage of inventory共buffer size兲, and per-cent of earned value achieved, we can evaluate the level of sigma in the work process and identify the root causes of defects that deteriorate the work performance.
To compare the quality level of the work process associated with CTO, a six sigma principle metric should be clarified. Of the several available six sigma principle metrics, this paper adopts the process capability index共CP兲because it provides upper and lower
boundaries based on the company’s quality control strategy and policies. According to Ahn共2000兲, sigma level is obtained byCP
that is described by the following expression on the assumption that quantitative data for the CTQ evaluation can be collected continuously without any serious bias. If only the upper bound is given for the purpose of controlling the defect rate of CTQ, we can calculate the CPby setting up a goal for the allowable
per-formance level 共so-called, upper specification level兲and then by using the mean and standard deviation from the collected data. Based on the estimatedCP, we can evaluate the sigma level of the
current CTQ of a specified work process CP共process capability index兲=
USL − MEAN
3⫻STDEV 共1兲 If only USL given
共sigma level兲= 3⫻CP 共2兲
where USL= upper specification limit; MEAN= mean of the data; and STDEV= standard deviation of the data.
As an example, suppose that the cycle time for earthmoving is highly variable due to various external factors such as traffic and access road conditions. The mean and standard deviation value
Table 1.Comparative Views in Inventory Management
Items Lean Six sigma
Resource management objectives Near zero resource buffer Optimum resource buffer for maximum productivity Methods Minimization of the cost of redundant resources and
increasing the reliability of the process through JIT technique
Reduction of the total project cost by maintaining the optimum resource buffer and eliminating the loss of
productivity caused by the resource shortage Usefulness Inadequate for the construction process which has many
uncertainties and discontinuous activities
Adequate for the construction process and useful for a resource management plan
are estimated as 30 and 20 min, respectively. In this case, the CTQ is defined as the variation in cycle time. The allowable performance level for the cycle time variation is arranged to a maximum of 25 min from the mean time to maintain quality workflow. Based on these assumptions, the current CP is
mea-sured as 0.42关=共55− 30兲/共3⫻20兲兴. Accordingly, due to the fact that the current sigma level of CTQ is very low 共= 3⫻0.42 = 1.26 sigma兲, the next target should focus on how to improve the quality level of CTQ to achieve a better work performance. Basic Framework for Six Sigma Principle-Based Management
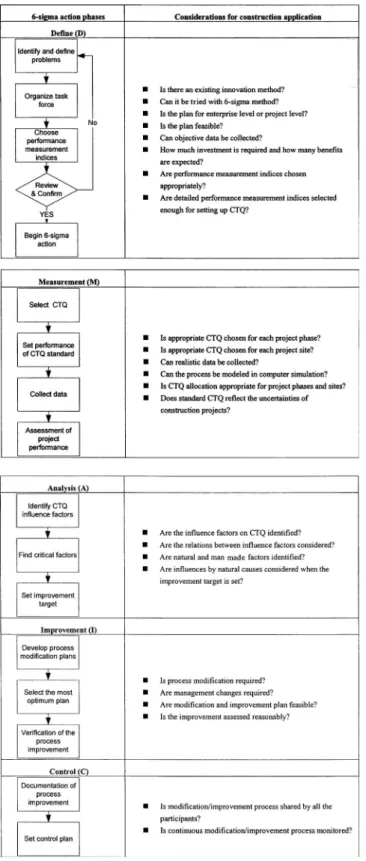
Based on existing techniques in manufacturing process improve-ment, the six sigma principle is used in construction operations according to the strategies described in the previous sections. As shown in Fig. 2, the six sigma principle concept can be applied to the construction process control within the basic framework of CTQ inputs, DMAIC procedures, and output measures.
The process activities that cause production drops or defect increases are identified by continuously monitoring the outputs of the DMAIC steps while the input values change. Since construc-tion projects have more uncertainties than manufacturing pro-cesses, a strict six sigma principle level for factor variability con-trol should be appropriately modified. Instead, it is more importantly considered an application of new management think-ing that takes the six sigma principle’s statistical definition asso-ciated with minimizing the defect rates through a control of CTQ. In this view, Fig. 2 shows the modified DMAIC in a six sigma principle process to fit in the construction operations. As stated earlier, this research integrates the advantages of lean and six sigma principle thinking in an attempt to improve the perfor-mance output. Fig. 2 also defines the input indices and subse-quently measures the sigma level of CTQ. Then, appropriate means for the improving the quality level of CTQ through mini-mizing wastes and reducing variability are provided. Finally, the framework presents the quantitative improvement targets based on the six sigma principle metrics by controlling CTQ as the sigma level rises.
Case Study 1: Iron-Reinforced Bar Assembling Process
To demonstrate the six sigma-based management strategy inte-grated with lean construction, we have conducted two case
stud-ies. The assembling process is common in both manufacturing and construction work. In this research, the assembling process in a construction project that builds 765 kV power transmission lines was chosen as the first sample application to the lowest-level activities. These construction processes include site mobilization, foundation, steel tower assembly and erection, and attaching a power line to a tower. We focused on the assembly of the iron tower for process analysis and sigma-level controls.
The assembly work has the following characteristics: 共1兲the activity needs 13 crew members including tower assembling en-gineers, tower erecting enen-gineers, helpers, and crane operators; 共2兲the current storage weight of iron bars is 8.4 t;共3兲the maxi-mum size of the field space to store iron bars is less than 20 t of capacity due to the limited site accessibility around a mountain-ous area;共4兲the cost to store 1 t of iron bar is about $25/ day;共5兲 delivery and other process cost for iron bars is estimated at $6 / t; 共6兲the cost for extending storage space exceeding current capac-ity of 8.4 t is $365/ t; and 共7兲 field data were collected for 10 working days.
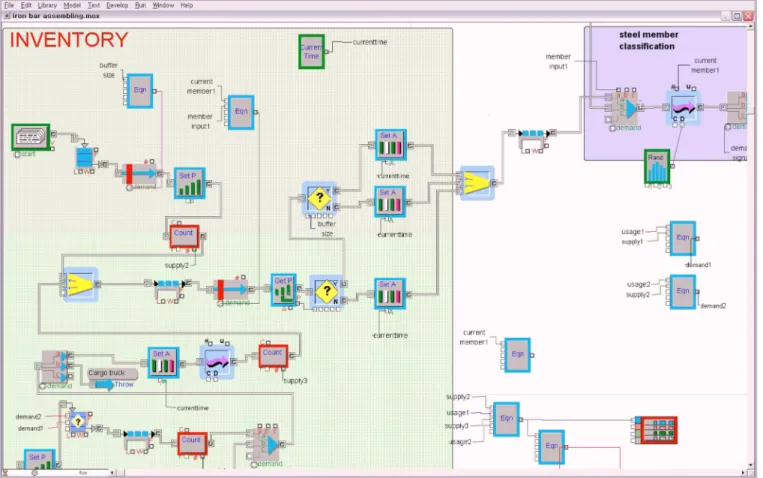
In this paper, the iron bar assembling process was chosen for its receptiveness in process activities. A simulation model is de-veloped for the proof-of-concept. For process flow development and process analysis, EXTENDwas employed in the development of the simulation models. This tool is the versatile visual com-puter simulation software that allows one to test proposed changes to the current processes and predict “what-if” change scenarios 共Imagine That 2002兲. The primary model components that connect the main work process associated with the iron bar assembly consist of delivery of iron bars to the storage area共 in-ventory management兲, classification of steel members, preassem-bling on the ground, transportation of assembled parts to the specified location, and assembling each part. Fig. 3 shows the part of the EXTEND model that indicates the interrelated objects to depict the function of inventory management for iron bars. Two models are made: one for before the six sigma principle applica-tion and the other for after the applicaapplica-tion. By comparing two models and sensitivity analysis, the benefit of the six sigma prin-ciple in conjunction with lean construction is quantified. First, observed data were compared with the outputs of modeling to verify the simulation model. The result showed that the real ob-served productivity 共0.046– 0.054 t / min兲 and simulation result 共average 0.049 t / min兲 match each other within an allowable tolerance.
Definition of CTQ„Critical Total Quality…
The first step to define the CTQ is to set principle indices. The productivity improvement level was set as the principal indices of process performance quality. Then the factor that is most closely linked with productivity is identified. Through the complete analysis and observation of process variations with many inde-pendent factors, changes共or variations兲of the work cycle time are assumed to be the CTQ because it was found that the productivity is closely related to the reliability of the cycle time for assembly work. Subsequently, the target CTQ needs to be determined in order to evaluate the process status and establish the quality im-provement goal. Fig. 4 shows the cycle time variations for assem-bly works from 80 observations during 10 working days. The target CTQ is assumed to be within a maximum 40-min variation. This target CTQ is the tool to achieve the productivity goal.
Following the definition of CTQ and its goal, the current de-fect rate is calculated by Eqs. 共1兲and共2兲. It was found that the target CTQ, 40-min variation, can be represented as the
1.41-Fig. 2. Basic framework for six sigma application to construction projects
sigma level. This is far below the 6-sigma level and the work process can be improved through the modification of this target CTQ. As stated earlier, the improvement will include a stable production rate based on lean construction as well as high product quality from the six sigma principle application
CP= USL − MEAN 3⫻STDEV = 40 − 17.46 3⫻16 = 0.47 共3兲 = 3⫻CP= 1.41 共4兲
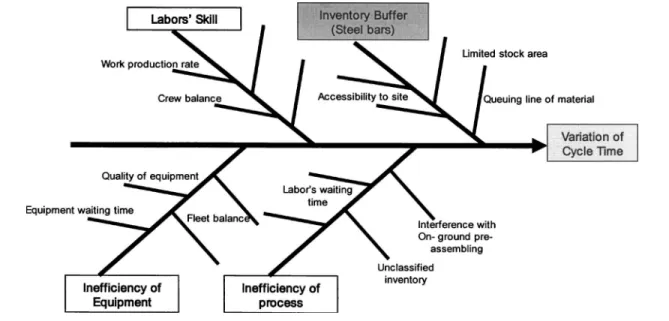
A fishbone diagram is developed which shows the cause-and-effects chains that affect the variation in cycle time 共Fig. 5兲. Based on surveys and interviews with engineers and field super-visors, we found that the resource buffer size has the most critical influence on the cycle time variation of assembly work. In other words, the buffer size optimization will increase the sigma level
through CTQ improvement. Accordingly, the sigma level im-provement will increase the process performance as well.
Improvement of CTQ
The CTQ improvement was achieved in two phases:共1兲 modifi-cation of the current assembling process by lean construction; and 共2兲 resource buffer size optimization for the reduction of cycle time variation through the six sigma principle. Before the process modification and resource optimization, the initial resource level for iron bars was determined as 8.4 t and its sigma level was 1.41. After only implementing the process modification without modi-fying the buffer size共Columns 1 and 2 of Table 2兲, productivity improved by 0.003 t / min, while the sigma level reached only to 1.72, which is not a sufficient improvement both in productivity and sigma level. In this phase, the process modification included the change of preassembling location on the ground for facilitat-ing the assemblfacilitat-ing operation of a hydraulic crane by removfacilitat-ing the interference between on-ground preassembling and hydraulic crane work. In addition, we revised the work sequence in order to increase the reliability of cycle time by classifying categories and sizes of iron bars prior to transporting them to the assembling locations. These modifications are all relevant to the lean con-struction to eliminate waste.
After the process modification, the targeted sigma level was obtained through buffer size optimization to stabilize the cycle time. By increasing the buffer size from 8.4 to 11.5, 14.5, and 19.2 t to its nearly maximum capacity, the productivity improved to 0.055, 0.060, and 0.061 t / min, respectively. The sigma level
Fig. 3.Part of EXTEND model共iron bar inventory management兲
also improved to as high as 6 when the buffer size is 19.2. How-ever, the productivity rose by only 0.001 by adding 4.7 t resource storage area and US$2,900 additional cost. Therefore, it is sug-gested that around 14.5 t is the most efficient range of a buffer size while maintaining reasonable productivity and sigma level. Summary of First Case Study
The simulation result showed the changes of sigma level that vary along with the process reliability, which was measured by varia-tions of the performance indices. The process was evaluated based on the relationship of productivity and cost. It was found that about 20 t of iron bars should be in stock to keep the process from stopping and keep the defect rate共variation of cycle time兲 from fluctuating.
However, due to the limited storage space and additional cost for maintaining increased storage volume, a resource buffer of around 14.5 t was considered as the most efficient size for keep-ing the process reliability as stable as possible while also keepkeep-ing the additional cost for the extra inventory buffer as low as pos-sible. Fig. 6 indicates that the cycle times are apt to be almost the same while the sigma level rises. However, it should be noted that process reliability in terms of variation in cycle time is enhanced
as the sigma levels of the CTQ are improved. This implies that the defect rate is minimized to attain a reliable work flow and performance improvement.
Fig. 7 shows another relationship of the sigma level in CTQ over productivity. Productivity improves as the sigma level in CTQ increases. The cycle time variation below 40 min is a target performance measurement criterion and at around the 4-sigma level the improvement is maximized through the control of vari-ability in CTQ. In order to verify the simulation result, we inves-tigated the same problem from a different point of view. Fig. 8 shows the relationship of material storage size versus productiv-ity. The shape of the curve is very similar to the curve in Fig. 7. This means that the productivity is dependent both on CTQ and storage size.
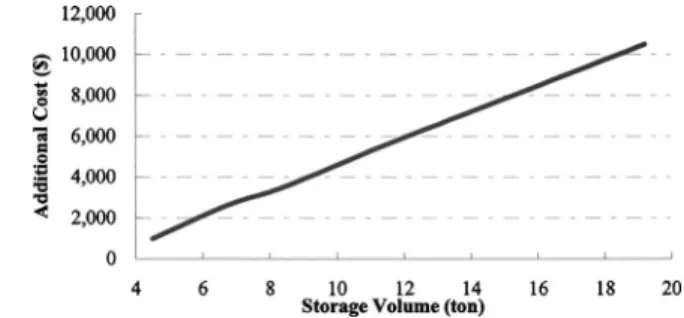
On the other hand, Fig. 9 shows the linear relationship be-tween storage size and additional cost. The cost information of the process is the basis for finding the optimum resource buffer size and the most efficient process control to maintain a higher sigma level. As a result, the six sigma principle has shown many benefits compared with traditional productivity control/
Table 2.Performance Index by Buffer Sizes
Item
Average buffer size 共t兲 8.4 共As-is兲 8.4 共Process modified兲 11.5 共Buffer revised兲 14.5 共Buffer revised兲 19.2 共Buffer revised兲 Productivity共t/min兲 0.049 0.052 0.055 0.060 0.061
Total cost共US$10/ days兲 9,400 9,900 11,900 13,800 16,700
Additional storage cost共US$10/ days兲 3,500 3,600 5,600a 7,500 10,400
Throughput共t / 10 days兲 236 252 268 288 290
Cycle time共min兲 162 150 154 159 160
Sigma level of cycle time共CTQ兲 1.41 1.72 2.58 3.64 6
a
Additional cost of United States $2,000 for increasing buffer size from 8.4 to 11.5 t 共3.1 t兲 consists of:共1兲 storage cost for additional buffer= 3.1 t ⫻$ 25/ day⫻10 days= $ 775;共2兲the cost for extending a storage area= 3.1 t⫻$ 365= 1,130; and共3兲delivering and other processing cost for producing more throughput共268− 252= 16 t兲= 16 t⫻$ 6 = $ 96共all in united states dollars兲.
improvement techniques. Table 3 summarizes the distinct com-parison between the six sigma principle integrated with lean and the traditional approaches.
Case Study 2: Deck Plate Installation Process The second case study for six sigma principle application was performed on a typical deck plate installation process in building construction, which is more complicated and less repetitive than operations in the first case study. It usually takes 2 days to install deck plates for one floor of a building. Typical deck plate assem-bly work has the following characteristics:共1兲the activity needs six crew members共two for delivery, one for cutting and assembly, and three for welding兲;共2兲the floor size is 1,665 m2共17,922 ft2兲 and each floor consists of 462 deck plates共the size of each deck plate is 0.6 m⫻6 m兲;共3兲the cycle time of installing one floor’s deck plates is around 14 h 共840 min兲; and共4兲the labor costs for delivery, cut and assembly, and welding activity are $11, $9, and $23/ h, respectively.
Definition of Process CTQ for Deck Plate Installation The process of defining CTQ includes various activities such as collecting opinions of field engineers, internal customer needs, process mapping techniques, characteristic analysis diagrams, etc. The deck plate installation process requires only two types of resources: the number of workers involved in process activities and the type of deck plate material. Thus, the productivity im-provement strategy can be formed based on the optimum use of the resources, which provides the basis to define the CTQ for
deck plate installation. As the result of an in-depth survey, inter-views, and process analysis, variations of the crews’ working time on plate assembling and welding are set as the fundamental sigma level governing CTQ.
Measuring CTQ and Six Sigma Process Improvement Based on the 25-min observation of installing 12 deck plates, we developed anEXTENDsimulation model representing the produc-tivity changes over time. First, cutting and assembling activities were tested for measuring the CTQ level. The crew’s average working time for cutting and assembling one deck plate was 1.8 min and its standard deviation was 0.19 min. The target CTQ is supposed to be within a maximum of 2 min of working time. Accordingly, the CP 共process capability index兲 is calculated by
the following equation
CP= USL − MEAN 3⫻STDEV = 2 − 1.8 3⫻0.19= 0.35 共5兲 = 3⫻CP= 1.05 共6兲
By the same method, the average welding time for one deck plate was 1.8 min and its standard deviation was 0.22 min. The sigma level for welding activity was 0.9, which means that work-ing time for weldwork-ing will be over 2 min with the probability of 6,210 times out of 1 million activities.
A fishbone diagram 共Fig. 10兲shows the items that cause the variations of the crew’s working time. Based on the surveys and interviews with engineers and field supervisors, and from the analysis of the crew balance chart, we found that the hauling direction of deck plates and balanced rations of workers are the major areas that mostly affect the variation of labor working time.
Fig. 6.Cycle time versus sigma level
Fig. 7.Sigma level in CTQ versus productivity
Fig. 8.Storage volume共resource buffer size兲versus productivity
Subsequently, improving the process includes three major modi-fications as shown in Table 4. As a result of the process modifi-cations, an average of 50% working time can be saved based on the simulation models developed using the same method as the first case study.
Sigma level and performance index were calculated and are shown in Table 5. In the second case study, we used the adjusted sigma levels based on the theory and practice of the six sigma principle. According to Lindermann et al.共2003兲, adjusted sigma levels are calculated by adding a certain movement 共1.5 sigma兲 from ideal means to reduce biases in the specific cases where observation was for a relatively short time span. The adjusted sigma levels were improved from 2.5 and 2.4 to 4 and 4.5,
re-spectively, while increasing the productivity from 0.55 to 0.63 t / min and reducing the cost from $675 to $485 per product cycle.
Summary of Second Case Study
The second case study revealed that the productivity, sigma level, and performance index were improved by the CTQ modifications, which were the working time variations of cutting, assembling, and welding activities. The modification procedure started from setting the standard performance index level. Any process that exceeded a 2-min limit was considered a defect in controlling sigma level and it is controlled by the CTQ indices such as the
Table 3.Comparison of Six Sigma to Traditional Technique Items
Six sigma integrated approach
Traditional lean approach
Goal Performance improvement Same
Measurement of current performance共t/min兲 0.049 Same
Definition of CTQ for performance improvement Variation in cycle time N/Aa
Defect rate of CTQ共sigma level兲 1.41 sigma N/Aa
Analysis of main causes for low performance Location of assembling on ground Same First phase of process improvement Change of assembling location Same Improved performance after first phase improvement共t/min兲 0.052 Same Improved defect rate of CTQ after first phase improvement 1.72 sigma N/Aa Targeted area for CTQ improvement Maintaining optimizing buffer size共iron bars兲 N/Aa
Achieved sigma level for CTQ improvement Around 3.64 sigma N/Aa
Finally achieved performance improvement共t/min兲 0.060 0.052
a
N / A = not available.
Table 4.Process Modifications and Simulation Results
Process modifications Purposes Simulation results
Relocation of deck plate loading area For better material hauling and distributing Hauling distance shortened. Adjustment of deck plates stacking direction
to correspond to the construction route
Hauling time saved by 50% Reallocation of related workers Hauling/assembling/welding ration changes from
2:1:3 to 2:1:2
Assembling time saved by 50% Welding time saved by 50% Adjustment of deck plate size Cutting deck plate in small and light pieces
enough to be carried by one person
No improvement Fig. 10.Factors influencing changes of working time
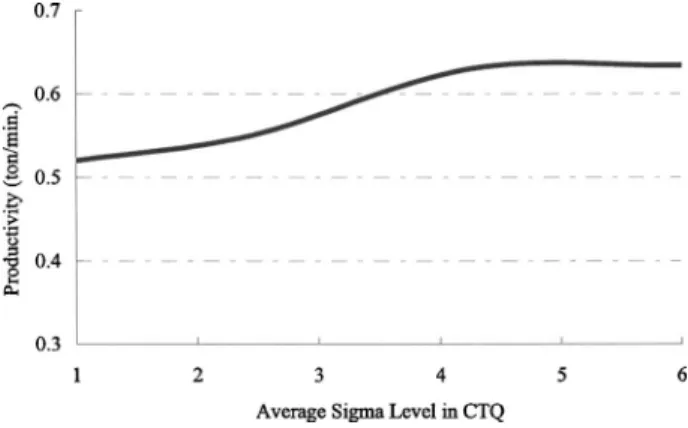
number of workers and working times on such activities as cut-ting, assembling, and welding. Comparing the results from before and after the process modification, the number of process time variations that exceeds 2 min were reduced through the process stabilization and subsequently a higher sigma level is obtained. Fig. 11 shows the relationship of the average sigma level共mean value among those of cutting, assembling, and welding兲in CTQ over productivity. The productivity improves as the sigma level in CTQ increases. At around a 3–4 sigma level the improvement reaches its maximum through the control of variability in CTQ. Practical Implications for Applications
On the basis of these case studies, we drew valuable findings regarding the six sigma principle application to construction op-erations. The six sigma principle can evaluate the quality of the current operation and quantify the goals of improvements for the targeted work flow so as to control the critical sources of variabil-ity. The previous case studies explored the feasible solutions for enhancing construction performance by adopting the six sigma principle as a statistical-based methodology to make significant reductions in customer-defined defect rates. With the aid of a simulation tool, it is verified that the overall performance im-proved as the degree of sigma level was advanced through the control of CTQ. Expectedly, we can arrive at the point which implies that the results of improvement through the six sigma principle will be large if it is applied to more complicated, vola-tile, and multistep processes with a linkage to the lean principle.
However, the construction process is an outdoor activity that is affected by external conditions and is less repetitive than the manufacturing process. Often, quality control in construction projects focuses only on materials rather than on work flows. Therefore, in adopting the six sigma principle to construction projects, it is required to choose relatively simple and repetitive construction activities in which productivity is immediately re-flected by the process variation factors such as resource level, workers proficiency, etc. For a smooth application of the six sigma principle onto construction work, this research suggests a two phased six sigma application. The first phase is to apply the six sigma principle to a simple and repetitive construction process similar to a manufacturing process. Industrial/plant construction and equipment installation projects are usually similar to manu-facturing processes as is demonstrated in the first case study. The second phase is to apply the principle to a real construction pro-cess which is more complicated and less repetitive. The second case is a typical example that is considered as high-level six sigma principle applications.
Following the procedural applications, the systematic process of the six sigma principle requires several phases such as defining CTQ, process modification, simulation modeling, and model veri-fication. Fig. 12 explains the procedural steps and key reflections in applying the six sigma principle to construction processes and operations. Unlike the manufacturing industry, the construction industry has lacked a systematic methodology to assess the defect rate and evaluate performance improvement as the defects are removed in the production processes. This leads to an incomplete objective for the performance improvement at the construction job site level. The six sigma principle can have greater effects on maintaining stable work quality by controlling various factors that are required to ensure project requirements such as safety, quality, cost, or duration under the conditions of diverse and dissimilar project participants.
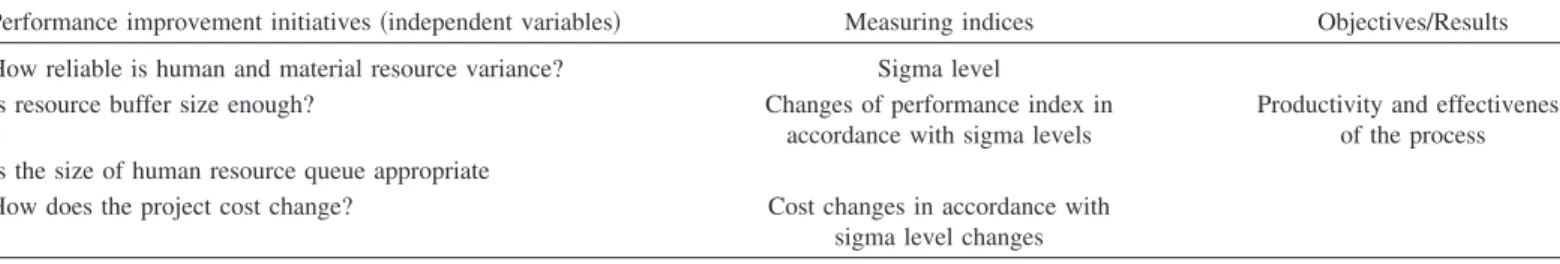
In this view, Table 6 summarizes the skeleton of the criterion when the users decide the motives of performance improvement and set out the measuring indicators, which is applicable to con-struction operations. The previous cases are typical examples, particularly in the event of an additional supply of resource buff-ers to reduce the variation of cycle time and the rearrangement of workers’ rations to minimize inefficient idle time. This method can be expanded to other construction operations by the afore-mentioned procedures. Above all, the definition of CTQ and evaluation of the results to select the critical factors that govern the level of CTQ should be made in accordance with the follow-ing steps: 共1兲 CTQ is the one that is most closely linked with
Table 5.Improvement Results Overview
Items Sigma level Workers idle time 共%兲 Productivity 共t/min兲 Total cycle time for each floor 共min兲 Labor cost 共United States $兲
As-isa Hauling N/Ab 48
Cutting & assembling 1.05共2.5兲a 25 0.55 836 675
Welding 0.9共2.4兲 51.1
To-be Hauling N/Ab 48
Cutting & assembling 2.5共4.0兲 5 0.63 727 485
Welding 3.0共4.5兲 9
a
The data of “as-is” are obtained from the real observations on site, collected for around 25 min. Sigma levels in parentheses are the adjusted values based on the theory and practice of six sigma principle in the case of short-term observation.
b
N / A = not available.
productivity so the process of defining CTQ includes various qualitative and experience-based activities such as opinions of field engineers, process mapping techniques, characteristic analy-sis diagrams, and prior simulation tests, etc; 共2兲the factors that critically affect the quality level of CTQ can be investigated through a fishbone diagram. Based on the cause-and-effects
chains that affect the CTQ and additional subjective information from interviews and surveys with engineers and field supervisors, the factors can be found; and共3兲effects of those factors can be evaluated and verified based on the simulation results and “what-if” scenario analysis. The factor identification is finally obtained by the complete analysis with many independent variables and sensitivity to the CTQ.
Conclusions and Recommendations
As stated, the construction industry has endeavored to improve project performance by applying a number of new philosophies. However, reliable workflows were not achieved sufficiently up to this point. This is largely due to the lack of methodological met-rics to quantitatively set out the definite goal of improvements and to reduce the process variability through the evaluation of quality level in the current construction operations. To achieve this purpose, this paper explored the feasible strategies for the improvement of the construction processes and operations by combining the six sigma principle with the idea of lean construction.
We have performed in-depth comparative analyses on the ex-isting methods for performance improvement and identified the advantages of the six sigma principle over the traditional tech-niques. Consequently, process simulation models have shown that construction performance improved as the sigma level advanced by enhancing the condition of CTQ. In addition, the six sigma principle provided more benefits by obtaining the optimized so-lution sets from performance indices, especially when the target processes are complicated and extended. In short, the six sigma principle is not only a managerial tool for productivity and quality improvement but also a systemized tool for quality and process control. With the aid of the six sigma principle method, quality variances or defects involved in construction processes can be controlled in more practical ways to fit in a desirable range.
Encouraged by the benefits of six sigma principle application, future research will concentrate on developing detailed guidelines on the CTQ control of target factors based on the diverse charac-teristics of many different companies because the customization of the six sigma principle strategy facilitates construction firms to achieve their own process evaluation paradigm. For these objec-tives, advanced financial feasibility analysis should be developed before the implementation of the six sigma principle to a real construction operation. Furthermore, as a basis for getting more effective results from the six sigma principle, various aspects of construction operations and processes must be investigated in many different projects. Finally, base information must be provided from which the improvement targets can be selectively chosen based on the level of practical benefits. Eventually, an integrated management system should be established to control the variations of all the process activities as a whole, rather than the separated process, through the overall performance quality assessment.
Acknowledgments
The writers would like to thank the Korea Ministry of Construc-tion and TransportaConstruc-tion for the funding 共Grant No. 05-CIT-D05-01兲 that made this research possible and the anonymous survey respondents for their valuable contribution to our study.
References
Abdelhamid, T. S.共2003兲. “Six-sigma in lean construction systems: Op-portunities and challenges.”Proc., 11th Annual Conf. of the Interna-tional Group for Lean Construction (IGLC-11), Blacksburg, Va. Ahn, B. J.共2000兲. “Six sigma management innovation for white-collar.”
Han Un, Seoul, Korea.
Al-Sudairi, A. A., Diekmann, J. E., Songer, A. D., and Brown, H. M. 共1999兲. “Simulation of construction processes: Traditional practices versus lean principles.”Proc., 7th Annual Conf. of the Int. Group for Lean Construction (IGLC-7), Berkeley, Calif.
Ballard, G.共2000兲. “Lean project delivery system.”White Paper No. 8, Lean Construction Institute, Calif.,具http://leanconstruction.org典. Ballard, G., and Howell, G. 共1995兲. “Toward construction JIT.”Proc.,
ARCOM Conf.,具http://www.leanconstruction.org/典.
Breyfogle, F. W., Cupello, J. M., and Meadows, B.共2001兲.Managing six sigma: A practical guide to understanding, assessing, and implement-ing the strategy that yields bottom-line success, Wiley, New York. Buggie, F. D.共2000兲. “Beyond six sigma.”J. Manage. Eng., 16共4兲, 28–
31.
Cha, H. S., and O’Connor, J. T.共2005兲. “Optimizing Implementation of value management processes for capital projects.” J. Constr. Eng. Manage., 131共2兲, 239–251.
Design For Six Sigma共DFSS兲.共2002兲. “Six-sigma case of the Steelcase Co.”具http://www.dfss.co.kr/2002_dfss/index.asp典.
Harry, M., and Schroeder, R.共2000兲.Six sigma: The breakthrough man-agement strategy revolutionizing the world’s top corporations, Cur-rency, New York.
Hopp, W. J., and Spearman, M. L.共2000兲.Factory physics, McGraw-Hill, New York.
Horman, M. J., and Thomas, H. R.共2005兲. “Role of inventory buffers in construction labor performance.” J. Constr. Eng. Manage., 131共7兲,
834–843.
Howell, G.共1999兲. “What is lean construction?”Proc., 7th Annual Conf. of the Int. Group for Lean Construction (IGLC-7), Berkeley, Calif. Howell, G., and Ballard, G. 共1994兲. “Lean production theory: Moving
beyond can-do.”Proc., 2nd Annual Conf. of the Int. Group of Lean Construction, Santiago, Chile.
Howell, G., Ballard, G., and Hall, J. 共2001兲. “Capacity utilization and wait time: A premier for construction.”Proc., 9th Annual Conf. of the Int. Group of Lean Construction, Santiago, Chile.
Imagine That.共2002兲.User’s guide for EXTND, San Jose, Calif. Kroslid, D. 共2002兲. “Six sigma and lean manufacturing—A merger for
world-class performance, but is it really talking place?” Asian J. Quality, 2共1兲, 87–104.
Lindermann, K., Schroeder, R. G., Zaheer, S., and Choo, A. S.共2003兲. “Six sigma: A goal-theoretic perspective.” J. Operations Manage.,
21, 193–203.
Pheng, L. S., and Chuan, C. J.共2001兲. “Just-in-time management of pre-cast concrete components.” J. Constr. Eng. Manage., 127共6兲, 494–
501.
Sakamoto, M., Horman, M. J., and Thomas, H. R.共2002兲. “A study of the relationship between buffers and performance in construction.”Proc., 10th Annual Conf. of the Int. Group of Lean Construction, Gramado, Brazil.
Thomas, H. R., Horman, M. J., Minchin, E., and Chen, D.共2003兲. “Im-proving labor flow reliability for better productivity as lean construc-tion principle.”J. Constr. Eng. Manage., 129共3兲, 251–261.
Thomas, H. R., Horman, M. J., Souze, U. E., and Zavrski, I. 共2002兲. “Reducing variability to improve performance as a lean construction principle.”J. Constr. Eng. Manage., 128共2兲, 144–154.
Tommelein, I. D.共2000兲. “Impact of variability and uncertainty on prod-uct and process development.” Proc., 6th Construction Congress, ASCE, Reston, Va., 969–976.
Table 6.Typical Criterion for Applying Six Sigma to Construction Operations
Performance improvement initiatives共independent variables兲 Measuring indices Objectives/Results How reliable is human and material resource variance? Sigma level
Is resource buffer size enough? Changes of performance index in accordance with sigma levels
Productivity and effectiveness of the process Is the size of human resource queue appropriate
How does the project cost change? Cost changes in accordance with sigma level changes