Practical Assessment, Research, and Evaluation
Practical Assessment, Research, and Evaluation
Volume 17 Volume 17, 2012 Article 12
2012
Item Overexposure in Computerized Classification Tests Using
Item Overexposure in Computerized Classification Tests Using
Sequential Item Selection
Sequential Item Selection
Alan HuebnerFollow this and additional works at: https://scholarworks.umass.edu/pare Recommended Citation
Recommended Citation
Huebner, Alan (2012) "Item Overexposure in Computerized Classification Tests Using Sequential Item Selection," Practical Assessment, Research, and Evaluation: Vol. 17 , Article 12.
DOI: https://doi.org/10.7275/nr1c-yv82
Available at: https://scholarworks.umass.edu/pare/vol17/iss1/12
This Article is brought to you for free and open access by ScholarWorks@UMass Amherst. It has been accepted for inclusion in Practical Assessment, Research, and Evaluation by an authorized editor of ScholarWorks@UMass Amherst. For more information, please contact [email protected].
An open-access, peer-reviewed electronic journal.
Copyright is retained by the first or sole author, who grants right of first publication to the Practical Assessment, Research & Evaluation. Permission is granted to distribute this article for nonprofit, educational purposes if it is copied in its entirety and the journal is credited. PARE has the right to authorize third party reproduction of this article in print, electronic and database forms.
Volume 17, Number 12, June 2012 ISSN 1531-7714
Item Overexposure in Computerized Classification Tests Using
Sequential Item Selection
Alan Huebner
University of Notre Dame
Computerized classification tests (CCTs) often use sequential item selection which administers items according to maximizing psychometric information at a cut point demarcating passing and failing scores. This paper illustrates why this method of item selection leads to the overexposure of a significant number of items, and the performances of three different methods for controlling maximum item exposure rates in CCTs are compared. Specifically, the Sympson-Hetter, restricted, and item eligibility methods are examined in two studies realistically simulating different types of CCTs and are evaluated based upon criteria including classification accuracy, the number of items exceeding the desired maximum exposure rate, and test overlap. The pros and cons of each method are discussed from a practical perspective.
Computerized classification tests (CCTs) aim to classify examinees into one of two or more categories, such as Pass/Fail or Pass with Distinction/Pass/Fail, and are often used by professional organizations as a means of certifying new practitioners. The methodology of CCTs shares much in common with that of computer adaptive tests (CATs), but there are also some fundamental differences. While both are usually based upon item response theory (IRT) models, CATs seek to estimate an examinee’s ability parameter as accurately and precisely as possible, as opposed to categorizing the examinee. The difference in the aims of CCTs and CATs lead to differences in how the two types of tests are delivered. Item selection methods and test termination rules for variable-length versions of the exams are examples of where such differences may arise. A common termination rule for variable length CATs is stopping the test
(Finkelman, 2008). Item selection methods for CATs are adaptive, based upon maximizing some information index such as Fisher information (FI) or Kullback-Liebler information (KLI) at the examinee’s interim estimate. While it is possible to adaptively select items via maximum information for CCTs, it is common practice for CCTs to select items by maximizing an information index at , the cut score separating Pass and Fail decisions; this method is efficient and conceptually consistent for CCTs (Spray and Reckase, 1994). Item selection based on cut scores may be referred to as sequential selection (Thompson, 2007).
A practical concern for both CCTs and CATs is item exposure control. Overexposed items pose security concerns which lead to threats to the validity of the tests, due to examinees potentially sharing knowledge of such items with future test takers. The problem of item overexposure is
Practical Assessment, Research & Evaluation, Vol 17, No 12 Page 2 Huebner, CCT Item Overexposure
administers items to examinees. Under this method, items in a pool are ranked greatest to least by their values of FI at . Barring the use of any exposure control method, each examinee would be administered the most informative item in the pool, then the second most informative item, and so on until a classification may be made and the test is terminated by the SPRT. Thus, it is guaranteed that every examinee will see the most informative items in the pool. On the other hand, examinees taking a CAT are administered items which maximize FI (or some other information index) at their own individual interim estimate. This acts as a sort of inherent item exposure control, since it is likely that a given pair of examinees will not have seen the same exact set of items due to differing levels.
Of course, high stakes exams do use item exposure control methods. The Sympson-Hetter (SH) method (Sympson & Hetter, 1985) is an established method of item exposure control applicable to both CCTs and CATs that sets a maximum desired exposure rate, rmax, and aims to
limit the exposure rate of each item in the pool to less than or approximately equal to this value. However, it will be discussed momentarily that the SH method is probabilistic in nature, and it may allow a sizeable portion of the items to be exposed at a rate exceeding rmax , especially under sequential
item selection. Two other methods of item exposure control that specify a maximum exposure rate rmax are the restricted method (RT; Revuelta &
Ponsoda, 1998) and the item eligibility method (IE; van der Linden & Veldkamp, 2004). Barrada, Abad, and Veldkamp (2009) compared the performance of these methods in a fixed-length CAT setting with adaptive item selection.
The objectives of this paper are to highlight the problem of item overexposure in CCTs and to compare the above exposure control methods in a variable-length CCT setting under sequential item selection. A separate CCT study is warranted because the results regarding the comparisons of the three methods obtained in a CAT setting by Barrada et al (2009) may not necessarily hold in the context of CCT with sequential item selection; also, content domain constraints were incorporated into the
present study design for added realism. Ultimately, is it hoped that practicing psychometricians will be provided with concrete information concerning the pros and cons of each method of controlling maximum item exposure in CCTs. Section 2 will briefly recap the SPRT and FI and define and illustrate the SH, RT, and IE methods of maximum exposure control. Section 3 will describe the design of two simulation studies that demonstrate the performance of each method using several evaluation criteria, and Section 4 reports the results of the studies. Section 5 concludes with discussion concerning the comparisons between the three methods.
Methods for Controlling Maximum Item Exposure Rates
The SPRT and FI
We briefly review the formulas and concepts for FI and the SPRT. To do so, we must establish notation relevant to the three parameter logistic (3PL) IRT model. The probability that examinee i
with ability answers the jth item correctly is given
by
where is the response to item j, , , and represent the discrimination, difficulty, and guessing parameters, respectively, and D=1.702 is a scaling constant. Then the FI for item j at cut point may be expressed as
(Embretson & Reise, 2000). The greater the value of , the greater the information of the item.
The SPRT utilizes several constants whose values are established during the development of the CCT. In addition to the aforementioned cut point , the SPRT depends upon Type I and II error rates and , as well as the constant which determines what is known as the “indifference region” of the SPRT. Since no classification rule can
2 https://scholarworks.umass.edu/pare/vol17/iss1/12
perform perfectly, a misclassification in the region is not considered a severe error, where and . The heart of the SPRT is the likelihood ratio (LR) given by
The numerator of LR is the likelihood of the examinee’s responses assuming a theta level of , and the denominator is the same likelihood evaluated for . LR is calculated after each item is administered. If the examinee answers many items correctly, the likelihood ratio will increase, providing evidence that the examinee should be classified as “pass” or “master”. On the other hand, incorrect responses will decrease the value of LR, suggesting “fail” decision is appropriate. The SPRT controls the CCT as follows:
Continue the exam (i.e., administer another item) if .
Terminate the exam with a “fail” decision if LR
Terminate the exam with a “pass” decision if LR
Additional theoretical details of the SPRT are provided by Wald (1947), and more information concerning the application of the SPRT to educational testing may be found in Spray and Reckase (1994), Thompson (2007), and Lin (2011).
The SH, RT, and IE methods
The SH, RT, and IE methods for controlling maximum item exposure rates all assign an exposure control parameter to each item in the pool. The difference between the methods is how and when these exposure control parameters are calculated. To establish notation, let m=1,...,M be an index for the items in the pool, and the value of the exposure control parameter for the mth item is denoted by .
These methods differentiate the item selection from item administration; a selected item is not necessarily administered. We let and
be the probabilities for the selection and
administration of item m, respectively, and thus . The are computed using the quantities or in each method, and the always take values in the interval [0,1]. When an item is selected for examinee i, a random uniform number U between 0 and 1 is generated, and the item is administered only if . After an item is selected, it is no longer available for that examinee regardless of whether or not it was administered. We briefly review how the are obtained in each method.
SH method
The SH method computes the via iterative simulations before the test is administered to examinees. In each iteration, or round, of these preliminary simulations is recalculated , and the exposure control parameters are updated according to the following rule:
The obtained in the final round of simulations are used in the actual tests. For a given pool these exposure control parameters are unchanging, and their computation depends upon the other items in the pool as well as the examinee ability distribution specified in the simulations.
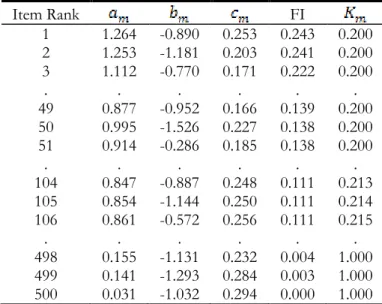
The following illustration aims to clarify the general concept of sequential item selection and why many items are overexposed using this method. Table 1 displays the contents of a hypothetical item pool with M=500 items. Each row corresponds to an item in the pool, and the columns contain the parameters, FI at , and exposure control parameters for each item. The items are ranked by FI greatest to least, and the were set in preliminary simulations for the desired maximum exposure rate rmax =0.20. The most informative
items have the strictest exposure control parameter, 0.20, and the parameter increases as the FI of the items decreases. Note that under the SH method the
take values in the interval .
For a given examinee, items are administered as follows. Item 1 is selected for administration to the
Practical Assessment, Research & Evaluation, Vol 17, No 12 Page 4 Huebner, CCT Item Overexposure
examinee. If , then item 1 is actually administered to the examinee. Otherwise, item 1 is not administered and made ineligible for future selection to the examinee, and the process is repeated for item 2. As an example, consider a situation in which N=1,000 examinees take a CCT with a minimum of 50 items. Then, the first 50 items in the pool are guaranteed to be selected for every examinee, and each has a 20% chance of actually being administered, due to their
Using the Central Limit Theorem, it can be seen that each of these 50 items has a 50% chance of being overexposed (i.e., exposed at a rate greater than rmax =0.20) and a 22% chance of being exposed
at a rate of 0.21, or greater. Thus, it is quite likely that a significant number of items will be overexposed. While this is a simple example that does not take into account practical considerations such as exams with content constraints, the basic reasoning applies to more complex situations.
Table 1: Hypothetical item pool for M=500 items displaying item parameters, FI, and SH exposure control parameters. Item Rank FI 1 1.264 -0.890 0.253 0.243 0.200 2 1.253 -1.181 0.203 0.241 0.200 3 1.112 -0.770 0.171 0.222 0.200 . . . . 49 0.877 -0.952 0.166 0.139 0.200 50 0.995 -1.526 0.227 0.138 0.200 51 0.914 -0.286 0.185 0.138 0.200 . . . . 104 0.847 -0.887 0.248 0.111 0.213 105 0.854 -1.144 0.250 0.111 0.214 106 0.861 -0.572 0.256 0.111 0.215 . . . . 498 0.155 -1.131 0.232 0.004 1.000 499 0.141 -1.293 0.284 0.003 1.000 500 0.031 -1.032 0.294 0.000 1.000 RT method
The RT method (Revuelta & Ponsoda, 1998) is an example of an on-the-fly method of maximum item exposure control. In contrast to the SH method, the RT method does not set the exposure
control parameters before real testing begins. Rather, it continually adjusts the exposure control parameters according to the exposure rates observed as more and more examinees take the test. In general, on-the-fly methods do not require preliminary simulations to set the , and the are not dependent on the other items in the pool. To describe the RT method mathematically, we use notation similar to that of Barrada, et al (2009): the exposure control parameter for item m after the ith
examinee has taken the test is denoted as , and the probability that an item is administered computed from examinees 1 through i is given by . Then, for examinee (i+1), the control parameters are given by
Note that the exposure control parameters can only take the values 0 and 1, and it is impossible for any item exposure to exceed . The RT method may be the conceptually simplest of the three methods discussed in this paper. As an example, consider a CCT with . Whether or not item m is administered to examinee (i+1) depends upon how often it has been administered to examinees 1,…,i. If the item has been administered to less than or equal to 20% of the previous i
examinees, i.e. , then and the item will be administered to examinee (i+1) if selected. Otherwise, if greater than 20% of the previous examinees have seen the item, then , and the item will not be administered to the examinee.
One drawback of the RT method pointed out by Chen, Lei, and Lao (2008) and discussed by Barrada, et al. (2009) is the fact that it produces predictable patterns of exposure for some items. For instance, an item or set of items may be exposed to every nth examinee, where n depends on the
particular item pool and . Then, the item overlap rate among these examinees would be much greater than the overall overlap rate. It will be discussed below that this problem may be corrected by incorporating a small amount of randomness into
4 https://scholarworks.umass.edu/pare/vol17/iss1/12
the method, which may be easily accomplished for CCTs with content domain constraints.
IE method
Another on-the-fly method of maximum item exposure control is the IE method (van der Linden & Veldkamp, 2004). The exposure control parameters are updated using the rule
Under the IE method, even items that have been exposed at a rate greater than have a chance to be administered, albeit a small one. Thus, the IE method does not share the predictability problem of the RT method. Like the RT, it does not require preliminary simulations and the are independent of the other items in the pool and the ability distribution of the examinees.
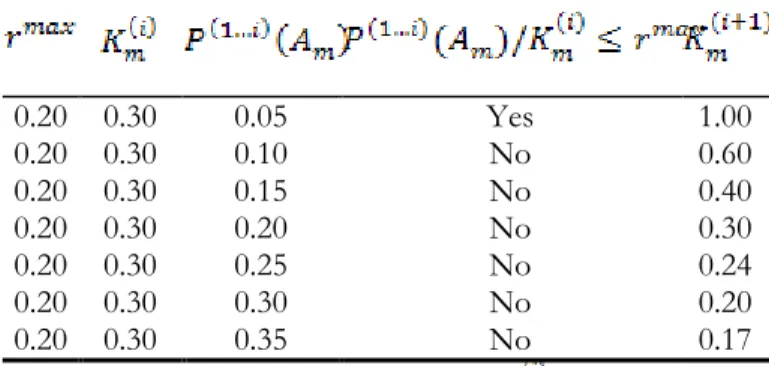
An example may aid in clarifying the IE method. Consider a CCT with and item m with exposure control parameter based upon examinees 1,…,i. This item’s exposure control parameter will be updated for examinee (i+1) based on its current administration probability, . Table 2 illustrates how the updated changes different values of according to the above formula. If is far below , such as , is set to 1, so the item will surely be administered if selected. As increases, decreases, i.e., the exposure control parameter becomes more strict, making it less likely that the item would be administered if selected. In summary, the IE method updates the in a much more subtle manner than the RT. Further examples and illustrations of the methods may be found in Barrada, et al (2009).
Table 2: Updating of exposure control parameter for different administration probabilities under the IE method. 0.20 0.30 0.05 Yes 1.00 0.20 0.30 0.10 No 0.60 0.20 0.30 0.15 No 0.40 0.20 0.30 0.20 No 0.30 0.20 0.30 0.25 No 0.24 0.20 0.30 0.30 No 0.20 0.20 0.30 0.35 No 0.17
Note: =max desired exposure rate, =exposure control parameter for item m for examinee i, and
= administration probability for item m. Simulation Studies
The three methods of maximum item exposure control were examined using simulation studies. The goal of the studies was to illustrate and compare the performance of the methods under various CCT conditions. The studies and criteria used to evaluate the results are described below. Both studies were conducted using the three parameter logistic (3PL) IRT model in a CCT setting in which examinees were classified into one of two categories.
Study 1
The first simulation study uses a CCT design similar to those in previously published studies (Thompson, 2009). An item pool of M=500 items was generated such that the 3PL discrimination, difficulty, and guessing item parameters were drawn from the following distributions, respectively: and The CCT terminated according to the SPRT, and the minimum number of items was and the maximum number was The error rates and for the SPRT were set to and , and the half-length of the indifference region was set to
. The cut score separating a Pass and a Fail decision was
The SH, RT, and IE methods were examined under three different values of rmax: 0.15, 0.20, and
Practical Assessment, Research & Evaluation, Vol 17, No 12 Page 6 Huebner, CCT Item Overexposure
common value for the maximum desired exposure rate (Leung, Chang, & Hau, 2002), and it is also worthwhile to examine values a bit above and below. Thus, the study consists of simulations for (3 methods of maximum exposure control)*(3 values of rmax ) = 9 different conditions. The SH exposure
control parameters were set in preliminary simulations, and the values of the parameters after the 25th iteration were used in the main simulation.
Each condition was replicated 30 times, and for each replication the CCT was administered to a new sample of N=1,000 examinees generated with ability parameters . The item pool described above remained constant across replications for all conditions.
In Study 1, items were selected sequentially by maximizing the FI at . In addition, content domain constraints were imposed such that each item in the pool was randomly assigned to one of three content domains. The contents were given equal weight, and the spiraling method of Kingsbury and Zara (1989) was used to achieve content balance. At every point in an exam when all three content domains were equally represented (including at the start of each exam), the next content domain was selected randomly. This randomness is expected to remedy the problem with predictability of item administration described for the RT method in Section 2.2.
Study 2
Study 2 is intended to examine the performance of the three methods in a CCT setting different than that of Study 1. Thus, the pool size was increased to
M=800 items, and the 3PL item parameters were drawn from the distributions and thereby making the pool more difficult, on average, than that of Study 1. The minimum and maximum test lengths were
increased to and ,
respectively, and the quantities governing the SPRT were changed to , ,
and . These changes to , and increase the conservativeness of the SPRT compared to Study 1; in other words, these values cause the SPRT to require greater certainty of classification to
terminate the test. However, increasing the value of decreases the conservatism. In Study 2 items were again chosen sequentially by maximizing the FI at . Like Study 1, Study 2 also consisted of nine conditions replicated 30 times, and the values of rmax,
examinee ability distribution, and content domain constraints were the same as those in Study 1.
Evaluation Criteria
The different methods of item exposure control were evaluated using several criteria: (1) the proportion of correct examinee classifications (CORR), the average test length for examinees (ATL), the maximum item exposure rate of the items in the pool (MIER), the proportion of overexposed items in the pool (i.e., the proportion of items in the pool with exposure rate exceeding
rmax; OEX), the mean exposure rate of the
overexposed items (MOEX), and the test overlap. The test overlap rate was computed exactly with the formula used by Huo (2009). Denoting as the number of common items for any two examinees, the total number of possible pairs of N
examinees, and the test length of examinee i, the test overlap rate is given by
Generally, an ideal CCT should have high CORR, ATL as close to as possible, MIER approximately equal to rmax , and low OEX and
overlap rates. These statistics were computed and saved for every replication and then averaged across replications.
Results
The results from Studies 1 and 2 are displayed in Tables 1 and 2, respectively. We first discuss broad trends visible in both tables. The results in the two tables differ, of course, due to the different CCT settings used in each. Study 1 shows CORRs in the high 80%s, while Study 2 has CORRs in the low 90%s. In general, larger values of rmax indicate less
strict exposure control, allowing the most informative items to be administered more often. Thus, in both studies the rmax =0.25 conditions have
slightly higher CORRs, and smaller ATLs than the
6 https://scholarworks.umass.edu/pare/vol17/iss1/12
rmax =0.15 conditions for all three exposure control
methods. This is due to the fact that the more frequent administration of these high quality items leads to examinees being classified more accurately and efficiently. However, a price is paid in that the MIERs and overlap rates are generally higher for all three methods using rmax =0.25 than when using rmax
=0.15.
Table 3: Results for Study 1. Averages over 30 replications.
Method CORR ATL MIER OEX MOEX Overlap
SH 0.15 .880 (.009) 48.3 (.1) (.004) .182 (.013) .299 (.001) .159 (<.001) .148 RT 0.15 .878 (.011) 48.1 (.2) (.000) .150 (.000) .000 NA (<.001) .145 IE 0.15 .876 (.010) 48.3 (.2) (.001) .165 (.011) .293 (.003) .156 (<.001) .148 SH 0.20 .889 (.011) 47.6 (.2) (.005) .234 (.013) .229 (.001) .211 (.001) .198 RT 0.20 .885 (.010) 47.5 (.1) (.000) .200 (.000) .000 NA (<.001) .192 IE 0.20 .885 (.010) 47.5 (.2) (.001) .216 (.009) .213 (<.001) .206 (<.001) .196 SH 0.25 .890 (.009) 47.0 (.2) (.004) .288 (.013) .181 (.001) .262 (.001) .246 RT 0.25 .893 (.009) 46.9 (.2) (.000) .250 (.000) .000 NA (<.001) .238 IE 0.25 .889 (.010) 47.0 (.2) (.001) .267 (.009) .166 (<.001) .257 (<.001) .244 Note: CORR=proportion of correct classifications,
ATL=average test length, MIER=maximum item exposure rate, OEX=proportion of items overexposed, and MOEX=mean exposure rate of overexposed items.
We now turn our attention toward comparisons between the three methods of maximum item exposure control. In both studies, within a given value of rmax the differences between the methods
for CORR, ATL, and overlap seem to be insignificant and/or negligible. The differences in the performance of the three methods are most apparent in the MIER and OEX criteria. It was previously noted in Section 2 that the observed MIER was expected to exceed rmax by a small
margin for the SH and IE methods. In both studies, under the SH method the MIER exceeds rmax by
about 3%-4% for all conditions, and under the IE method the MIER exceeds rmax by about 1.5% for
all conditions. Of course, the RT method is designed so that rmax is not exceeded at all, and this is
also evident in the table such that MIER= rmax for all
RT conditions. Thus, in both studies the IE and RT methods offer improvements in MIER over SH, with the advantage being greatest for the RT. In both studies the IE method offers a small improvement in OEX over the SH, but the improvement in OEX yielded by the RT method is drastic. Of course, OEX is zero under the RT method for all conditions because, again, no item exposure is allowed to exceed rmax. Values for OEX
under the SH and IE methods range from about 16% to nearly 40% depending on testing conditions; thus, the RT method offers a dramatic improvement in OEX.
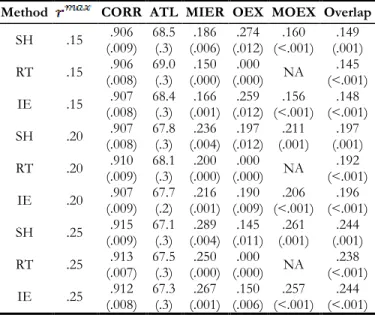
Table 4: Results for Study 2. Averages over 30 replications.
Method CORR ATL MIER OEX MOEX Overlap
SH .15 (.009) .906 68.5 (.3) (.006) .186 (.012) .274 (<.001) .160 (.001) .149 RT .15 (.008) .906 69.0 (.3) (.000) .150 (.000) .000 NA (<.001) .145 IE .15 (.008) .907 68.4 (.3) (.001) .166 (.012) .259 (<.001) .156 (<.001) .148 SH .20 (.008) .907 67.8 (.3) (.004) .236 (.012) .197 (.001) .211 (.001) .197 RT .20 (.009) .910 68.1 (.3) (.000) .200 (.000) .000 NA (<.001) .192 IE .20 (.009) .907 67.7 (.2) (.001) .216 (.009) .190 (<.001) .206 (<.001) .196 SH .25 (.009) .915 67.1 (.3) (.004) .289 (.011) .145 (.001) .261 (.001) .244 RT .25 (.007) .913 67.5 (.3) (.000) .250 (.000) .000 NA (<.001) .238 IE .25 (.008) .912 67.3 (.3) (.001) .267 (.006) .150 (<.001) .257 (<.001) .244 Note: CORR=proportion of correct classifications,
ATL=average test length, MIER=maximum item exposure rate, OEX=proportion of items overexposed, and
MOEX=mean exposure rate of overexposed items.
The improvements in MIER and OEX yielded by the IE and RT methods compared to the SH method may be greater in a CCT setting than when these methods are employed in a CAT setting. For an informal illustration, we note that Barrada et al (2009) reported similar relationships among the three methods from their CAT study, but the magnitude of the MIER and OEX under the SH method were less extreme than in the present study.
Practical Assessment, Research & Evaluation, Vol 17, No 12 Page 8 Huebner, CCT Item Overexposure
Specifically, they reported that under the SH method the MIER exceeded rmax by less than 2% in
all conditions, and OEX did not exceed 12% in any condition. The relatively high magnitudes of the MIER and OEX in the CCT setting are due to the sequential item selection as described in Section 2.1. This discussion serves as only an informal comparison between the methods in CCT and CAT settings, as the two studies were not designed to be comparable; yet, the results in the present paper do suggest that much advantage may be gained by using the RT or IE rather than the SH method in a CCT setting, perhaps more than is gained in a CAT setting.
Discussion
This paper compared three methods of maximum item exposure control in a variable-length CCT setting via realistic simulation studies under different testing conditions. The three methods were the well-known SH method and two on-the-fly methods, the RT and IE. While all three methods were very similar in terms of classification accuracy and average test length, the observed maximum item exposure rate and proportion of items exceeding rmax
were lower under the IE and RT methods than under the SH for three different values of rmax. A
similar study conducted in a CAT setting by Barrada et al (2009) yielded similar results, but the results of the current study suggest that improvements yielded by the RT and IE methods over the SH method may be greater in a CCT setting than in a CAT setting.
In addition to these psychometric considerations, there are also practical considerations that would influence the choice of exposure control method for use in an operational CCT. One potential drawback of the SH method that is often noted in the literature is the time expenditure required to run the preliminary simulations to set the exposure control parameters before real testing begins. While this is may be a valid point, this task would most likely not be overly burdensome due to the availability of modern computing capabilities. However, it seems that for a practitioner the most severe shortcoming of the SH method is the dependence of the exposure control
parameters on the particular item pool. The consequence of this dependence is that if an item or group of items has to be removed from the pool due to poor functioning or security concerns while the pool is active, the SH parameters would have to be recalculated for the remaining items in the pool. Thus, the pool would have to be republished—a task that comes with many administrative costs for a testing organization.
On-the-fly methods such as the IE and RT methods avoid these drawbacks entirely. These methods continually update the exposure control parameters based upon observed item exposure rates from past examinees. This approach is especially feasible given the growth of web-based testing, which would allow item exposure data from different testing centers to be gathered and utilized immediately. These considerations should make the IE and RT methods viable alternatives to the SH method for psychometricians designing new CCTs or revamping existing ones. While the RT method has the aforementioned issue with the predictability of item administration, this problem should be correctable by introducing an element of randomness at some point in the item selection process, such as in choosing the content domain of subsequent items as was done in this study. The RT method should be especially appealing for a CCT in which strict adherence to rmax is desired.
On a final note, there are other methods of controlling item exposure in CCTs. One randomized approach used in a recent study (Lin, 2011) divides the item pool into stacks, or strata, such that the m most informative items at are in the first stack, the m next most informative items are in the second stack, and so on. Then, for a given examinee, the first item is chosen randomly from the first stack, the second item is chosen from the second stack, and so on. Thus, this method is different than the three considered in this paper in that is does not directly manipulate a set value of
rmax. The method is interesting in that it may be
thought of as a CCT analogue of a-stratification, a method that has gained popularity for improving item exposure balance in CAT (Chang & Ying, 1999). Researchers may wish to investigate the
8 https://scholarworks.umass.edu/pare/vol17/iss1/12
merits of this method in comparison to others in future studies.
References
Barrada, J.A., Abad F.J., & Veldkamp, B.P. (2009). Comparison of methods for controlling maximum exposure rates in computerized adaptive testing. Psicothema, 21(2), 313-320.
Chang, H. & Ying, Z. (1999). A-stratified multistage computerized adaptive testing. Applied Psychological Measurment, 23, 211-222.
Chen, S.Y., Lei, P.W., & Liao, W.H. (2008). Controlling item exposure and test overlap on the fly in computerized adaptive testing. British Journal of Mathematical and Statistical Psychology, 61, 75-91. Embretson, S.E., & Reise, S.P. (2000). Item response theory
for psychologists. Mahwah, NJ: Lawrence Erlbaum. Finkelman, M. (2008). On using stochastic curtailment
to shorten the SPRT in sequential mastery testing. Journal of Educational and Behavioral Statistics, 33(4), 442-463.
Huo, Y. (2009). Variable-length computerized adaptive testing: adaptation of the a-stratified strategy in item selection with content balancing. Unpublished doctoral dissertation. University of Illinois, Champaign.
Kingsbury, G.G., & Zara, A.R. (1989). Procedures for selecting items for computerized adaptive tests. Applied Measurement in Education, 2(4), 359-375. Leung, C. K., Chang, H. H., & Hau, K. T. (2002). Item
selection in computerized adaptive testing:
improving the a-stratified design with the Sympson-Hetter algorithm. Applied Psychological Measurement, 26(4), 376-392.
Lin, C. J. (2011). Item selection criteria with practical constraints for computerized adaptive testing. Educational and Psychological Measurement, 71(1), 20-36. Revuelta, J., & Ponsoda, V. (1998). A comparison of item
exposure control methods in computerized adaptive testing. Journal of Educational Measurement, 35, 311-327.
Spray, J. A., & Reckase, M. D. (1994). The selection of test items for decision making with a computerized adaptive test. Paper presented at the Annual Meeting of the National Council for Measurement in Education (New Orleans, LA, April 5-7, 1994).
Sympson, J.B. & Hetter, R.D. (1985). Controlling item exposure rates in computerized adaptive testing. In Proceedings of the 27th annual meeting of the Military Testing Association (pp. 937-977). San Diego, CA: Navy Personnel Research and Development Center. van der Linden, W.J., & Veldkamp, B.P. (2007).
Conditional item-exposure control in adaptive testing using item-ineligibility probabilities. Journal of Educational & Behavioral Statistics, 29, 273-291. Thompson, N. A. (2007). A practitioner’s guide for
variable-length computerized classification testing. Practical Assessment Research & Evaluation, 12 (1). Available online:
http://pareonline.net/getvn.asp?v=12&n=1
Thompson, N. A. (2009). Item selection in
computerized classification testing. Educational and Psychological Measurement, 69(5), 778-793.
Wald, A. (1947). Sequential analysis. New York, NY: Wiley.
Citation:
Huebner, Alan. (2012). Item Overexposure in Computerized Classification Tests Using Sequential Item Selection. Practical Assessment, Research & Evaluation, 17(12). Available online:
http://pareonline.net/getvn.asp?v=17&n=12 Author:
Alan Huebner
University of Notre Dame
Department of Applied and Computational Mathematics and Statistics 153 Hurley Hall
Notre Dame, IN 46556 Alan.Huebner.10 [at] nd.edu