Multi-Criteria Optimization of an Advanced Combined
Cycle Power Plant including CO2 Separation
Options
Hongtao Li., François Maréchal, Meinrad Burer, Daniel Favrat
Laboratory for Induslrial Energy Srstems, Swiss Federal Instiluk ofTechnolog) Lausanne CH- I 0 I 5 Lausanne, Swi lzerland
Abstract
This paper illustrates a methodology developed in order to facilitate the analysis of complex systems characterized by a large number of technical, economical and environmental parameters. Thermo-economic modeling of a natural gas combined cycle including monoethanolamine absorption CO2 separation option has been integrated within a multiobjective optimizer based on a genetic algorithm m order to characterize the economic and environmental potential of such complex systems within various contexts.
A natural gas combined cycle project in a district of Germany is given as a case study. The results show the influences of the configwation and technical parameter changes on the evolution of electrical efficiency of the combined cycle plant as well as on those of its sub-systems, such as gas turbine cycle and steam cycle. The optimum integrations of such a complex system under different situations are revealed by the Pareto Optimal Frontier obtained tkough the multi-objective optimization process, which provides information on the relationship between power generation cost and CO2 emission performances. Such information is of direct relevance for policy makers to deflne coherent emission tax levels, or for utility owners or project investors to choose the appropriate emission levels to be reached by the new plant, or for power generation technology suppliers to identifr the market potential of their products as well as the most appropriate design for a given powet unit, under given policies and economic contexts.
Keywords: Multi-criteria, Multi-objective optimization, Thermo-economic modeling, environomic, Combined Cycle, CO2 separation, MEA, CO2 tax
1. Introduction
Considering the major role of the power sector in the economy and its contribution to local atmospheric pollution and COz emissions, the development of new cost-effective and environmentally friendly electricity generation systems is of the first priority for a more
sustainable society. According to the WEO 2000 Reference Scenario projection, 2294 GW of
new generating capacity will be installed worldwide by 2020, with fossil fuel based power plants
accounting for 1890 GW, around 86% of the total [1]. In such a context, natural gas combined
cycle (NGCC) power plants are among the most adapted options, due to low emission rates and
very competitive generation costs. When associated with monoethanolamine absorption (MEA)
COz separation alternatives, their impact on climate change can be reduced but at a pdce which
makes this option not economical when pollution costs are not internalized.
In order to facilitate the analysis of such complex systems chaxacteized by a large number of
technical, economical and environmental parameters and to find out the optimal solutions, a
thermo-economic modularization modelling approach based on generalized superstructure of
advanced NGCC plant wi{h MEA option has been developed and integrated into an environomic
'
Conesponding author. Tel.: + 41 21 693 5316; Faxr + 4121 693 3502 Email address: [email protected] (H. Li)
Nomenclature
AAC
ABC
DAQ
c COEMC02
n
P
RCO2
T
i
t
Subscripts av comb Crid NGo&M
umt Abbreviations CRF EGR G O S a GT LOSa MEA NGCC POF RH S T SCAnnual total COz abatement cost [US$/year]
CO2 abatement cost [US$/ton COz]
CO2 abatement percentage l%l
Arurual COz abatemeût quantity [ton COzlyearJ Annual cost [US$/year]
Specific cost; price [UScents/kWh] Cost of Electricity [Uscents/kwh]
Annual COu emissions [ton CO2lyear]
Amortizationperiod [year]
Power capacity; Power demand [kW]
CO2 emission rate [gCO2,&Wh]
Annual operating hours fhours/year]
Set ofindependent and dependent variables
Set ofindependent and dependent variables
Average Combustion Power grid Natural Gas
Operation and Maintenance
NGCC unit
Capital Recovery Factor
Exhaust gas recirculation
Global optimal solution when there is a CO2 tax of aUS$/ton COz Gas Turbine
Local optimal solution when there is a COu tax of aUS$/ton COz
Monoethanolamine absorption
Natural gas combined Cycle
Pareto Optimal Frontier
Reheat Steam Turbine Simple combustion
Sequential combustion
optimization metlodology [2]. This methodology allows the internalization of external cost such
as that due to COz tax into the single objective aggregated function, i.e. the annual total cost or
the cost of electricity (COE). The local and global optima can be found with the help of powerful optimization algorithm like the evolutionary algorithms [2-4]. The developed models proved to
be able to reflect the market situation and the methodology itself can effectively deal with such a
complex problem
With the successful development and implementation of a new and fast multi-objective
and environmental potential of the NGCC systems within various contexts, taking into account
the unceÉainty of future COu tax levels. MEA COz separation with exhaust gas recirculation
option is modeled as one ofthe possible options of the studied NGCC plant.
2. Methodology
2.1 Thermo-economic Modelling of Natural Gas Combined Cycle Systems with MEA Option
The thermo-economic modelling is based on a generalized superstructure of advanced NGCC
unit with MEA option, composed with 4 sub-systems, shown in Fig. 1.
Fig. L Superstructure ofan advanced NGCC with MEA and EGR option [2]
Besides traditional simple combustion (SC) gas turbine (GT), the sequential combustion (SQC)
technology that has been successfully implemented in ALSTOM's GT24 and GT26 is also
modeled. NOx control technology such as dry low-NOx is included. The steam cycle
superstructure model includes two and three pressure level heat recovery steam generators
(HRSG) and a steam turbine (ST) cycle with reheat as a possible option. Details can be found in
12,sl.
MEA absorption unit can capture up to 90Yo of COz in the exhaust gas [6]. However it becomes
costly if no additional measures are taken due to the relatively dilute concentration in the flue gas.
The exhaust gas recirculation (EGR) option can increase the CO2 content in the flue gas [7] and
effectively reduce the size and investment cost of the MEA unit. An optimum oxygen content in
the combustion air can minimize the COE under such a situation. The MEA cost function is based
on the data from Hendriks [6] and validated by the data from Undrum [8]. Besides the investment cost
increase, MEA unit will consume a large amount of steam extracted from NGCC system, which causes
electrical efflciency degradation. The fuel cost therefore will increase accordingly.
The cost ofCO2 transpodation and storage after CO2 separation varies in a wide range from 5 to
15 US$/ton COz avoided [9] due to a high site specific uncertainty. A cost of 10 US$/ton COz
avoided for CO2 disposal (transportation and storage) is used in this study. In order to consider
the total cost and emissions for aNGCC plant, the natural gas supply system is also modeled [5].
2. 2 Multi-criteria Evaluation and Optimization
Evolutionary algorithms have been proven to be robust and effective for the resolution of
non-linear, non-continuous, and mixed real integer optimization problems such as those encountered
when dealing with N@C systems. The single objective aggregated function allows a minimization of the overall intemalized cost of an energy system, accounting for design, installation, operation as well as pollution through the introduction of pollution cost factors.
However, given the difficulty encountered sometimes when trying to express certain criteria m
financial terms due to various reasons, a multi-objective optimization is preferred. As an example,
the uncertainty of COz emission tax levels may make it difficult for pre-intemalization of COz
emission cost into a single COE function. In this work, both the COz emission rate in terms of
gCO2 emitted per kWh electricity produced and the COE are simultaneously optimized before
emission cost internalization. The optimization results are in the form of a set of global optrma
called Pareto Optimal Frontier by contrast with only one as is often shown with single objective
optimization. Each of the solution along the Pareto Optimal Frontier (POF) corresponds to the
minimum COz emission rate under a given COE, or, in other words, the minimum COE under a given CO2 emission rate level. The influence of the COz tax level can then easily be evaluated
though post-optimization internalization.
For such a purpose, a new multi-objective optimizer based on queuing and clustering genetic
algorithm has been recently developed [10], and applied to the analysis of the trade-off between
cost and specific fuel consumption or environmental performance associated with the implementation of advanced integrated eûergy systems within urban areas and the power load
dispatching between several pulverized coal plants [ 1-14]. In this study, it is used to optimize
the two objectives of a NGCC project: the CO2 emission rate and the COE.
3. Supplying Electricity to a Community with 400 MW Demand in a District of Germany 3.1 Case description
The case study of electricity supply to a community has been investigated with the
environmental and economic context of Germany. This community has an additional 400 MW
power demand in the year of 2005 to be satisfied. Considering the financial and environmental
policy situation, the predefined options can be the construction of a 400 MW NGCC plant that
may include or not MEA unit to supply the full demand, or the construction of a smaller NGCC
unit with/without MEA. For the latter case, the balance of the electricity needed is imported from
the power grid at a price defined in a long term coûtract, which is based on long term projection
of the electricity wholesale price. The smallest NGCC capacity is set at 100 MW due to
economies of scale consideration. The annual operating hours planned for the NGCC plant is of
7500 hours.
The investment in the NGCC unit is assumed to be satisfied by a bank loan. The natural gas
price is of 1 UScents/kWh for power generation activities [5]. The electricity buying price in the
long term power importation contract is taken as 3.8 UScentslkWh, which is the projected
average electricity wholesale price after 2005 [15].
3.2 Objective Functions and Independent Variables
For the given power demand, the average cost of electricity (COEuu) and the average CO2
emission rate (RCO2",) are taken as the two objectives to be simultaneously optimized.
The COE"" is calculated with equation (l) :
[UScents/kWh]
(r)
Wlere, Cg,;a [UScentslkWh] is the electricity wholesale price of the grid, or, in another word,
electricity buying price iqthis study, based on a long term contract. P,.1 [MW] and Pa".*a [MW]
are respectively the NGCC unit capacity and total power demand of 400 MW. T [hours/year] is
the annual operating period of the NGCC unit (7500 hours). The cost of electricity of the NGCC
Where, C6ay [US$/year] , C6,"1 [US$/year] are the annual operating and maintenance cost (excluding the solvent cost of the MEA unit) and fuel cost of the NGCC unit, respectively.
Csotvent&disposal [US$/year] is the solvent and CO2 disposal (including fansportation and storage)
cost when there is a MEA unit. The amual capital cost C"uo;1"1 [US$/year] is calculated as follows:
C
",0,,., =CRF' C,,,",,^",,
[US$/year]
(3)
Where, Cinu"t-"nt is the total investment cost of the plant, including equipment cost and
installation cost. CRF is the Capital Recovery Factor that calculates the equivalent value of a
future annuity given the present cash equivalent with the following equation:
/ ' t C t / ' L F " c o D i t o l ' " O & . M ' " h l e l ' " s o l v e n t & . l i s D o s ù l L v L u n , t = p J " ' " " - unil -ç p p = î ' ( l + i ) ' ( l + t ) " - l
t-l
[UScents,&Wh] Q)(4)
lecor/kwhl
(s)
RCO2*
Where, i is the interest rate with a value of 8% used in this study; n is the amortization period of
15 years, which is set the same as the investment depreciation period and the economic lifetime
ofthe plant.
The annual COz emissions due to fuel combustion MCO2"".b [ton CozlyearJ is derived according to the carbon cortent of natural gas as well as the fuel consumption rate, or, in other words, the electrical efficiency of the NGCC, and a COz captwe rate of 90% in the exïaust gas is
assumed when MEA is inhoduced. The annual C02 emissions due to exploration, production,
prepamtion and transportation of natural gas is estimated at 0.31kg ofCO2 per kg of natural gas
delivered [5]. Methane is another important green house gas with a much higher global warming
potential (GWP) of about 24.5 using a 100-year time horizon (IPCC, 1997). With a leakage of
0.9% ofthe total natural gas consumption, the equivalent annual CO2 emissions are considered in
the total annual COz emissions [5]. The average COz emission is given as:
_ MCO2,*b + MCO2 Nc + MCO2 sid xl|6
P * * * ' T
Where, MCO2rqc [ton COz/year] is the annual indirect equivalent COz emissions due to natural
gas preparation and leakage and MCO2g.ia [ton COlyearJ is the arurual total COz emissions due to power importation. The COz average emission rate for the power grid in Germany is of
631gCOz/kwh
[1s].
The optimization
problem defined by this case
study therefore
can be uritten as :
Min(CoE
*, RCo
2,,) = f (i, n
subject to
I
hrG,D=0 i =1,...,t
(equality
constraints)
lsrG,D>O
k =1,...,K
(inequality
constraint
s)
Wïere, i and ! are sets of independent and dependent variables, respectively.
The independent variables can be classified into two categories: 1) integer variables for system
configuration design such as gas turbine and steam cycle type, and 2) continuous variables such as NGCC capacity, gas tgrbine pressure ratio and inlet temperature, which define the important technical and financial parameters. Some of the typical real independent variables and their
boundary conditions are given in Table l.
GT Pressure Ratio for high pressule part of SQC [-]
3. 3 Additional Evaluation Criteria
Besides the COE"' and RCO2"'. the following additional criteria are also defined in order to firther evaluate the performances ofthe solutions.
Annu a I C O, 4b slelrertrsL4 antily
The annual COz abatement quantity (AQ) is the COz annual reduction of the analyzed solution compared to the reference case, and calculated as :
AQ = (RCO2 ^ - RCO2 b^"n ) . Pd",.d .T /106 [ton CO2lyear] (7)
where, RCO2u*"1;n" is the COz emission rate of the reference case. The power grid is taken as the
reference case in this analysis, and, thercfore RCO2niT(631 gCO2/kWh) and grid whole sale price
COEr,;a, which is also the electricity buying price for this project, are taken as the baseline.
Annual totql co24bslgmente er1!
Similar as AP, the amual COz abatement
baseline values:
AÀC = (COE." - COE b^"ri). pd"."d .T /1O0
C O, _qb slqn9ntx9Lc9nt sgc
The COz abatement percentage is derived by equation (9) :
A P = A Q l( R C o 2 u n r u " . P a * ^ a . r x 1 0 6 ) x 100
It represents the CO2 abatement potential ofthe given solution compared to the reference case
COz sbatetne!!_tp$
For the analyzed solution, the specific additional cost for COz reduction compared to the
reference case can be evaluated by the CO2 abatement cost, which is defined as
ABC = AAC/AQ
[US$/ton
COzJ (10)
This is an important criterion both for effective COz tax level design and for the economic
feasibility and profitability analysis ofthe solutions, which will be analyzed in detail later.
4. Results
The POF obtained with the multi-objective optimizer and the typical solutions are given in Fig. 2. The configuations' descriptions and the values of the important independent and
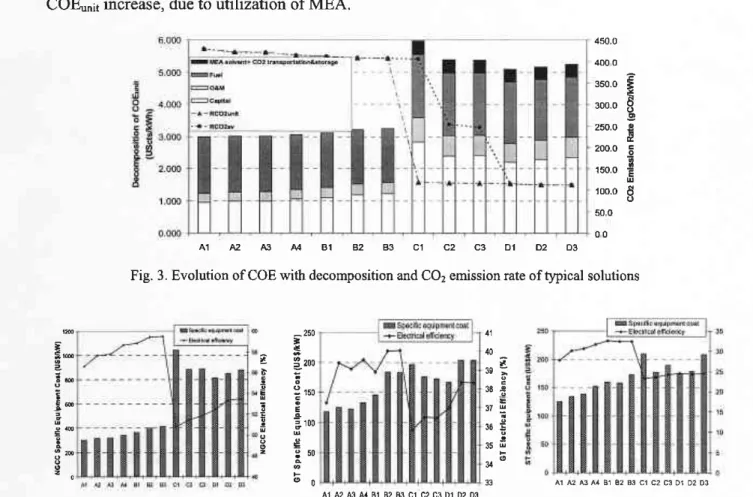
dependent parameters ofthese typical solutions along the POF are listed in Table 2. Fig. 3. gives
the evolution of COE*it with a detailed decomposition information of the typical solutions as
cost is the additional affrual cost compared to t}re
[Us$/year] (8)
well as their associated RCO2-,it and RCO2"" .The evolution of the electrical efficiency and
specific equipment cost for NGCC, GT and ST along the POF is given in Fig. 4.
.-' ' 4 3 0 0 0 42500 420 00 4 1 5 0 0 4 1 0 0 0 405 00
*_.i: ,*
- 'r
>.Èf ;
cz-t1- -2.90 3 . 1 0 : t \ D2 D3 2.æ 300 3.50 4.00 4 50 s.00 sso AEr.g. Cdt ol El.ctrlclty COEry ror rh. Glv.n Pomr D.mnd (Usêr./kflh)Fig. 2. POF obtained with electricity buying price at 3.8 UScentsikWh
The POF shown in Fig.2. includes 4 segments, which indicates different clustering solutions. A
400MW (maximum capacity for this project) simple combustion 3 pressure level NGCC unit (Al)
is shown to be the most economical but the most COz intensive solution in the absence of CO2
tax with a electrical efficiency of 5659%, which converges to the current conventional NGCC.
This is due to its lower COE",it (2.99 UScents/kWh) than that of the electricity buying price.
Along with the increase ofNGCC electrical efficiency due to GT cycle and/or ST cycle electrical
efficiency improvement, the RCO2unit decreases 5% from solution Al to E}3, with increased
COEunir. A maximum COE.it of 3.24 UScents/kWh associated with an electrical efficiency of
59.49% is achieved by solution B3 conesponding to the lowest RCO2*,I of 407.4 BCOz/kWh,
within segment A and B. This COE"rt is still lower than the electricity buying price. Therefore,
no power is imported within these solutions. The COE ,'tt and RCO2onit are then equal to COE",
and RCO2uu, respectively. The solution 83 has the most complex configuration (sequential
combustion gas hubine, 3 pressure level steam cycle with reheat) that are available in the market
today, which help it reaching a electrical efficiency of around 60%. Its typical physical parameters are also reaching their currently commercially available bound, with a pressure ratio
at 31, turbine inlet temperature at 1425 "C,live/reheat steam temperature at 581.8 'C, pinch of
HRSG of 8 oC and condenser pressure at 0.05 bar, Further increase of the NGCC electrical
efficiercy becomes technically and economically unfeasible. The MEA CO2 sequestration must
be introduced in order to reach a lower RCO2"", and the solutions therefore jump to segment C,
with a significant RCO2*,ir reduction (RCO2un11 is lower than 150 gCO2lkWh). However, in the
meantime, the COE*.,it of the NGCC also increases dramatically when MEA is introduced (all of
the COEonl are higher than 5 UScents/kWh in such a case). These values can be clearly seen from
Fig. 3. Therefore, part of the electricity demand will be satisfied by the power grid which has a
higher RCO2r.ia of 631gCO2lkWh, but relatively lower COE*ia of 3,8 UScents/kWh. Due to
much lower RCO2,.it of NGCC with MEA option, further increasing the NGCC unit capacity
from 176 MW (Cl) to the maximum possible capacity 400 MW (Dl) results in a drastic RCO2",
reduction, from 405.2 gCOzlkWh to 114.6 gCOz/kWh (arctnd,72%o reduction). Along with the
capacity increase, the COE*,it decreases from 5.97 UScents/kWh to 5.1 UScents/kWh mainly due
to scale of investment eff.ect, which can be seen from Fig. 3 and Table 2. They are still higher
than the COE*ia. Therefore, the COE"" increases ftom 4.75 UScents/kWh to 5.1 UScents/kWh
due to a lower amount of imported electricity. Stading from solutions Dl, further reduction
4 5 0 0 0 , $ roo.oo I à rso.oo E E 300.00 .Ë È zso.oo ! 1 0 0 0
Table 2 . Values of importalt independent and dependent parameters of typical solutions along the POF NGCC Pêrformanc€ rnd Pârâmeters co, tùs1î emission capaciry t s / k w h . : : , r M w ] r (gLU,/ , kwh)
"d,:";",'"$
trË ;:Lîil*
MEA
Ëtt;;
-,il,1î:1"",
A I 2.99 429 0 400 56 59 301 0 0 0 023 0 0 0 400 A2 1.00 421.1 57.66 1 4 8 7 317 0.23 0.00 400 A3 J.00 420.1 51.71 14.85 3 1 9 0.23 3 0 5 4 1 3 . 8 400 58 6? 14 62 343 0.00 0.23 0.23 0.00 58.83 400 14.58 363 B I 3 4 1 1 . 8 0.00 59.43 400 92 3.20 407.7 14.43 400 0.23 14.42 400 B3 3.24 407.4 59.49 414 0.00 0.23 4.15 405.2 176 50.75 7.45 t 04l yes 556.67 0 . 1 0 5t.46 C2 4.96 253.4 293 12.24 883 )'€B 462.1O 0 . 1 0 4.98 246.5 298 51.84 12.35 888 yes 456.79 0 . 1 0 0 . 1 0 yes 409.65 52.4J 400 5 . 1 0 D I 1 1 4 . 6 16.36 8 1 4 0 . 1 1 406.00 )€s 400 5 . 1 1 D2 t12.4 53.35 1 6 _ 0 7 8 5 1 D3 I l 2 . r 400 53.47 16.04 880 )€s 405.42 0 . 1 IGT Cycle Performrnce rnd Parrmefers '0""'oT,
_ p5:y. ru,bine intet Exhausr sas *T'j: Excess air
ti,&ï,'l ËiÈi!]."ï "c";33*' rvn. p!âtio remperanre &
' "' ,urr**, "'
î-i-
'-
i"tl'*- "fii*'
fiiË:i'
Ïlr'
A1 27259 31.23 117.49 SC t 8 t J 6 7 6 1 t 2 6 t 4 9 2 2 9 2 A2 213.20 39.38 124.31 sc 20 1394 605.4 598.6 2 261 2.254 5 9 3 I t392 20 sc 122.06 2',t0.46 39.06 612 8 A3 269.47 39.53 r32 49 S C 21 1421 6t7.6 573.0 2.203 B 1 264.41 38.89 145.12 S Q C 24 1 3 8 7 535.8 2.381 82 269 36 40.02 184.02 sQc 3 l 1427 512.1 2.396 B3 269.18 40.03 1t2.98 sQc 1425 656.3 512.4 2.404 c l 124.30 35.19 196.64 SQC 26 1371 664.7 29r.4 1 . 6 5 0 C2 208.30 J6.49 176.07 sQc 26 I l 7 6 665.1 413.3 1.650 209.96 16.45 t72.',73 SQC 26 1366 659.2 483.0 1 . 6 5 0 D I 281.99 36.96 1 6 6 . 3 1 sQc 25 1361 654.7 639.3 1.650 D2 281 21 38 32 203.61 sQc 30 1419 657.0 606.5 1.650 30 203.21 286.60 D3 3 8 . 3 t SQC 1419 657.0 605.2 1 6 5 0","sw
"",*,,",-:gial
"ilfrà*-
"""i"""'-"""i;ii,,iii.'l'"'*#fij';*.nr',ffi"
Al t32.26 27.72 125.19 3Pressure 103.69 5 s 1 7 0.059 t8 84 1 3 1 . 6 5 30.15 134.20 3Pressrre I18.49 557.9 0.053 I L06 0 055 134.39 A3 30.70 138.41 3PressurstRH 98 93 541.0 I 1 . 6 8 8 0 3 0.0s0 31.66 152.11 3Pressure +RH 149.9'l 545.5 B I 140.45 32.61 160ll 3Pressure +RH 148.98 566.2 0.050 8 1 7 B2 1 3 5 . 5 0 32.36 158.29 3Pressure +RH 150.00 568.5 0 050 8 0 0 0.050 32.44 1 3 5 . 6 8 B3 113 39 3Pessure +R}l r50.00 5 8 1 . 8 8 . 0 1 cl 14.13 23.29 209.90 3PressÙre 108.00 514.9 0.051 l 1 9 3 c2 122.87 23.51 t16.47 3 Pressure I 1 5 . 3 8 0 052 1 1 . 8 5 c3 126.50 24.22 189 85 SPressure +RH I 1J.28 5101 0 051 10.44 D1 1 6 8 . 1 6 24.54 l?5 55 3Pressure +RH 150 00 566.4 0.051 9.04 D2 1 6 1 . 8 1 24.38 11874 3Pressure +RH 149.94 568.7 0.050 8.06 24 57 D3 162.39 208.50 3Pressure+RH 149.94 587.2 0 0s0 8 0 t
of RCO2", can only be achieved by increasing the NGCC electrical efficiency. The lowest
RCO2"" of 112.1 gCOzlkWh is reached by solution D3, with similar configuration and physical
parameters as solution 83, but at a cost of 60Â points electrical efficiency degradation and,62%o
COEonit increase, due to utilization of MEA.
A1 A2 A3 A4 B1 82 83 C1 C2 C3 01 D2 03
Fig. 3. Evolution ofCOE with decomposition and CO2 emission rate ofopical solutions
450,0 400 0 3so.o E 300.0 3 zso.o E ë 200,0 6 tro,o { roo.o ô 5 0 0 0 0 t ! E Â d ^250 -Ë 9 rso i 9 Ë _ à -q ,n 6 E 33 a1 A2 a3 À,(
Fig. 4. Evolution of specific equipment cost and elcctriaal efficiency for NGCC, cT and ST of typiaal solutions atong the POF
Fig. 2 and Fig. 3 shows that the driving force for reducing RCO2*,it and RCO2", along the POF mainly rely on two different measures: 1) increasing NGCC electrical efficiency, which
corresponds solutions in segment A, B and D; and 2) increasing the capacity of NGCC with MEA
CO2 separation, which includes solutions in segment C. A RCO2"" reduction poleîtial of 72yo (290 gCOrlkwh) can be achieved through increasing the capacity of NGCC unit with MEA
option from solution Cl to Dl, with a COz abatement cost of only 12 US$/ton COz for solution
Dl when Cl is taken as the reference, or with a with a CO2 abatement cost of 67 USg/ton COz for
solution Dl when Al (400MW conventional NGCC) is taken as the reference. This potential is
much higher than the solutions only relying on efïiciency increase (solutions from A1 to B3), by
which only a RCO2"" reduction of 22 gCO2/kWh can be achieved at a very high CO2 abatement
cost of I 16 US$/ton COz for solution 83 when A1 (400MW conventional NGCC) is taken as the
reference case. These distinct characteristics can be classified as the so-called 'efficiency effect'
and 'COz sequestration a{d grid power substitution effect', which are shown in Fig. 5.
It should be noted that the evaluation of the solutions along the 'efficiency effect' segments,
(segment A, B and D), clearly show the corresponding relations between NGCC electrical
3 9 ;
3 7 :
efficiency improvement and the increase of specific investment cost due to the adoption of
additional measures. This relation can be clearly seen from Table 2 and Fig. 4. With an increased
pressure ratio and gas turbine inlet temperature, the elechical efficiencies of GT, ST and NGCC
increase from Al to 42. When stearn reheat is introduced in solution A3, higher ST cycle electrical efficiency with a higher specific equipment cost results a higher NGCC electrical efficiency. It also allows a lower gas turbine electrical efficiency with lower inlet temperature,
which results in a lower GT specific investment. From A3 to A4, GT inlet temperature increases
again. The SQC GT is introduced starting from solution 81. Although the overall pressure ratio is
of 24, the pressure ratio for lov/ pressure stages is of only 15. This results in a higher exhaust gas
temperatwe and a higher live steam temperature is chosen, compared to solution A4. Therefore a
higher ST cycle efficiency is achieved. Therefore, although the GT efficiency decreases due to
the utilization of lower gas turbine inlet temperature, the overall NGCC electrical efficiency
increased. Meanwhile, a higher GT specific equipment cost is needed due to introduction of SQC
with higher overall pressure ratio. Starting from 81, the pressue ratio and GT inlet temperature
are increasing. The GT and NGCC electrical efficiency as well as their specific equipment cost
therefore increase. When the maximum commercial available pressure ratio of 31 and GT inlet
temperature of 1425 "C are reached, further increase of NGCC efficiency from B2 to 83 mainly rely on the live/reheat steam inlet temperatwe improvement. When the solution jumps in to
segment C, the NGCC electrical efficiency is degraded with a much higher specific equipment
cost compared to solutions in segment A aad B, due to utilization of MEA. When the maximum
capacity for this project of400 MW is reached by solution Dl, a similar behavior that appeared
in segment B can be observed.
With a natural gas price of 1 UScents/kWh, the COE*,;I of solution A1 to B3 are lower than that
of the baseline - the electricity buying price. Therefore, their COz abatement costs in such a case
are negative values. With higher natural gas price or lower electricity buying price, this situation may change dramatically.
When MEA is introduced, the oxygen content in the combustion is also optimized. As seen in
Table 2, a value of l0% to 11% can help the system to reach its minimum cost of electricity.
With similar pressure ratios, a lower excess air ratio is needed when GT inlet temperature
increases, as happened from solution Al to 44. However, with an increased pressure ratio and
higher temperature of inlet air, a higher excess air ratio is needed to control the NOx formationt,
as happens from 81 to B2. A much lower excess air ratio is used when MEA is introduced due to
exhaust gas recirculation (EGR) as shown in Table 2.
The effects of different COz tax levels are shown in Fig. 6. With a COz tax up to 60 US$/ton COz, the most economical solution recognized as global optimal solution (GOS) still remains within the segment of A and B. However, a higher efficiency is chosen for the NGCC (from
GOSO TO GOS60 in Fig. 6) when a higher COz tax is imposed. Although the solutions within the
segment C and D are never chosen as GOS under the given tax level, its local optimal solution
(LOS) moves from C1(LOS30), to a solution in segment D (LOS30) under a 30 US$i ton COz tax.
This means that a maximum capacity NGCC capacity (400MW) will be chosen when MEA must be utilized along with a COz tax of 30 US$/kWh. Meanwhile, LOS30 is even more economical than the baseline in which case all of the electricity is imported form the power grid. This is
1 Dry-NOx technology has been ciosen by the optimizer for all ofthe solutions alolg the POF in order to reach the NOx emtssion limitation of 50 mg/N3 set by the European Parliament and of the Couûcil of 23 Octobe. 2001 on tIe limitation of emissiors of certain pollùtants into the air fiom large combustion plants
because of the CO2 tax penalization to the grid power due to its higher RCO2r.ia. Under a higher
COz tax of 60 US$/ton, a greater effrciency will be chosen for the NGCC as the LOS (LOS 60).
CO2 Abatemeni Peicênrag. (%)
Fig. 5. CO2 abatement cost VS CO2 abatement percentage along the POF with the baseline ofthe power grid
o 100 200 300 400 500 600 700
Averase co2 Emission
Ë:""ïii"^î
ror the Givên Dêlrlând
Fig. 6. Intemalization of different CO2 tax levels
5. Conclusions
A NGCC project with the economic and environmental contexts of Germany is studied based on thermo-economic modelling and multi-objective optimization approach. The Pareto Optimal Frontiers (POF) obtained with multi-objective optimization process provides information on the relatiotship between the cost of the electricity and COz emission rate. The results clearly show the influence of the configuration and technical parameter changes on the evolution of electrical efficiency and the associated specific equipment cost of the combined cycle plant as well as on those of its sub-systems, such as gas turbine cycle and steam cycle. The optimal integrations of such a complex system under different situations can be therefore found with the help of POF. The COz abatement potential through NGCC electrical efficiency improvement is much lower than utilization of MEA in terms of COz abatement quantity and percentage. Meanwhile, when compared to a conventio al NGCC with the same c pacify, a 400MW NGCC with MEA has a
COz abatement cost of 67 US$/ton COz. This is lower than that for a current most advanced
NGCC without MEA option under developing (116 US$/ton COz). The introduction of the CO2
7
t
I ! a - Ba..lln.: \-...'../.r- - . atlorthÈêtEctticjù is GOS O imporlêc,liom lhê gridtax up to 60 US$/ton CO2 may help higher efficiency NGCC penetrating into the market for the given study. However, it is unlikely to make the MEA option becomes economical although this solution is already cheaper than importing electricity from the power grid when a COz tax of 30 US$/ton CO2 is imposed in the analyzed case. The cost of elechicity of a 400MW NGCC unit without MEA option is cheaper than grid power wholesale price assumed in this study (3.8 UScentslkWh). Their COz abatement costs therefore are negative when the power grid is taken as the baseline. However, given the fact that the natural gas and electricity wholesale price varies in a wide range, this situation may changed dramatically.
6. Acknowledgements
The authors would like to thank ALSTOM for the sponsorship of this research. References
t1l IEA, World Energy Outlook 2000.
l2l Pelster St., Favrat D., von Spakovsky MR. The Thermoeconornic and Environomic Modeling and Optimization of the Synthesis, Design and Operation of Combined Cycles with Advanced Options, Joumal of Engineering for Gas Turbines and Power 2001 , 123(4):7l7 -726.
t3l Curti V., von Spakovsky M.R., Favrat D., An Environomic Approach for the Modeling and Optimisation of a District Heating Network based on Cenhalised and Decentralised Heat Pumps, Cogeneration and Gas Furnace' (pârt I ând II), Intemational Joumal of Thermal Sciences 2000, 39(7\:721-741.
l4l Olsommer B., von Spakovsky MR., Favrat D., An Approach for the Time-dependent Thermoeconomic Modeling and Optimization of Energy System Slrrthesis, Design and Operation (Parts I and II: Methodology and Application, ReliabiliÇ and Availability), Intemational Joumal of Applied Thermodynarnics 1999, 2(3): 97-114.
t5l Pelster St., Environomic Modeling and Optimization of Advanced Combined Cycles Cogeneration Power Plants Including CO2 separation Options, Ph. D Thesis, Swiss Federal Institute of Technology Lausanne, 1998
t6l Hendriks C., Carbon Dioxide Removal from Coal-Fired Power Plants. Dordrecht: Kluwer Academic Publishers, 1994
t7l Falk-Pedersen O. and Dannstrom H., Separation of carbon dioxide from offshore gas turbine exhaust. Energy Conversion and ManagemenT,1997.38 SU: p. S8l-586.
t8l Undrum H. et al, Economical Assessment of Natual Gas Fired Combined Cycle Power Plant With CO2 Capture and Sequestration, GHGT-5 PROGRAMME, Australia, 2000.
t9l Herzog H. et al, CO2 Capture, Reuse, and Storage Technologies for Mitigating Global Climate Change - A White Paper. DE-A-F22-96PC01257, Energy Laboratory Massachusetts lnstitute of Technology 1997,
[10] Leyland G., Multi-objective optimization applied to industry energy modeling. Ph. D Thesis, Swrss Federal Institute of Technology Laus anne,2002.
[11] Li H., et al., Green heating system: characteristics and illustration with multi-criteria optimization of an integrated energy system. Energy ,2004. 29(2): p. 225-244.
[12] Burer M., Li H., and Favrât D., Multi-critena optimization of Heat Pump based district heating system in the city of Beijing. in 7th IEA Heat Pump conference. Berjing. 2002.
[3] Burer M., et al., Multicnteria optimization ofa district cogeneration plant integrating a solid oxide fuel cell-gas turbine combined cycle, heat pumps and chillers. Energy, 2003 .28(6): p. a97 -5I8. [14] Li H. et al, Multi-Crjteria Optimization of Pulverized Fuel Coal-fired Po',^rer Generation System
Load dispatching. Proceedings of intemational joint power generation conference Atlanta, Georgia,
![Fig. L Superstructure ofan advanced NGCC with MEA and EGR option [2]](https://thumb-us.123doks.com/thumbv2/123dok_us/10229633.2926834/3.893.119.820.294.601/fig-superstructure-ofan-advanced-ngcc-mea-egr-option.webp)