1
MAE 561
Computational Fluid Dynamics
Final Project
Simulation of Lid Driven Cavity Problem using
Incompressible Navier-Strokes Equation
AKSHAY BATRA 1205089388
2
TABLE OF CONTENTS
1. Abstract………....3 2. Acknowledgement………...4 3. Introduction……….5 4. Problem Statement ……….5 5. Governing Equations………...5 5.1. Stream Function………...5 5.2 Vorticity ……….……...65.2.1 Boundary conditions for the vorticity………6
5.3 Stream function equation………...7
5.4 Successive Over relaxation……… 7
5.5 Pressure Calculation………...7
6. Development of the coding algorithm……….8
7. Results……….9
7.1. Numerical simulation results ………... 9
7.2. Ansys Fluent results………18
8. Conclusions………...……….20
9. References…………...……….. 21
3
1. ABSTRACT
Develop an understanding of the steps involved in solving the Navier-Stokes equations using a numer ica l method. Write a simple code to solve the “driven cavity” problem using the Incompressible- Navier-Stokes equations in Vorticity form. This project requires that the Vorticity streamline function, u and v velocity profiles, pressure contours for the lid driven rectangular cavity for Reynolds number 100 and 1000. The lid driven cavity is a classical problem and closely resembles actual engineering problems that exist in research and industry areas. The vorticity equation will be solved utilizing a forward time central space (FTCS) explicit method. The streamline equation is solved using the successive over relaxatio n method. The obtained results follows and are illustrated in the report.
4
2. ACKNOWLEDGEMENTS
I would take this opportunity to thank Dr. H.P Huang, my instructor for this course, Computational Fluid Dynamics (MAE 561). He has been a great help for me during this course. Without his support I wouldn’t have been able to achieve what I have achieved in this course. He has been very instrumental in my understanding of numerical methods for computational fluid dynamics.
5
3. INTRODUCTION
In previous homework assignments an analysis of a how to solve partial differential equations (PDEs) using point Gauss-Seidel (PGS) iterative method and using forward time center space (FTCS) explicit method has been explored. In this project an analysis will be conducted that will utilize these two methods in one problem. But successive over relaxation (SOR) method would be used as the iteration method. This project will consider a rectangular cavity with a moving top wall. This moving wall will slowly cause the fluid to move within the cavity. It is the final steady state solution that this project seeks to acquire (Re 100 and 1000). Finally the similar problem is computed in ANSYS FLUENT, commercial fluid simulation software and results are compared.
4. PROBLEM STATEMENT
The upper plate of a rectangular cavity shown in Figure 1 moves to the rights with a velocity of uo.
The rectangular cavity has dimensions of L by L. Use the FTCS explicit scheme and the SOR formation tosolve for the vorticity and the stream function equations, respectfully. The cavity flow problem is to be solved for the vorticit y, streamline, pressure contours and u-v profiles for Re=100 and Re 1000. Later, a case has to be solved where the rectangular cavity as dimens io ns 2L and L to obtain same contours.
5. GOVERNING EQUATIONS
5.1 Stream Function
The derivation for the FTCS starts with the vorticity equation seen in Equation 1. It is important to notice how similar this equation is to the 2-D Navier-Stokes momentum equation.
(1)
Equation 1 then has a forward difference Taylor Series expansion for first derivatives applied to the first term, a central difference Taylor Series expansion for first derivatives applied to the second term and third term, and
6 central difference Taylor Series for second derivative applied to the fourth and fifth term. The result is shown in Equation 2.
(2)
Also if, in equation 1,
𝑢 =
𝜕𝛹𝜕𝑦
, 𝑣 = −
𝜕𝛹𝜕𝑥
(3)
Then, the values of u and v are substituted in equation 1 to obtain equation 3,
𝜕𝛺 𝜕𝑡
= -
𝜕𝛹 𝜕𝑦 𝜕𝛺 𝜕𝑥+
𝜕𝛹 𝜕𝑥 𝜕𝛺 𝜕𝑦+
1 𝑅𝑒{
𝜕 𝜕𝑥(
𝜕𝛺 𝜕𝑥) +
𝜕 𝜕𝑦(
𝜕𝛺 𝜕𝑦)
}
(4)For this problem we are considering, dx=dy=ds, thus the final discretized equation becomes,
𝛺
i,j,n+1=
𝛺
i,j,n- dt[(
𝛹
i,j+1,n-
𝛹
i,j-1,n)
(
𝛺
i+1,j,n- 𝛺
i-1,j,n)]
4ds*ds
- dt[(
𝛹
i+1,j,n-
𝛹
i-1,j,n)
(
𝛺
i,j+1,n- 𝛺
i,j-1,n)]
4ds*ds
+
dt[
(𝛺
i+1,j,n- 𝛺
i-1,j,n- 𝛺
i,j+1,n- 𝛺
i,j-1,n- 4
𝛺
i,j,n)]
(5)Re* ds*ds
Where dt is the time step and ds is the space step.
5.2 Vorticity
5.2.1 Boundary conditions for the Vorticity
The
boundary conditions for the vorticity stream line approach is quite complicated. The boundary conditions were formulated using the lecture notes (scan set 20) and equations 8-111 to 8-117 in the book. For our problem the boundary conditions are:-At the bottom wall (
j
=1):
𝛺
wall= {
𝛹
i,1–
𝛹
i,2}
2
𝑑𝑠^2
+ U
wall 2𝑑𝑠
(6)
At the top wall (
j
=ny):
𝛺
wall= {
𝛹
i,ny–
𝛹
i,ny-1}
2
𝑑𝑠^2
- U
wall 2𝑑𝑠
(7)
At the left wall (i=1)
𝛺
wall= {
𝛹
1,j–
𝛹
2,j}
2
𝑑𝑠^2
+ U
wall 27
At the bottom wall (i=nx)
𝛺
wall= {
𝛹
nx,i–
𝛹
nx-1,j}
2
𝑑𝑠^2
- U
wall 2𝑑𝑠 (9)
5.3 Stream Function equation
Below is the poisson equation that is used for stream function and is referred as elliptic PDE. Once the stream function is calculated the velocity values (u,v) can be determined using equation 3.
𝜕 𝜕𝑥
(
𝜕𝛹 𝜕𝑥) +
𝜕 𝜕𝑦(
𝜕𝛹 𝜕𝑦) = −𝛺
(10) Discretized version of equation 10 is shown below
dx=dy=ds
−𝛺 = 𝛹
i+1,j,n+
𝛹
i-1,j,n+
𝛹
i,j+1,n+
𝛹
i,j-1,n-4
𝛹
i,j,nds^2
(11)For solving the elliptical equation, we obtain,
𝛹
i,j,n+1=
.25
(𝛹
i+1,j,n+
𝛹
i-1,j,n+
𝛹
i,j+1,n+
𝛹
i,j-1,n+ ds*ds*
𝛺
i,j,n)
(12)
5.4 Successive Over relaxation (SOR)
The method of successive over-relaxation (SOR) is a variant of the Gauss–Seidel method for solving a linear system of equations, resulting in faster convergence. A similar method can be used for any slowly converging iterative process.
𝛹
i,j,n+1=β*
0.25
(𝛹
i+1,j,n+
𝛹
i-1,j,n+1+
𝛹
i,j+1,n+
𝛹
i,j-1,n+1+ ds*ds*
𝛺
i,j,n)
+
(1- β)
i,j,n (13)If β=1 in equation 13, then the method becomes gauss seidel method.
If β>1 in equation 13, method for the iteration is referred to over relaxation method. If β<1 in equation 13, method for the iteration is referred to under relaxation method.
5.5 Pressure Calculation
The pressure was calculated using the streamline function. The pressure calculation in the stream vorticity approach uses the stream function to calculate the value of pressure at all the grid points. The equation used for the calculation of the pressure is shown below.
2
P = 2*RHS
where, rhs is the right hand side of the pressure equation
RHS =
{
𝜕
𝜕𝑥
(
𝜕𝛹
𝜕𝑥
)
𝜕
𝜕𝑦
(
𝜕𝛹
𝜕𝑦
)
− (
𝜕
𝜕𝑦
(
𝜕𝛹
𝜕𝑥
)
)^2 }
8
6. DEVELOPMENT OF CODING ALGORITHM
The coding algorithm is illustrated with a block diagram. The code can be seen directly following the block diagram. The block diagram illustrates a short synopsis of how the code is employed to solve the vorticit y equation.
Initialize Variables ∆t ,∆x, ∆y, u=0, v=0, 𝛹=0, 𝛺=0
Start the time integration And solve for stream function
Find Vorticity on the boundaries
Find the RHS of the Vorticity
Input the new values of Vorticity in interior
Increment Time
Pressure and velocity calculation
9
7. RESULTS: NUMERICAL SIMULATION
Task I
Case I- Re1000 (taskI)
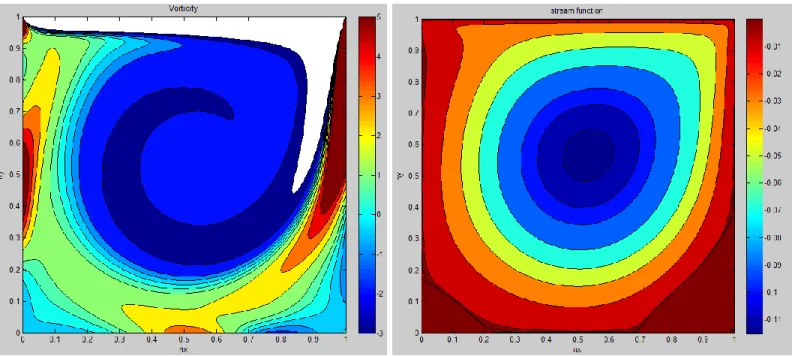
Shown below is the vorticity (a) and stream function (b) and stream function (with smaller contours levels) (c) in figure 2
Figure 2. (a). Vorticity when Re =1000 (b). Steam Function when Re =1000
10 Shown below is the U velocity (a) and V velocity (b) plot in figure 3
Figure 3. (a). U-velocity when Re =1000 (b). V-velocity when Re =1000
Case II- Re 100 (task I)
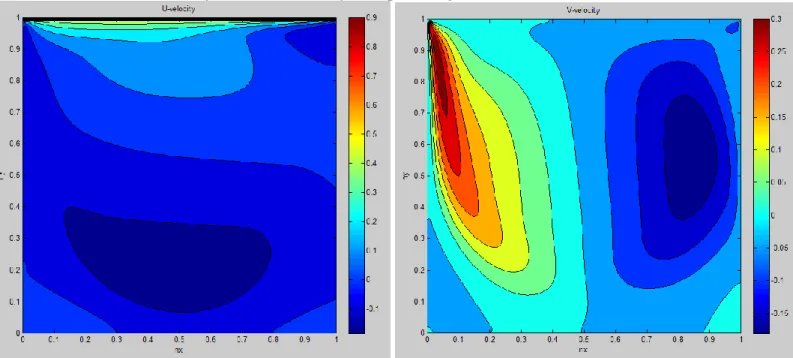
Shown below is the U velocity (a) and V velocity (b) plot in figure 4
11 Shown below is the vorticity (a) and stream function (b) plot in figure 5
Figure 5. (a). Vorticity when Re =100 (b). Steam Function when Re =100
Task II
12 Task III
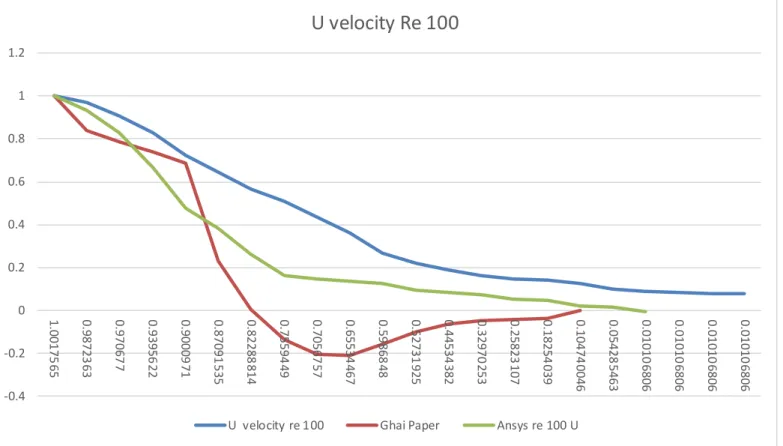
Figure 7. U- Velocity compassion/validation plots for Re=100.
Figure 8. V- Velocity compassion/validation plots for Re=100.
-0.4 -0.2 0 0.2 0.4 0.6 0.8 1 1.2 1.0 01 75 65 0 .9 8 7 2 3 6 3 0 .9 7 0 6 7 7 0 .9 3 9 5 6 2 2 0 .9 0 0 0 9 7 1 0.8 70 91 53 5 0 .8 2 2 8 8 8 1 4 0.7 55 94 49 0 .7 0 5 6 7 5 7 0.6 55 34 46 7 0 .5 9 8 6 8 4 8 0.5 27 31 92 5 0 .4 4 5 3 4 3 8 2 0 .3 2 9 7 0 2 5 3 0.2 58 23 10 7 0 .1 8 2 5 4 0 3 9 0.1 04 74 00 46 0 .0 5 4 2 8 5 4 6 3 0.0 10 10 68 06 0 .0 1 0 1 0 6 8 0 6 0.0 10 10 68 06 0 .0 1 0 1 0 6 8 0 6
U velocity Re 100
U velocity re 100 Ghai Paper Ansys re 100 U
-0.6 -0.5 -0.4 -0.3 -0.2 -0.1 0 0.1 0.2 0.3 0.4 1 0.9 9 7 2 3 0 9 0 .9 7 1 6 8 3 8 0 .9 3 2 3 5 3 5 6 0 .8 9 1 0 2 3 6 0 .8 5 3 5 7 1 9 5 0 .8 1 4 0 7 3 7 4 0.7 70 56 44 4 0.7 15 09 97 5 0.6 77 42 55 0.6 23 89 42 0.5 82 25 18 0.5 32 71 98 5 0.4 99 03 72 4 0.4 51 51 67 8 0.4 00 06 71 8 0 .3 5 0 6 0 9 4 8 0 .2 9 3 2 6 6 2 0 .2 4 1 8 7 9 1 0 .1 9 8 4 0 4 9 2 0 .1 2 7 3 1 7 5 3 0 .0 7 9 9 6 1 1 0 .0 4 8 4 3 8 3 1 0 .0 1 8 8 8 3 9 9
V- Velocity for re 100
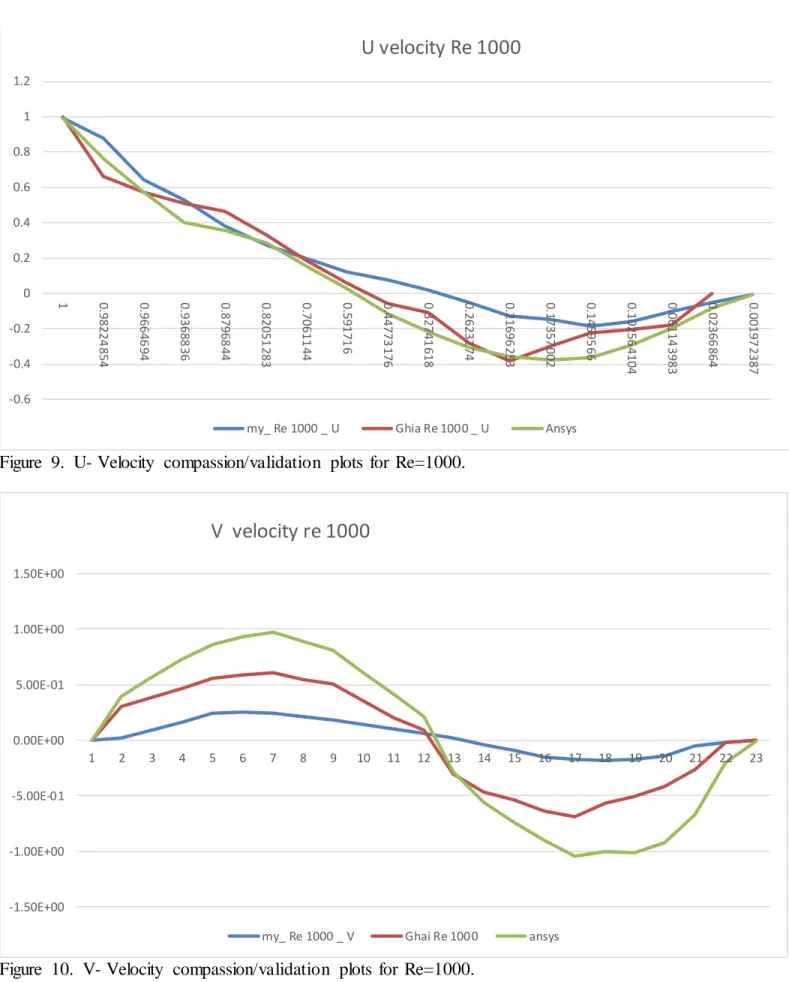
13 Figure 9. U- Velocity compassion/validation plots for Re=1000.
Figure 10. V- Velocity compassion/validation plots for Re=1000.
-0.6 -0.4 -0.2 0 0.2 0.4 0.6 0.8 1 1.2 1 0.9 8 2 2 4 8 5 4 0.9 66 46 94 0.9 36 88 36 0 .8 7 9 6 8 4 4 0 .8 2 0 5 1 2 8 3 0.7 06 11 44 0.5 91 71 6 0 .4 4 7 7 3 1 7 6 0 .3 2 7 4 1 6 1 8 0.2 62 32 74 0.2 16 96 25 3 0 .1 7 3 5 7 0 0 2 0 .1 4 5 9 5 6 6 0.1 02 56 41 04 0.0 61 14 39 83 0 .0 2 3 6 6 8 6 4 0 .0 0 1 9 7 2 3 8 7
U velocity Re 1000
my_ Re 1000 _ U Ghia Re 1000 _ U Ansys
-1.50E+00 -1.00E+00 -5.00E-01 0.00E+00 5.00E-01 1.00E+00 1.50E+00 1 2 3 4 5 6 7 8 9 10 11 12 13 14 15 16 17 18 19 20 21 22 23
V velocity re 1000
14 Note: The x axis in all the plots is the distance (x or y distance) and Y axis is the velocity (u or v)
Task IV
Shown below is the vorticity (a) and stream function (b) plot in figure11
Figure 11. (a). Vorticity when AR=2 (b). Steam Function when AR=2
Shown below is the U velocity (a) and V velocity (b) plot in figure 12
15 Task 5
Reynolds Number = 10000 (task 5)
Shown below is the vorticity (a) and stream function (b) plot in figure 13
Figure 13. (a). Vorticity when Re =10000 (b). Steam Function when Re =10000 Shown below is the U velocity (a) and V velocity (b) plot in figure 14
16 (c). Steam Function when Re =10000 (t=0) (c). Steam Function when Re =10000 (t=0.328)
17 Figure 14. (a). U-velocity when Re =1000 (b). V-velocity when Re =1000
18
7.1 RESULTS ANSYS : FLUENT RESULTS
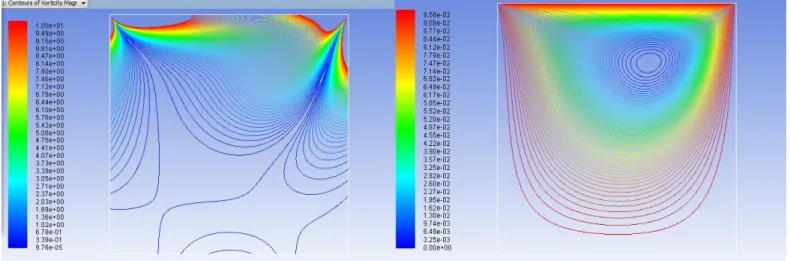
1) Case I - Reynolds Number 1000
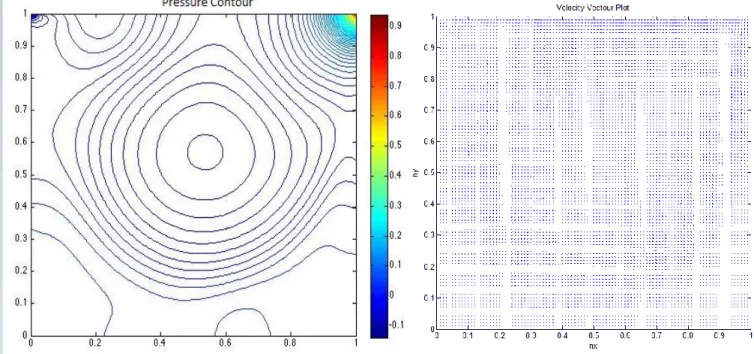
Figure 16. (a). Velocity vector for Re 1000 (b). Steam Function when Re =1000 (with vortices) [4] To get the corner vortices , the contour levels are adapted from [4].
19 Case I - Reynolds Number 100
Figure 18. (a). Vorticity when Re =100 (b). Steam Function when Re =100
20
9. CONCLUSIONS
This project was the summary of what was learnt in this course during this semester. We started with the 1-D problems and moved toward the more complicated problems. The last homework was particularly helpful in finding the solutions of this project. This project closely resemble actual engineering problems and thus an important aspect of MAE 561 Computational fluid dynamics. The vorticity equation and a single moving wall the fluid was driven in a circular path. The contours for the vorticity and streamline function was presented for both the aspect ratio 1(task I) as well as 2(task IV). The velocity contour and pressure contour was also presented for re 1000 (task II). This is an intuitive solution; however, a precise solution would be extremely difficult, if not impossible, because it depends on the grid size, space step and time steps and many other factors.
21
10. REFERENCES
[1]Arakawa, A., 1966: Computational design for long-term numerical integration of teh equations of fluid motion [2]Two-dimensional incopressible flow, Part I, Journal of Computational Physics, 1, 119-143 Bruneau, C.-H., and M. Saad, 2006: The 2-D cavity driven flow revisited, Computers and Fluids, 35,
326-348
[3]Ghia, U., K. N. Ghia, and C. T. Shin, 1982: High-Re solutions of incompressible flow using the Navier-Stokes equations and a multigrid method, Journal of Computational Physics, 48, 387-411
22
11. APPENDIX
%Author AKSHAY BATRA
%MAE 561 Computational Fluid Dynamics
%FINAL PROJECT - LID DRIVEN CAVITY FLOW IN RECATANGULAR CAVITY %Due on Dec 12 2014.
clear all
close all
clf;
nx=101;ny=101; nt=100000; re=1000; dt=0.001;% Settting the initial parameters
no_it=100000;% number of iterations
Beta=1.5;% relaxation factors
err=0.001;% parameter for SOR iteration
ds=.01;%dx=dy=ds
x=0:ds:1; y=0:ds:1;%dimensions of the cavity
t=0.0;
phi=zeros(nx,ny); omega=zeros(nx,ny); % initializing the variables
u = zeros(nx,ny); v = zeros(nx,ny); x2d=zeros(nx,ny); y2d=zeros(nx,ny);
b=zeros(nx,ny);p=zeros(nx,ny);pn=zeros(nx,ny);
w=zeros(nx,ny); %p-q/(nx-1),
%---%Stream Function calculation
for t_step=1:nt % time steps starts
for iter=1:no_it % streamfunction calculation
w=phi; % by SOR iteration
for i=2:nx-1; for j=2:ny-1 phi(i,j)=0.25*Beta*(phi(i+1,j)+phi(i-1,j)+phi(i,j+1)+phi(i,j-1)+ds*ds*omega(i,j))+(1.0-Beta)*phi(i,j); end end Err=0.0; for i=1:nx for j=1:ny Err=Err+abs(w(i,j)-phi(i,j)); end end if Err <= err, break;
end % stop if iteration has converged
end
%---%boundary conditions for the Vorticity
for i=2:nx-1
for j=2:ny-1
omega(i,1)=-2.0*phi(i,2)/(ds*ds); % bottom wall
omega(i,ny)=-2.0*phi(i,ny-1)/(ds*ds)-2.0/ds; % top wall
omega(1,j)=-2.0*phi(2,j)/(ds*ds); % right wall
omega(nx,j)=-2.0*phi(nx-1,j)/(ds*ds); % left wall
23
end
%---% RHS Calculation
for i=2:nx-1;
for j=2:ny-1 % compute
w(i,j)=-0.25*((phi(i,j+1)-phi(i,j-1))*(omega(i+1,j)-omega(i-1,j))... -(phi(i+1,j)-phi(i-1,j))*(omega(i,j+1)-omega(i,j-1)))/(ds*ds)... +(1/re)*(omega(i+1,j)+omega(i-1,j)+omega(i,j+1)+omega(i,j-1)-4.0*omega(i,j))/(ds*ds); end end %---% Update the vorticity
omega(2:nx-1,2:ny-1)=omega(2:nx-1,2:ny-1)+dt*w(2:nx-1,2:ny-1);
t=t+dt; % increment the time
for i=1:nx for j=1:ny x2d(i,j)=x(i); y2d(i,j)=y(j); end end %---%calculation of U and V for i = 2:nx-1 for j = 2:ny-1 u(i,j)=(phi(i,j+1)-phi(i,j))/(2*ds); v(i,j)=(phi(i+1,j)-phi(i,j))/(2*ds); u(:,ny) = 1; v(nx,:) =.02; end end end %---%calculation of pressure rhs=zeros(nx,ny); for i=2:nx-1 for j=2:ny-1 rhs(i,j)=(((phi(i-1,j)-2*phi(i,j)+phi(i+1,j))/(ds*ds))... *((phi(i,j-1)-2*phi(i,j)+phi(i,j+1))/(ds*ds)))... - (phi(i+1,j+1)-phi(i+1,j-1)-phi(i-1,j+1)+phi(i-1,j-1))/(4*(ds*ds));
p(i,j)=(.25*(pn(i+1,j)+pn(i-1,j) + pn(i,j+1)+pn(i,j-1))- 0.5*((rhs(i,j)*ds^2*ds^2)));
end
pn=p;
end
%---% Visualization of the results
figure(1)
contourf(x2d,y2d,omega,[-3:1:-1 -0.5 0.0 0.5 1:1:5 ]),xlabel('nx'),...
ylabel('ny'),title('Vorticity');axis('square','tight');colorbar
title('Vorticity') % plot vorticity
figure(2)
contour(x2d,y2d,phi,[10^-10 10^-7 10^-5 10^-4 0.0100...
24
ylabel('ny'),title('stream function');axis('square','tight');colorbar %streamfunction
figure(3)
contourf(x2d,y2d,u),xlabel('nx'),ylabel('ny'),...
title('U-velocity');axis('square','tight');colorbar
figure(4)
contourf(x2d,y2d,v),xlabel('nx'),ylabel('ny'),...
title('V-velocity');axis('square','tight');colorbar
figure(5)
contourf(x2d,y2d,p,([-2.0:.01:2])),xlabel('nx'),ylabel('ny'),...
title('pressure');
figure(6)
quiver (x2d,y2d,u,v)...
,xlabel('nx'),ylabel('ny'),title('Velocity Vectour Plot'); axis([0 1 0
1]),axis('square')
%---%I have been able to get the vorticies in the stream function contour at the corner but %they are really small(for re 100). I have run the solution to 100,000 iteration at a %time step of .001. It took 9-10 hours for the solution to compute.Then