Ipser, A. (2014). Individual differences in audiovisual integration and timing. (Unpublished Doctoral thesis, City University London)
City Research Online
Original citation: Ipser, A. (2014). Individual differences in audiovisual integration and timing. (Unpublished Doctoral thesis, City University London)
Permanent City Research Online URL: http://openaccess.city.ac.uk/11892/
Copyright & reuse
City University London has developed City Research Online so that its users may access the research outputs of City University London's staff. Copyright © and Moral Rights for this paper are retained by the individual author(s) and/ or other copyright holders. All material in City Research Online is checked for eligibility for copyright before being made available in the live archive. URLs from City Research Online may be freely distributed and linked to from other web pages.
Versions of research
The version in City Research Online may differ from the final published version. Users are advised to check the Permanent City Research Online URL above for the status of the paper.
Enquiries
If you have any enquiries about any aspect of City Research Online, or if you wish to make contact with the author(s) of this paper, please email the team at [email protected].
1
I
NDIVIDUAL
D
IFFERENCES
I
N
A
UDIOVISUAL
I
NTEGRATION
AND
T
IMING
A
LBERTA
I
PSER
A
THESIS SUBMITTED TO THE
D
EPARTMENT OF
P
SYCHOLOGY
C
ITY
U
NIVERSITY
L
ONDON
FOR THE DEGREE OF
D
OCTOR OF
P
HILOSOPHY
3
T
ABLE OF
C
ONTENTS
1 Chapter 1: Introduction___________________________________________ 25
1.1 Measuring audiovisual synchrony perception ________________________ 27 1.1.1 Synchrony judgements (SJ) and Temporal order Judgements (TOJ) ____ 27 1.1.2 Audiovisual synchronisation during audiovisual integration __________ 33 1.1.3 Implicit versus explicit temporal judgements _____________________ 37 1.2 Individual differences ___________________________________________ 41 1.3 Voxel-Based Morphometry _______________________________________ 45 1.4 Audiovisual integration and synchronisation, Reading ability and Dyslexia _ 47 1.5 Summary and Thesis outline ______________________________________ 50 2 Chapter 2: Disunity across Implicit and Explicit estimates of subjective
synchrony _________________________________________________________ 53 2.1 Introduction __________________________________________________ 53 2.1.1 The case for common temporal mechanisms across different audiovisual processes ______________________________________________________ 54 2.1.2 The case for multiple, distinct synchronisation mechanisms _________ 59 2.2 Experiment 2.1: McGurk _________________________________________ 66 2.2.1 Methods __________________________________________________ 66 2.2.2 Results ___________________________________________________ 73 2.3 Experiment 2.2: Stream bounce ___________________________________ 76 2.3.1 Methods __________________________________________________ 76 2.3.2 Results ___________________________________________________ 81 2.4 Individual subject analyses of SJ data _______________________________ 84 2.4.1 McGurk ___________________________________________________ 86 2.4.2 Stream Bounce _____________________________________________ 87
4
2.4.3 Summary _________________________________________________ 88 2.5 Discussion ____________________________________________________ 90 2.5.1 SJ ePSS and iPSS ____________________________________________ 90 2.5.2 TOJ ePSS and iPSS __________________________________________ 92 2.5.3 Theoretical accounts ________________________________________ 94 2.5.4 Conclusion _______________________________________________ 101 3 Chapter 3: Size does matter: Morphological Correlates of Implicit and explicit temporal processing and audiovisual integration _________________________ 103
3.1 Introduction _________________________________________________ 103 3.1.1 Neural correlates of audiovisual synchrony processing and perception 105 3.1.2 Neural correlates of temporal order ___________________________ 113 3.1.3 Neural correlates of audiovisual integration in the McGurk Effect ____ 120 3.1.4 Quantifying performance in implicit and explicit temporal processing 136 3.1.5 Voxel-Based Morphometry __________________________________ 141 3.2 Experiments 3.1 and 3.2 ________________________________________ 143 3.2.1 Methods _________________________________________________ 143 3.2.2 Results __________________________________________________ 147 3.3 Discussion ___________________________________________________ 159 4 Chapter 4: Read my lips. Audiovisual timing and integration and Dyslexia __ 169 4.1 Introduction _________________________________________________ 169 4.1.1 Phonological accounts of Dyslexia _____________________________ 170 4.1.2 Speech processing: Auditory and visual ________________________ 171 4.1.3 Unisensory Temporal processing in dyslexia _____________________ 171 4.1.4 Audiovisual processing, dyslexia and reading ____________________ 179 4.2 Experiments 4.1 - 4.4 __________________________________________ 186 4.2.1 Methods _________________________________________________ 186
5
4.3 Results: Audiovisual Speech Integration and Timing __________________ 188 4.3.1 Reading ability across Dyslexia and Control groups _______________ 188 4.3.2 Audiovisual Speech Synchrony Judgements Dual task (SJ) __________ 189 4.3.3 Audiovisual Speech Temporal Order Judgements Dual task (TOJ) ____ 195 4.4 Results: Audiovisual Non-Speech: Stream Bounce ____________________ 200 4.4.1 Reading ability across Dyslexia and Control groups _______________ 200 4.4.2 Audiovisual Non-Speech Synchrony Judgements Dual task (SJ) ______ 201 4.4.3 Audiovisual Non-Speech Temporal Order Judgements Dual task (TOJ) 205 4.5 Additional Analyses used for interpretation _________________________ 209 4.6 Results Summary ______________________________________________ 210 4.7 Discussion ___________________________________________________ 212
4.7.1 Performance in Explicit audiovisual temporal processing is poorer in dyslexic Readers for speech but not for non-speech stimuli _____________ 212 4.7.2 Implicit temporal processing is impaired in dyslexia _______________ 215 4.7.3 Audiovisual integration in dyslexia ____________________________ 217 4.7.4 Conclusion _______________________________________________ 221 4.7.5 Revisiting the negative correlation from chapter 2 ________________ 223
5 Chapter 5: General Discussion ____________________________________ 225
5.1 Overview ____________________________________________________ 225 5.2 Chapter 2 ____________________________________________________ 226 5.2.1 Implications, limitations and future developments of Chapter 2 _____ 228 5.3 Chapter 3 ____________________________________________________ 231 5.3.1 Implications limitations and future developments of chapter 3 ______ 232 5.4 Chapter 4 ____________________________________________________ 233 5.4.1 Implications limitations and future developments of chapter 4 ______ 234 5.5 Summary ____________________________________________________ 238
7
L
IST OF
F
IGURES
Figure 1-1: Typical a. TOJ trial and b. SJ trial ... 27
Figure 1-2: Hypothetical data of a synchrony judgement (SJ) task. ... 28
Figure 1-3: Hypothetical data of a temporal order judgement (TOJ) task ... 29
Figure 1-4: Range of PSS values reported in literature for simple stimuli such as beeps and flashes.. 30
Figure 1-5: Range of just-noticeable difference values reported in literature, for different types of stimuli. ... 32
Figure 1-6: Proportion of illusory responses plotted as a function of auditory lag and fitted with a psychometric function. ... 34
Figure 1-7: The McGurk Illusion... 35
Figure 1-8: Figure borrowed from van Wassenhove et al. (2007), illustrating the temporal profile of the McGurk illusion. ... 36
Figure 1-9: Illustration of the Stream-Bounce illusion ... 37
Figure 2-1: Illustration of the unity assumption. ... 54
Figure 2-2:Figure borrowed from Lewald & Guski (2003) ... 57
Figure 2-3: Temporal windows of AV integration and perceived synchrony for incongruent speech from van Wassenhove et al. (2007).. ... 59
Figure 2-5: Figure borrowed from Soto-Faraco & Alsius (2007), depicting temporal order judgement data superimposed onto phoneme identification of McGurk AV stimuli ... 61
Figure 2-7: Psychometric data for PH from Freeman et al. (2013) ... 64
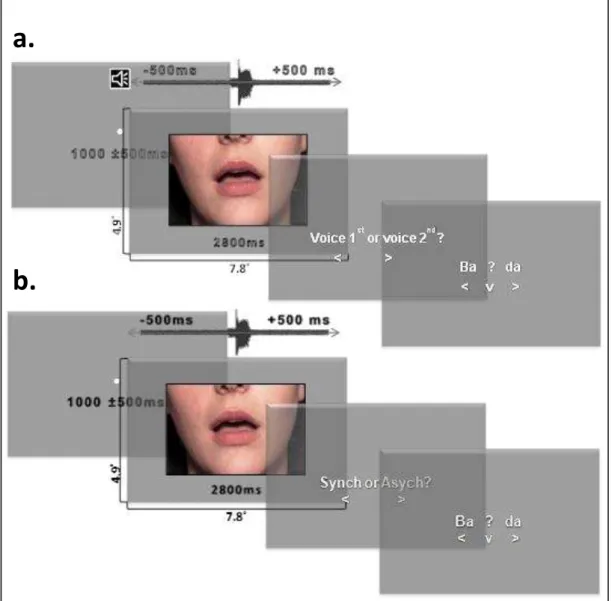
Figure 2-9: Trial sequence and stimuli for McGurk TOJ and SJ dual task. ... 68
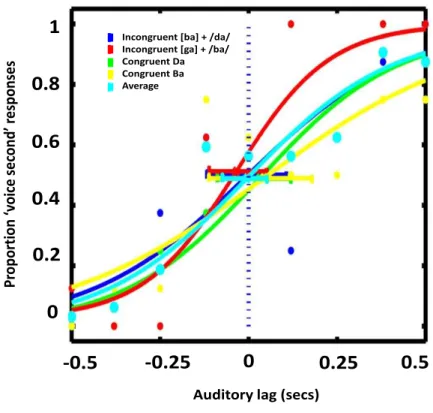
Figure 2-10: Raw TOJ data fitted with psychometric functions ... 69
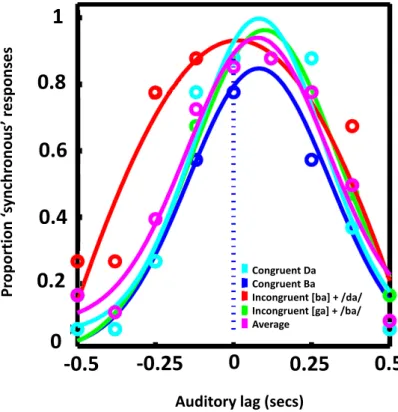
Figure 2-11: Raw SJ data fitted with psychometric functions fitted ... 70
Figure 2-12: Raw McGurk data fitted with ADS functions ... 72
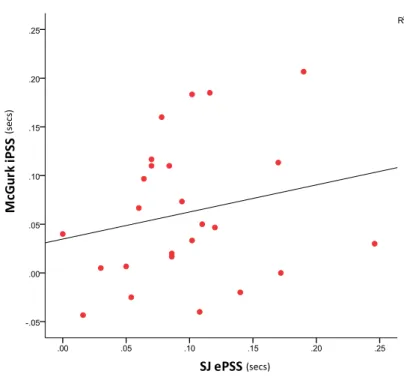
Figure 2-13: Scatter plot of significant negative correlation between McG iPSS and TOJ ePSS ... 73
Figure 2-14: Scatter plot of non-significant negative correlation between McG iPSS and SJ ePSS ... 74
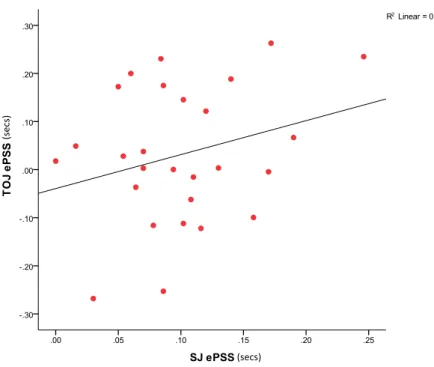
Figure 2-15: Scatter plot of (non-significant) correlation between TOJ ePSS and SJ ePSS ... 75
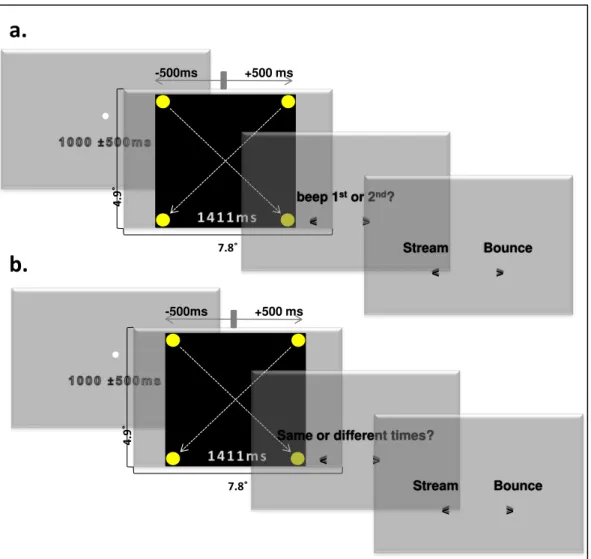
Figure 2-16: Trial sequence and stimuli for the Stream Bounce TOJ and SJ dual-tasks ... 78
Figure 2-17: Example of fitting procedure for synchrony judgement data. ... 79
Figure 2-18 Example of fitting procedure for Stream/Bounce data. ... 79
Figure 2-19: Example of fitting procedure for TOJ data.. ... 80
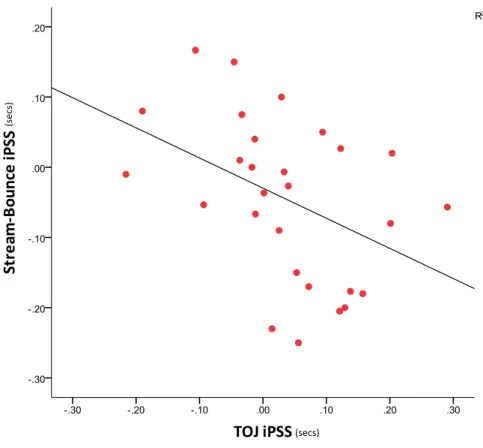
Figure 2-20: Scatter plot of significant negative correlation between Stream-Bounce iPSS and TOJ ePSS ... 81
Figure 2-21: Scatter plot of significant positive correlation between SJ ePSS and Stream-bounce iPSS, driven solely by one outlier ... 82
8
Figure 2-22: Scatter plot of non-significant correlation between SJ ePSS and Stream-bounce iPSS,
without the outlier ... 83
Figure 2-23: Subject by subject data preparation ... 85
Figure 2-24: Distribution of regression results for McGurk-SJ dual-task data. ... 86
Figure 2-25: Distribution of regression results for Stream-Bounce-SJ dual-task data. ... 87
Figure 2-26: Temporal renormalisation theory.. ...100
Figure 3-1: Figure borrowed from Stevenson et al. (2011) showing the areas with greater activity for integrated versus non-integrated AV stimuli and areas with greater activity for synchronous versus asynchronous AV stimuli ...112
Figure 3-2: Areas previously identified by fMRI research to be involved in AV and unisensory temporal order processing. ...118
Figure 3-3: Areas previously identified by fMRI research to be involved in AV synchrony processing. ...118
Figure 3-4: AV Temporal order processing and synchrony processing areas previously identified in the literature, superimposed for comparison. ...119
Figure 3-5: Areas previously identified in fMRI studies to show greater activity during AV McGurk Integration ...125
Figure 3-6: Areas previously identified in previous fMRI literature to show increased activity during McGurk integration, AV temporal order processing and AV synchrony processing ...132
Figure 3-7: Hypothetical profiles of AV integration. ...134
Figure 3-8: Hypothetical SJ data ...137
Figure 3-9 Hypothetical SJ data fitted with Noisy criterion fits. ...138
Figure 3-10: Examples of Noisy Criterion functions fitted to SJ data. ...144
Figure 3-11: Example of Noisy criterion function fitted to phoneme ID (McGurk) data. ...145
Figure 3-12: Example of TOJ data fitted with a Cumulative Gaussian function ...146
Figure 3-13: Scatter plots of significant correlations between the temporal processing performance measures.. ...148
Figure 3-14 ROI masks covering the STG and MTG ...151
Figure 3-15: Results of the MTG/STG ROI analysis for explicit timing measures . ...152
Figure 3-16 Results of the MTG/STG ROI analysis for TOJ SD and SJ win ...153
Figure 3-17: Results of the MTG/STG ROI analysis for SJ SD ...153
Figure 3-18: Results of the MTG/STG ROI analysis for McG Win and McG Max ...154
Figure 3-19: Results of the MTG/STG ROI analysis for McG Max ...155
Figure 3-20: Results of the MTG/STG ROI analysis for McG Win ...155
Figure 3-21: Results from MTG/STG ROI analysis across implicit and explicit tasks ...156
Figure 3-22: Meta-mask based on previous fMRI literature on temporal order processing, synchrony processing and McGurk AV integration. ...157
9
Figure 3-23: Results of Meta-mask ROI analysis for McG Max ... 158
Figure 3-24: Grey matter volume cluster in right STG correlated with Susceptibility to the McGurk illusion in the context of AV Integration areas previously identified by fMRI studies ... 163
Figure 3-25: Grey matter volume clusters in right temporal cortex correlated with TOJ SD, SJ SD, SJ Win and McG Win in the context of areas previously identified as related to AV temporal processing by fMRI studies. ... 164
Figure 4-1: Excluded McGurk integration data, fitted with noisy criterion fits. ... 189
Figure 4-2: Boxplot of SJ SD measures for the Control and Dyslexia groups ... 191
Figure 4-3: Boxplot of McG SD measures for the Control and Dyslexia groups. ... 192
Figure 4-4: Bar Chart of average measures of the window of AV Integration ... 193
Figure 4-5: Bar Chart of average measures of the maximum AV Integration. ... 194
Figure 4-6: Example of unreliable and reliable TOJ data ... 195
Figure 4-7: Bar chart of average measures of TOJ SD ... 196
Figure 4-8: Bar chart of average measures of McGurk SD ... 198
Figure 4-9: Box plot for average measures of McG Win ... 198
Figure 4-10: Bar chart of average measures of McG Max ... 199
Figure 4-11: Example of unreliable Stream-Bounce data ... 202
Figure 4-12: Bar chart of average measures of Stream-Bounce SD (in contextof SJs) ... 203
Figure 4-13: Bar chart of average measures of Stream-Bounce SD (in context of TOJ) ... 207
Figure 4-14: Bar charts of average measures of Bounce Max ... 208
Figure 4-15: Scatter plot of significant negative correlation between Bounce SD and Stream-Bounce Max in the TOJ Dual task. ... 209
Figure 4-16: Scatter plot of significant negative correlation between Bounce SD and Stream-Bounce Max in the TOJ Dual task ... 210
Figure 5-1: Underlying cognitive processes contributing to SJs, TOJs and AV integration, with separate underlying temporal mechanisms for the different three tasks. ... 227
11
L
IST OF
T
ABLES
Table 2-1: Shapiro Wilk statistics for normality of distribution of TOJ ePSS and McG iPSS ________ 73 Table 2-2: Shapiro Wilk statistics for normality of distribution of SJ ePSS and McG iPSS __________ 74 Table 2-3: Shapiro Wilk statistics for normality of distribution of TOJ ePSS and Sream-Bounce iPSS 81 Table 2-4: Shapiro Wilk statistics for normality of distribution of SJJ ePSS and Stream-Bounce iPSS 82 Table 3-1: Areas identified in fMRI studies: AV Synchrony/asynchrony detection ___________ 110 Table 3-2: Areas previously identified in TOJ research ____________________________________ 116 Table 3-3: Areas previously identified in TOJ research (continued) __________________________ 117 Table 3-4: Areas identified in fMRI/PET studies: AV integration using McGurk illusion __________ 121 Table 3-5: Areas identified in fMRI/PET studies: AV integration using McGurk illusion (continued) 122 Table 3-6: Areas identified in fMRI/PET studies: AV integration using McGurk illusion (continued) 123 Table 3-7: Summary of behavioural correlations of Chapter 3______________________________ 148 Table 3-8: Cluster level statistics temporal cortex MTG/STG ROI analysis ____________________ 156 Table 3-9: Cluster Level Statistics of Meta-Mask ROI results _______________________________ 158 Table 4-1: Parametric assumption statistics for the reading ability variables __________________ 188 Table 4-2: Means and standard deviations of reading ability measures ______________________ 189 Table 4-3: Parametric assumptions for the explicit synchrony judgment measures _____________ 190 Table 4-4: (non-significant) t-test statistics for group differences in SJ PSS and SJ Win __________ 191 Table 4-5: Parametric assumptions tests for implicit AV timing measures and AV integration ____ 192 Table 4-6: Parametric assumptions tests for explicit AV temporal order judgement measures____196 Table 4-7: Parametric assumptions tests for implicit AV timing measures and AV integration ____ 197 Table 4-8: Parametric assumption statistics for reading ability data _________________________ 200 Table 4-9: Means and standard deviations for reading ability measures _____________________ 200 Table 4-10: Parametric assumptions test statistics for explicit AV synchrony measures _________ 201 Table 4-11: Parametric assumptions tests for implicit AV timing measures and AV integration ___ 202 Table 4-12: Parametric assumption statistics for TOJ SD and TOJ ePSS _______________________ 205 Table 4-13: Parametric assumptions statistics for AV integration and implicit timing measures. __ 206 Table 4-14: Summary of Chapter 4 results _____________________________________________ 211
13
A
CKNOWLEDGEMENTS
I would like to thank the Psychology department at City University London, who, through their award of studentship made the work in this thesis possible.
I am grateful to my family for their support throughout my years of higher education.
I will always be thankful to have had the opportunity to carry out my research degree alongside amazing past and present PhD students in the Psychology Department at City University , whose friendship and moral support has kept my sanity in check.
I would like to thank the CNRU lab for providing a motivating and friendly work environment.
I am grateful to those whom I have had the opportunity to collaborate with and the skills I have learned from them, in particular Ryota Kanai and Marinella Cappelletti.
I would like to thank Dr Richard Cook for giving me the opportunity to further my research career whilst finishing this thesis.
Finally, I would like to express the deepest gratitude to my supervisor, Dr Elliot Freeman for the amazing guidance, encouragement and inspiration he provided me with throughout my PhD training and for his ceaseless amount of patience and trust in my abilities.
15
D
ECLARATION
I grant powers of discretion to the University Librarian to copy this thesis in part or in whole without further reference to me. This covers only single copies for study purposes. The contents of this thesis are subject to normal conditions of
17
A
BSTRACT
Sight and sound are processed in different parts of the brain and at different times, creating discrepancies between the relative arrival time of auditory and visual information at primary and multisensory cortices. Despite this, a commonly accepted view is that the brain strives for and achieves temporal unity across different sensory modalities. Using individual differences in subjective synchrony and audiovisual temporal processing, this thesis examines whether audiovisual synchronisation across different audiovisual processes is ever actually achieved and whether the timing of multisensory events is supported by unified or disparate mechanisms. Chapter 2 examines whether estimates of subjective synchrony across audiovisual integration and explicit temporal judgements are consistent within and between individuals. This chapter finds remarkable disunity in subjective
audiovisual timing within individuals, characterised by negatively correlated
estimates of perceptual asynchrony across tasks, which challenge existing accounts of how the nervous system maintains temporal coherence. Instead, a new theory of temporal renormalisation is proposed, whereby the relative timing of audiovisual signals within different mechanisms is perceived relative to the average timing across mechanisms. Chapter 3 reveals that individual differences in audiovisual synchronisation across different tasks are reflected in the structural variability of distinct brain clusters, suggesting that audiovisual relative timing is processed by multiple task-specific temporal mechanisms, whose performance is supported by distinct neural substrates. Chapter 4 explores the possibility that these perceptual mechanisms might contribute to reading ability, which is audiovisual in nature. Aspects of audiovisual temporal processing are found to be impaired in dyslexia and linearly related to reading ability. Altogether this thesis provides novel
contributions to the understanding of the underlying mechanisms of audiovisual temporal processing as well as of its relationship to higher cognitive functions.
19
Abbreviations
AV: AudiovisualePSS: Point of explicit subjective synchrony iPSS: Point of implicit subjective synchrony JND: Just-Noticeable Difference
McG: McGurk
MFG: Middle Frontal Gyrus MTG: Middle temporal gyrus PSS: Point of subjective synchrony SB: Stream-Bounce
SD: Standard deviation (here, of cumulative Gaussian) SJ: Synchrony Judgements
STG: Superior temporal Gyrus STS: Superior temporal Cortex
TMS: Transcranial Magnetic Stimulation TOJ: Temporal order judgements
VBM: Voxel-Based Morphology
Win: Window of synchrony/ AV integration
/ /: slashes indicate auditory speech sound of graphemes inside them [ ]: brackets indicate visual lip-movements of graphemes inside them
21
G
LOSSARY
Explicit point of subjective synchrony (ePSS): The audiovisual asynchrony at which participants perceive audiovisual stimuli as synchronous, which can be measured using temporal order judgements or synchrony judgements.
Implicit point of subjective synchrony (iPSS): The audiovisual asynchrony at which participants integrate audiovisual information most often, which can be measured using audiovisual illusions as a function of audiovisual asynchrony.
Temporal order judgements (TOJ): Temporal judgement task in which participants have to indicate the temporal order of audiovisual events presented at various audiovisual asynchronies. In the current thesis, participants were asked to indicate whether the sound came first or second.
Synchrony judgements (SJ): Temporal judgement task in which participants have to indicate whether audiovisual stimuli pairs presented at various audiovisual
asynchronies are synchronous or asynchronous.
Temporal window of synchrony (SJ Win): Represents the range of audiovisual asynchronies within which individuals explicitly perceive audiovisual information to be synchronous. In this thesis, the temporal Window of audiovisual synchrony is derived from SJ data, and estimated by calculating the difference in means of the
t o u ulati e Gaussia s fitted to p opo tio of s h o ous espo ses plotted
as a function of auditory lag. Higher measures represent smaller temporal specificity of audiovisual synchrony perception.
Temporal window of audiovisual integration (McG/Stream-bounce Win):
Represents the range of audiovisual asynchronies within which individuals integrate audiovisual information. In this thesis, the temporal Window of audiovisual
integration is estimated by calculating the differences in means of the two cumulative Gaussians fitted to proportion of audiovisual integration plotted as a function of auditory lag. Higher measures represent smaller temporal specificity of audiovisual integration.
22
Explicit discrimination of audiovisual synchrony: Represents how abruptly an observer switches from a synchronous response to an asynchronous response in SJ and from a sound first to a sound second response in TOJ, as a function of
audiovisual asynchrony. This aspect of explicit temporal processing performance is estimated using the standard deviation of the single cumulative Gaussian fitted to TOJs, and the mean standard deviation of the two cumulative Gaussians fitted to SJs. Higher measures represent poorer sensitivity.
Implicit discrimination of audiovisual synchrony: Represents how abruptly an
o se e s ate of audiovisual integration decreases as a function of audiovisual asynchrony. This aspect of implicit temporal processing performance is estimated using the average standard deviation of the two cumulative Gaussians fitted to audiovisual integration data. Higher measures represent poorer sensitivity.
Implicit temporal processing: Processing of audiovisual relative timing which is not necessarily consciously accessed by the observer, for example during audiovisual integration.
Explicit temporal processing: Process which underlies the conscious access to the relative timing of audiovisual information, for example during SJs and TOJs.
Just noticeable difference: The smallest audiovisual asynchrony which can be detected reliably by an observer. Higher measures represent poorer sensitivity.
Dyslexia: A neurobiological condition characterised by reading problems such as recognition, spelling and decoding of words, despite otherwise typical reading instruction and educational or professional attainment.
Voxel-Based Morphometry (VBM): Voxel-wise analysis of the local concentration of grey matter, which can be used in group comparisons as well as correlational
investigations. In this thesis VBM was used to correlate individual differences in behavioural measures with individual differences of local grey matter volume.
Temporal recalibration: A shift in the perception of audiovisual relative timing or synchrony after prolonged exposure to a constant audiovisual asynchrony,
23
represented by a shift in the PSS. This shift occurs in the direction of the audiovisual asynchrony observers are exposed to e.g. after exposure to a constant and
prolonged auditory lag, auditory-lagging audiovisual stimuli will be more likely to be perceived as synchronous. Also referred to as temporal adaptation, recalibration is believed to maintain temporal coherence across sensory modalities.
Renormalisation: audiovisual synchrony estimates within localised, task-specific temporal mechanisms are assessed in relation to the average asynchrony across all temporal mechanisms, leading to an antagonistic relationship between estimates of subjective timing.
McGurk illusion: audiovisual speech illusion whereby auditory perception of a speech sound is affected by incongruent visual information. For example, observers will often hear /da/ when viewing lip-movements uttering [ga] presented together with the speech sound /ba/.
Stream-Bounce Illusion: audiovisual non-speech illusion whereby the perceived trajectory of a pair of visual stimuli is affected by the occurence of a single beep. Two identical disks are displayed at each corner of a computer display, after which each one begins to move along a downward diagonal trajectory, crossing over each other at the midpoint of the display. Presenting a beep at or near the collision point increases likelihood of perceiving the disks colliding and changing trajectory.
25
1
C
HAPTER
1:
I
NTRODUCTION
Our senses are constantly flooded with sensory information belonging to different modalities, some of which originate from a common source and others which do not. For accurate and reliable interpretation of the environment, sensory streams which share various cues which transcend vision and audition are integrated into multisensory events. Temporal coincidence is one such cue and is viewed to be probably the most important amodal factor in audiovisual (AV) integration (e.g. Keetels & Vroomen, 2012; Spence & Squire, 2003). Presumably because in the natural world events which occur at the same time often originate from the same source, streams of AV information are more likely on average to be integrated when they are synchronous rather than asynchronous (Lewald & Guski, 2003; Meredith & Nemitz, 1987; van Atteveldt, Formisano, Blomert, & Goebel, 2007; van Wassenhove, Grant, & Poeppel, 2007). For example, AV synchrony is such a
compelling cue, that when presented at the same time, visual and auditory
information originating from different sources is bound together and perceived to originate from a single location (Slutsky & Recanzone, 2001).
The task of audiovisual synchronisation is unlikely to be computationally
straightforward. For example, at approximately 300 million metres per second, the speed of light is much faster than the 340 metres per second at which sound travels through air. As a result, the visual component of an audiovisual event will always reach an observer before the auditory component (King, 2005; Spence & Squire, 2003). The difference between the arrival times of auditory and visual stimuli at sensory receptors will also increase as a function of the observer-stimulus distance (Sugita & Suzuki, 2003). Internally however, light energy has to be converted into chemically mediated nervous impulses and then in turn, into electrical signals. This process takes around 50ms longer than acoustic transduction, in which mechanical energy in the form of vibrations physically opens ion channels in the cochlear nerve, producing action potentials. Neural transmission time within the visual system is
26
also longer compared to the auditory system, further increasing the temporal disparity between the time auditory and visual signals reach their relevant destinations (King, 2005). When travelling from a distance of 15m, known as the horizon of simultaneity, auditory and visual signals are said to arrive at primary sensory cortices at the same time (Pöppel, 1988). At distances shorter than the horizon of simultaneity, visual signals are said to lag the auditory whereas at
distances beyond it they are said to lead. Auditory and visual signals have to then in turn converge on various multimodal sites in order to be processed as multisensory events (Benoit, Raij, Lin, Jääskeläinen, & Stufflebeam, 2010; Bertini, Leo, AVenanti, & Làdavas, 2010; Noesselt, Bergmann, Heinze, Münte, & Spence, 2012; Sekiyama, 2003). These cortical destinations will likely depend on the type of information being processed and the task being performed. The relative arrival time of auditory and visual signals will vary as a function of the cortical site at which they converge. Together, this is likely to lead to a cacophony of estimates of the relative timing of audiovisual information across different mechanisms.
The following introduction will begin with a description of the way in which
audiovisual synchrony perception is measured using tasks which require observers to explicitly access information about the relative timing of AV information. This will be followed by an overview of two AV integration tasks which can be used to
measure synchrony perception implicitly, without the need for the observer to make explicit judgements on the relative timing of AV information. The introduction will then discuss the potential benefits of examining behavioural individual
differences in AV temporal processing as well as individual variability in brain structure in order to inform on the potential underlying mechanisms of explicit temporal judgements and AV integration.
27
Figure 1-1: Typical a. TOJ trial and b. SJ trial in which the light precedes the sound.
1.1
M
EASURING AUDIOVISUAL SYNCHRONY
PERCEPTION
1.1.1
S
YNCHRONY JUDGEMENTS(SJ)
ANDT
EMPORALORDER
J
UDGEMENTS(TOJ)
Conscious or explicit access to the relative timing of AV events can be particularly useful in everyday life. For example, animators who work in the film industry are required to synchronize the movements of animated characters to the speech and sounds previously recorded by voice and sound effects artists. Television or film editors also have the task of synchronising pre-recorded audio with film clips to ensure that any delays are unnoticeable (Advanced Television Systems Committee, 2003). Although a proportion of such tasks are performed using automated
software, the final outcome also contains human judgement. In the laboratory, subjective perception of AV synchrony (e.g. Navarra, Alsius, Velasco, Soto-Faraco, & Spence, 2010; Vatakis & Spence, 2006; Yarrow, Jahn, Durant, & Arnold, 2011) and sensitivity to the relative timing of crossmodal events (Keetels & Vroomen, 2005; Nicol & Shore, 2007; Roseboom, Nishida, Fujisaki, & Arnold, 2011; Vatakis & Spence, 2006) can be measured using simultaneity judgements (SJ) or temporal order judgements (TOJ), both of which require explicit access to the relative timing of AV events (Martin, Giersch, Huron, & van Wassenhove, 2012).
In both SJ and TOJ
paradigms (see Figure 1.1 for typical trials),
audiovisual stimuli pairs are presented to
participants at various stimulus onset
asynchronies (SOA). For SJs individuals are asked to determine whether the
28
auditory and visual streams were presented synchronously or asynchronously. The
p opo tio of s h o ous espo ses is the plotted as a function of auditory lead or lag. As shown in Figure 1.2, this forms a bell shaped curve from which the
asynchrony corresponding to the highest p opo tio of si ulta eous espo ses can be read. This asynchrony represents the o se e s point of subjective
simultaneity (PSS). For TOJs, individuals are asked to determine the temporal order in which the auditory and visual components of the AV stimulus were presented.
The P opo tio of sou d fi st o light fi st espo ses is then plotted as a function of auditory lead or lag.
(secs)
Figure 1-2: Hypothetical data of a synchrony judgement (SJ) task, in which participants judge whether the sound and light occurred synchronously or asynchronously. The point of subjective synchrony (PSS) is value on the x axis which correspo nds to the peak of the psychometric curve, i other ords the highest proportio of s hro ous respo ses. I this s e ario, the PSS is observed when the auditory and visual information is presented synchrony. The just -noticeable difference (JND) is typically derived by halving the distance between the two SOAs at which the parti ipa t respo ded s hro ous 7 % of the ti e. Here, the JND is roughl s.
29
As shown in Figure 1.3 below, this forms a “ shaped u e to hi h a u ulati e Gaussian function is normally fitted. The asynchrony at which participants respond to chance (in other words at which equal proportions of sound first and sound second responses are observed) ep ese ts the pa ti ipa t s P““.
Another measure that is derived from TOJ and SJ curves is the Just Noticeable Difference (JND). This measure represents the smallest asynchrony at which an observer can reliably judge whether the visual and auditory components were presented synchronously or the temporal order in which an AV stimulus was presented. For SJs, this measure is usually derived by halving the distance between the two “OAs at hi h the pa ti ipa t espo ded s h o ous 75% of the time ( (Vroomen & Keetels, 2010) (see Figure 1-2 on the previous page).
(secs)
Figure 1-3: Hypothetical data of a temporal order judgement (TOJ) task. The point of subjective synchrony (PSS) is the asynchrony on the x axis that corresponds to a response proportion of 0.5. Here, it is observed when the auditory and visual information are presented synchronously. The just-noticeable difference (JND) is traditionally estimated by halving the difference between the AV asynchronies at which response rates are 0.75 and 0.25. Here, the JND is roughly 50ms.
30
For TOJs, the JND is calculated by halving the distance between the SOAs at which
the pa ti ipa t espo ded sou d fi st % a d % (e.g. Spence et al., 2003) and reflects the slope of the cumulative function (see Figure 1-3 on previous page). The JND is often used as a measure of AV temporal resolution (Marja Laasonen, Service, & Virsu, 2002) which is the ability to discriminate between synchronous and
asynchronous AV stimuli (Vatakis & Spence, 2008b). Alternatively, the standard deviation of the function can be used to represent sensitivity to temporal order or synchrony (Yarrow et al., 2011)
TH E EXPLI CI T POI N T OF SU BJEC TI VE SYN CH RON Y (EPSS) 1.1.1.1
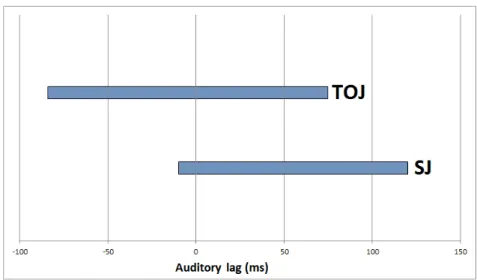
Values of the ePSS derived using SJs tend to vary between -10ms (Fujisaki, Shimojo, Kashino, & Nishida, 2004) and as much as 120ms (Dixon & Spitz, 1980). Negative values indicate that auditory information is leading the visual when synchrony is maximally perceived. Average PSS values derived using TOJs generally tend to be more negative than those derived from SJs (see Figure 1-4 below for comparison), in that the auditory stimulus needs to lead the visual in order for the observer to make chance-level decisions about temporal order (van Eijk, Kohlrausch, Juola, & van De Par, 2008). Measures of the TOJ PSS have been reported to lie anywhere between -84ms (Vatakis & Spence, 2006) to +75ms (Zampini, 2003) for simple stimuli like beeps and flashes. The PSS derived from SJs is on average more likely to be either closer to physical AV synchrony or visually lagging, so that the visual
Figure 1-4: Range of PSS values reported in literature for simple stimuli such as beeps and flashes. Negative Auditory lag indicates that the auditory stimulus was presented first.
31
information needs to lead in order for participants to view the two streams as synchronous. As this concurs with what is known regarding the neural transmission of visual and auditory information, SJs have been thought to be the preferred method of measuring the PSS (van Eijk et al., 2008).
PSS values, in particular those derived from TOJs, seem to depend on the modality on which attention is placed (Massimiliano Zampini, Shore, & Spence, 2005), stimulus complexity (Vatakis & Spence) and intensity. Observer stimuli distance (Sugita & Suzuki, 2003) can also lead to different measures of PSS, although this view is debated (see Vroomen & Keetels, 2010 for a review). The PSS is also affected by where the observer sets their decision criteria when making temporal judgements. As a result, two individuals with different measures of PSS may actually process AV information at the same relative timing but may place their decision criteria at different AV asynchronies.
DI SC RI MI N ATI ON OF A U DI OVI SU AL TE MPO RAL ORDER AN D
1.1.1.2
ASYN CH RON Y
The ability to discriminate the temporal order of AV events depends on stimulus complexity and on whether the two events originate from the same or from different locations. For example when simple beeps and flashes originate from different locations, the order in which they are presented, i.e. sound first or light first, can be reliably discriminated when the two are separated by as little as 20ms to 58ms but when they are presented in the same place, discrimination becomes poorer and JND measures range between 36ms-90ms (Eskes, Klein, Dove, Coolican, & Shore, 2007; Hirsh & Sherrick, 1961; Keetels & Vroomen, 2005; Spence et al., 2003; Zampini, 2003). The temporal order of more complex stimuli like AV musical notes or monkey vocalisations is reliably judged at slightly longer AV asynchronies, ranging from 58ms to 109ms (Vatakis, Ghazanfar, & Spence, 2008; Vatakis & Spence, 2006, 2008b). AV speech stimuli such as syllables and words has been reported to be reliably judged correctly when the audio and video streams are separated by as little as 59ms to as much as 150ms (Salvador Soto-Faraco & Alsius,
32
2007; Vatakis, Ghazanfar, et al., 2008; Vatakis & Spence, 2006, 2007, 2008b). These values are illustrated in Figure 1-5, below.
The methodology used to derive estimates of the ability to discriminate AV
synchrony from asynchrony using SJs varies from study to study. For example, some examine the temporal window of AV synchrony (e.g. Cook, van Valkenburg, & Badcock, 2011; Petrini et al., 2009; van Wassenhove et al., 2007) which represents the range of AV asynchrony within which observers judge auditory and visual events as synchronous. This measure can be computed in different ways. For example, Petrini et al. (2009) and Vroomen and Stekelenburg (2011) estimated the window of synchrony by computing the standard deviation of the normal
distribution curve fitted to the raw data. Petrini et al. (2009) reported the width of the window for drumming actions and sounds to range from 100 to 200ms
depending on the observers usi al e pe tise, with experts having smaller windows. Vroomen and Stekelenburg (2011) reported that the window of synchrony was approximately 170ms for both speech and sine-wave speech replicas. van Wassenhove et al. (2007) defined the window of synchrony as the Figure 1-5: Range of just-noticeable difference values reported in literature, for different types of stimuli.
33
range between the two points at which synchronous responses decreased
sig ifi a tl o eithe side of the s h o ous response distribution. These points were defined by an asymmetrical double sigmoid function fitting procedure. The authors reported that congruent AV speech stimuli were perceived to be
synchronous when presented at asynchronies anywhere between 73ms auditory-leading to 131ms auditory-lagging asynchronies, totalling a temporal synchrony window width of 204ms (van Wassenhove et al., 2007). Other studies measured the distance between the two points at which stimuli are judged synchronous 75% of the time (Soto-Faraco & Alsius, 2009) and reported that observers judge AV speech as synchronous at asynchronies anywhere between 70ms auditory-leading and 234ms auditory-lagging. Another method of operationalising AV temporal
sensitivity is by deriving the slopes of the two separate cumulative functions fitted to each side of the raw SJ data, split by the a i u s h o ous espo se proportions (van Eijk et al., 2008). These measures are difficult to compare because although they represent AV temporal sensitivity, they are derived in different ways and are not necessarily analogous to one another.
1.1.2
A
UDIOVISUAL SYNCHRONI SATION DURINGAUDIOVISUAL INTEGRATI ON
Psychophysical research has predominantly employed explicit timing judgements to measure the characteristics of AV synchrony perception and the mechanisms that underlie it. AV synchronisation does however also occur implicitly, as part of AV integration (Martin et al., 2012). Whilst this type of AV synchronisation has been measured more in the context of AV integration and its temporal constraints, it has not been discussed or used much in the context of AV synchrony processing. Implicit synchronisation refers here to a processing of AV timing which does not require conscious effort on the part of the observer. It also reflects the way in which implicit measures analogous to the PSS and JND usually measured using explicit temporal judgements can be derived. The observer is not asked to attend to the temporal characteristics of AV stimuli, nor are they asked to make explicit judgements on AV relative timing. Auditory and visual stimuli are still presented at
34
various SOAs, but the perceptual judgement required of the observer is related to
the hat athe tha to the he aspe t of the sti uli. Measu i g the plotti g
audiovisual integration as a function of AV asynchrony, instead of temporal
judgements, results in a bell shaped curve similar to that which results from SJs (e.g. Asakawa, 2008; Fujisaki, Shimojo, Kashino, & Nishida, 2004). As illustrated in Figure 1-6 above, the asynchrony at which AV integration maximally occurs can then be read from the point on the x axis which corresponds with the peak of the function and taken to represent the implicit point of subjective synchrony (henceforth iPSS). Implicit temporal sensitivity can be derived from measures which reflect the degree to which audiovisual integration occurs beyond its optimal asynchrony, such as the width of the curve, or the slopes of its sides. The slopes can be estimated using the standard deviation of the function(s) fitted to the data or using methods in which the JND or window of synchrony is derived from SJ data, described in section 1.1.1.2.
TH E MCGU RK I L LU SI ON
1.1.2.1
Audiovisual integration can measured using a variety of methods. Probably the most famous AV speech illusion is the McGurk-MacDonald illusion (henceforth the McGurk effect; McGurk & MacDonald, 1976). Introducing a mismatch between the information conveyed by auditory and visual streams can give rise to a subjective
Figure 1-6: Proportion of illusory responses plotted as a function of auditory lag (negative values indicate auditory lead), and fitted with a psychometric function. The asynchrony at which AV integration is maximal, denoted here iPSS, can then be read from the x axis and taken to represent the point of implicit subjective synchrony.
35
percept which is either qualitatively different than both the visual and auditory components of the stimulus presented, or reflect a combination of the two. For example, as depicted in Figure 1-7 a. above, when presented with the auditory phoneme /ba/ and the incongruent lip movement [ga], observers often report hearing /da/; the same effect is seen with the phonemes /pa/ and [ka], which results in the subjective auditory percept /ta/. For presentations of phonemes such as auditory /ba/ and visual [da], observers will often report hearing /bda/, a
combination of the information conveyed by the two modalities, as seen in Figure 1.7 b. On average, this illusion occurs maximally roughly when the auditory and visual streams are presented synchronously and decreases in strength as AV asynchrony increases (Soto-Faraco & Alsius, 2009; Soto-Faraco & Alsius, 2007; van Wassenhove et al., 2007).
The average asynchrony at which the McGurk effect peaks has been reported to be around the point when the auditory stream lags the visual by approximately 60-70ms (e.g. Asakawa, 2008; Munhall, Gribble, Sacco, & Ward, 1996b; van
Wassenhove et al., 2007), suggesting that AV synchrony may not be the optimal condition for AV integration. The McGurk effect also does not seem to entirely break down once the auditory and visual streams are separated by seemingly large asynchronies such as 233ms (Asakawa, 2008), 240ms Munhall et al., 1996) and Figure 1-7: The McGurk Illusion. a. depicts the Fusion illusion in which the AV information is fused into a new auditory percept and b. depicts the combination illusion in which the observer reports hearing a combination of the visual and auditory information, or th e phoneme conveyed by the lip -movements only.
36
267ms (van Wassenhove et al., 2007, see Figure 1.8 for illustration of the temporal profie of the McGurk illusion).
Figure 1-8: Figure borrowed from van Wassenhove et al. (2007), illustrating the temporal profile of the McGurk illusion. As absolute asynchrony increases, illusory respo nses decrease and veridical auditory driven responses increase .
The temporal window of AV integration in the McGurk effect has been reported to be on average around the same width as the window of temporal integration measured using synchrony judgements, which is around 200ms, but has been reported to be smaller than the window of asynchrony for some stimulus combinations (e.g van Wassenhove et al., 2007). Another study (Soto-Faraco & Alsius, 2009) however reported illusory McGurk responses to occur equally as or more often than veridical responses within a much wider temporal window, ranging between 320ms auditory-leading to 480ms auditory-lagging.
TH E STREA M-BOU N CE I LLU SI ON
1.1.2.2
Implicit synchronisation can also be measured using AV illusions that do not rely on speech stimuli. For example, in the Stream-Bounce illusion (Sekuler, Sekuler, & Lau, 1997) depicted in Figure 1-9 on the next page, the perceived trajectory of a pair of visual stimuli is affected by the occurrence of a single beep. Two identical disks are displayed at each corner of a computer display. Each disk then begins to move along a downward diagonal trajectory, crossing over the other disk at the midpoint of the display, each of them eventually reaching the opposite corner of the screen.
37
The disks a tual t aje to is to a ds the opposite side of the s een, as the two
disks e o e o e i the e t e of the displa a d the efo e st ea th ough o e
another. Despite this, the display can also be interpreted as the disks bouncing against each other in the center, resulting in a perceived change of trajectory towards the same side of the screen. The addition of a single auditory beep when the two disks are positioned at or around the midpoint, increases the likelihood of a
ou e pe ept. As the as h o et ee the eep a d the ollisio poi t of
the disks increases, the proportion of bounce responses decreases (Fujisaki et al., 2004), which is qualitatively similar to the temporal profile of the McGurk illusion.
1.1.3
I
MPLICIT VERSUS EXPLI CIT TEMPORAL JUDGEMENTSAlthough implicit and explicit synchrony judgements produce similar data that can be fitted in the same way and compared, this does not necessarily mean that the two types of tasks measure analogous temporal processing ability. As Chapter 2 and 3 will discuss and demonstrate, implicit and explicit temporal processing may not rely on common underlying mechanisms (Soto-Faraco & Alsius, 2009; Soto-Faraco & Alsius, 2007). This is problematic for interpreting research which uses explicit
temporal judgement paradigms to operationalise AV integration (Petrini et al., 2009; Vatakis & Spence; 2007) or which discusses findings related to the perception of synchrony to AV integration (Vatakis & Spence, 2007). For instance, Vatakis and Figure 1-9: Illustration of the Stream-Bounce illusion. Red and yellow dotted lines represent perceived trajectory a. scenario where there is no sound and a corresponding percept of streaming. b. scenario where the sound occurs at the same time as the point at which the disks meet in the centre of the display and the corresponding percept of bouncing. c. Hypothetical probability of Bou e per ept as a fu tio where the disks are located on the display when the beep occurs.
38
Spence (2007) investigated the effects of the unity assumption on the temporal window of AV integration of speech stimuli, and operationalised the latter using measures of the JND from temporal order judgements. Navarra et al. (2005) also measured performance on temporal order judgements after exposure to
asynchronous speech and took poorer discriminability of AV temporal order to represent a widening of the temporal window of audiovisual integration.
The windows of AV synchrony and AV integration seem to be different, suggesting that the mechanisms underlying the two tasks might also differ. Soto-Faraco & Alsius (2007) measured temporal order perception as well as AV integration using the McGurk effect. The window between auditory-leading and lagging asynchronies within which responses were correct less than 75% of the time was taken to
represent the range of AV asynchronies within which participants were uncertain of AV temporal order, and therefore perceived the stimuli to be synchronous. This range was reported to be between 94ms leading and 208ms auditory-lagging asynchronies. On the other hand, the window within which McGurk
responses were equal to or greater than veridical responses (i.e., the window of AV integration) was reported to lie between 400ms auditory-leading and 480ms auditory-lagging asynchronies. Therefore, the window of synchrony for TOJs was 304ms whereas the temporal window of McGurk integration was 880ms, which is more than twice as large as the window of AV synchrony.
Petrini et al. (2009) investigated the effects of expertise on synchrony perception but refer to the window of synchrony as the window of AV integration. The authors also discuss their rationale and findings interchangeably in the context of
audiovisual integration and synchrony perception. Using explicit temporal judgements to represent AV integration would be acceptable if explicit temporal judgements and AV integration were reliant on the same underlying mechanisms. However, if these tasks do not reflect the same underlying processes doing so could lead to invalid accounts of AV integration and timing.
AV integration tasks and explicit temporal judgements are also subject to different response biases. AV integration tasks are in theory less prone to decision bias,
39
because the responses given by participants in implicit AV timing tasks do not relate to the timing of the stimuli. For example in SJs, a widening of the window of
synchrony ould efle t a ias to a ds espo di g s h o ous o e ofte as opposed to a tendency to actually perceive AV stimuli as synchronous when they are asynchronous. This could result from the observer relaxing their decision criteria regarding what is synchronous and asynchronous in order to increase their confidence in their judgements. In contrast, in the McGurk effect there is no intuitive reason as to why participants would use or loosen such criteria within which they would report that they heard the syllable [da] as opposed to [ba] as the task is not directly related to judging AV relative timing. As a result, the temporal window of AV integration may be less ambiguous to interpret than the temporal window of perceived synchrony. Critically, in regards to the interpretation of effects, certain manipulations might result in a widening or shortening of SJ windows of synchrony as a result of shifts in decision criteria, but they might not have the same effect on the temporal window of integration. Therefore, using synchrony judgements to operationalise AV integration might lead to invalid
interpretation of the temporal constraints and characteristics of AV integration, and this is especially true if the two tasks measure the performance of two different mechanisms.
Research which investigates the way in which the nervous system might minimize external audiovisual delays by adapting to them is predominantly carried out using explicit temporal order and synchrony judgements, which in principle measure the ability to explicitly access and judge AV relative timing (Heron, Hanson, & Whitaker, 2007; Roseboom & Arnold, 2011; Vatakis, Navarra, Soto-Faraco, & Spence, 2008; Vroomen, Keetels, de Gelder, & Bertelson, 2004). For example, temporal
recalibration occurs when exposure to asynchronous AV information results in AV streams which were perceived as being asynchronous prior to exposure, to be perceived as synchronous post exposure (Fujisaki et al., 2004; Hanson, Heron, & Whitaker, 2008; Vatakis, Navarra, et al., 2008). This phenomenon is thought to reflect mechanisms which maintain temporal coherence across modalities, in spite of internal and external factors which create temporal disparities between sensory
40
information that occur synchronously. Such factors include differences between transduction and propagation of auditory and visual signals, or in the time taken by auditory and visual information to reach an observer (Fujisaki et al., 2004; Hanson et al., 2008; Keetels & Vroomen, 2007). These temporal adaptation effects are often tested using SJs (Roseboom & Arnold, 2011) and TOJ tasks (Luca, Machulla, & Ernst, 2009; Vatakis, Navarra, Soto-Faraco, & Spence, 2007) and less often using AV integration paradigms (but see Asakawa, 2008 and Fujisaki et al., 2004). Although some of the studies restrict the discussion of the results to mechanisms underlying explicit synchrony perception (Luca et al., 2009; Roseboom, Nishida, & Arnold, 2009), others (e.g. Vatakis et al., 2007) generalise theoretical conclusions to temporal mechanisms underlying AV integration, which is problematic because it has not yet been established whether AV integration and explicit temporal judgements rely on the same temporal mechanisms.
To summarise, the foregoing studies used explicit timing judgements as means of measuring AV integration or have generalised findings obtained using explicit temporal judgements to temporal mechanisms underlying AV integration. This would not be problematic if explicit and implicit synchronisation processes are indeed supported by the same underlying mechanisms. However, whether AV integration and explicit AV temporal judgements are supported by common or distinct mechanisms has not yet been directly tested until now. This issue is discussed is more depth in Chapters 2 and 3. In Chapter 2, the question is
addressed by examining whether measures of subjective synchrony derived from implicit and explicit AV temporal judgements are consistent within individuals. In Chapter 3, the question is addressed by examining whether the ability to
discriminate between synchronous and asynchronous AV information across implicit and explicit temporal judgements is statistically dependent or independent and whether it is related to variability in the structure of similar or distinct brain clusters. These chapters use a different approach to the one that has been adopted by literature so far. Instead of examining data across participants, this thesis
41
qualitatively different tasks covary within individuals. The rationale and benefits of this approach is discussed in the next section.
1.2
I
NDIVIDUAL DIFFERENCES
A relatively large proportion of what is known about the temporal profiles of AV integration and the perception of AV synchrony and temporal order is based on data which have been averaged out across participants. However, the temporal profiles of AV integration and of AV synchrony perception (Martin et al., 2012), measures of the implicit (Freeman et al., 2013) and explicit PSS (Boenke, Deliano, & Ohl, 2009; Stone et al., 2001) and susceptibility to AV illusions (Nath & Beauchamp, 2012) have been reported to be subject to individual differences. For example, studies which focus on AV integration have often had to exclude individuals
because they were not susceptible to illusions such as the McGurk effect (e.g. Nath & Beauchamp, 2012; Skipper, van Wassenhove, Nusbaum, & Small, 2007) and some have even found that brain activity in multisensory areas differs across susceptible and non-susceptible individuals (Szycik, Stadler, Tempelmann, & Münte, 2012).
One study which examined individual differences in the perception of synchrony was carried out by Boenke et al., (2009). The authors looked at whether individual differences had an effect on the degree to which stimulus duration shifted the PSS of AV stimuli, after finding that an Analysis of Variance revealed no overall effect of stimulus duration on the PSS, despite some individual data points showing large shifts. Correlational analyses were carried out on measures of the PSS and the degree to which individual estimates of these measures shifted as a result of stimulus intensity and duration. This study firstly demonstrated that the PSS is subject to wide inter-individual variability and can range from anywhere between around 120ms auditory-leading and 150ms auditory-lagging AV asynchronies. In addition, the authors measured the size of the effect of stimulus duration on the PSS in each participant and found that the shifts in PSS also varied from 75ms towards auditory-leading and 75ms towards auditory-lagging. More importantly correlational analyses revealed that the size and direction of this effect in a given
42
individual depended on size of their PSS and its direction. Individuals with a large auditory-leading PSS showed a large shift away from AV synchrony and towards even larger leading asynchrony whereas individuals with a large auditory-lagging PSS showed a large shift away from zero but in the opposite direction, towards larger auditory-lagging asynchrony. For individuals with a veridical PSS, the shift in PSS was minimal.
The study carried out by Boenke et al. (2009) demonstrates not only that there is wide variability in the PSS and in the degree to which it affected by stimulus
characteristics, but that the two are not orthogonal. Individual variability in the PSS is related to the degree to which factors such as stimulus duration modulate it. Thus, an individual differences approach using correlational analysis revealed an effect of stimulus duration on the PSS which otherwise would have not been revealed using an analysis of group averages because the effect itself was modulated by individual differences in subjective synchrony. To summarise, examining individual variability can reveal subtle characteristics of AV temporal processing which might otherwise be discarded and therefore concealed by group averaging analyses.
Another study which demonstrates the benefits of using an individual difference approach was carried out by van Eijk, Kohlrausch, Juola, & van De Par (2010). The authors examined the relationship between individual differences in the TOJ PSS and sensitivity in discriminating between synchronous and asynchronous AV information during SJs, to test the hypothesis that the PSS obtained in a TOJ task is shifted towards the AV asynchrony to which individuals are most sensitive when judging synchrony. The authors fitted cumulative Gaussians to each side of the synchrony judgement distribution for each participant and computed slopes for each curve, which represent temporal sensitivity. A ratio was then computed which represented whether participants were more sensitive to asynchrony when the auditory led the visual information or whether they were more sensitive when the auditory lagged. They found that the PSS was related to this ratio, meaning that participants with a higher sensitivity for audio-leading asynchrony also tended to
43
have audio-leading PSS values, whereas participants with higher sensitivity for audio-lagging asynchrony tended to have more audio-lagging values of the PSS. This relationship between sensitivity during SJs and the PSS derived from TOJs would not have been as easily revealed using group averages.
An individual differences approach might therefore reveal subtle differences or relationships between implicit and explicit temporal processes which have not yet been revealed by studies employing a group averaging approach. For example, Chapter 2 of this thesis examines whether individual differences in the PSS are consistent within individuals across implicit and explicit temporal judgements, or whether they are statistically independent from one another. Part of Chapter 3 carries out similar analyses on the ability to discriminate between synchronous and asynchronous AV information across implicit and explicit temporal judgements. Positive correlations between specific aspects of AV temporal processing performance across implicit and explicit judgements would indicate that these different types of judgements are supported by common underlying mechanisms. In contrast, if these measures are statistically independent, it could be an indication that these different types of judgements might be supported by distinct underlying mechanisms.
Why individuals might differ from one another in their ability to synchronise or to integrate AV information in the first place is unclear. Individual differences in brain function have been shown to reflect individual variability in perception and
behaviour, but it is unclear from functional correlates whether it is activity that leads to perception and/or behaviour, or vice versa. Nath and Beauchamp (2012) found that higher susceptibility to the McGurk illusion, measured outside of the scanner correlates with higher BOLD signals in the Superior Temporal Sulcus (STS) during exposure to incongruent McGurk stimuli. The STS is known to be one of the critical underlying structures for AV integration as disruption of this area using transcranial magnetic stimulation (TMS) significantly decreases the McGurk effect (Beauchamp, Nath, & Pasalar, 2010). The findings demonstrate that individual differences in AV integration are reflected by individual variability in the strength of
44
BOLD activation in multisensory cortex. However but the causal direction of the relationship between BOLD signal and perception is unclear without the use of additional methods such as TMS.
Hipp, Engel, & Siegel (2011) also demonstrated that individual differences in AV perception were reflected in individual variability in brain activity, but with the use of EEG rather than fMRI. The authors examined the role of long-range gamma-band oscillatory synchronisation within hat the la elled a entro-temporal network in AV integration, measured by the Stream-Bounce illusion (Sekuler et al., 1997). Individual susceptibility to the illusion was correlated to the degree to which gamma-band synchronisation increased across trials in which the auditory stimulus was integrated with the visual, relative to trials in which auditory information had no effect on visual perception. Less susceptible individuals tended to have larger differences in gamma-band synchronisation across the two percepts whereas more susceptible individuals tended to have comparable levels of gamma synchronisation across the percepts. This relationship was driven by synchronisation observed during trials in which AV information was integrated, meaning that in general, the less susceptible individuals were to the Stream-Bounce Illusion, the more oscillatory coherence they showed during illusory trials and the more susceptible individual were, the less synchronisation they showed. These results therefore suggest that gamma-band synchronisation within the centro-temporal network is unlikely to be the mechanism that gives rise to the Stream-Bounce illusion because highly
susceptible individuals were less likely to show high levels of it. The results suggest that it may however act as a compensatory mechanism acting to facilitate illusory perception in individuals who generally show low susceptibility. This result might not have been revealed if differences in the susceptibility to the Stream-Bounce illusion and in the strength of gamma-band synchronisation across individuals were discarded by only using analysis in which data are averaged, emphasising the need to also take individual differences into account when interpreting data.
The causal relationship between individual differences in perception and individual
45
study, it is not entirely straightforward that increased BOLD signal might lead to a given percept; it is just as likely that perceiving might lead to increased BOLD signal. Greater cortical synchronisation in Hipp et al.'s (2011) study might also be a
consequence, rather than a cause of AV integration. Furthermore, even if there was no doubt about the possibility that increased BOLD signals or neural
synchronisation were causal factors in perception or behaviour, why some
individuals might show greater activity or neural synchronisation would still remain unclear.
1.3
V
OXEL
-B
ASED
M
ORPHOMETRY
Brain structure is one factor that might account for individual variability in brain activity as well as behavioural variability in AV integration and temporal processing, but this possibility has not yet been addressed in AV research. Brain morphology is particularly interesting to examine as it provides a potentially causal explanation for individual differences in AV integration and temporal processing that is less
ambiguous than that which is provided by purely functional correlates. For example, increased grey matter density indicates that a given area is likely to contain more neurons and/or nerve fibres, which might be the resources necessary for less noisy and more efficient computations, as these transmit information through the central nervous system. If better performance correlates with increased grey matter volume, it might explain why some individuals are better than others at integration and synchronising AV information. Such an interpretation is consistent with population coding models which propose that stimuli are
represented by the distributions of responses of different neuronal populations, each tuned to different types of information (Averbeck, Latham, & Pouget, 2006). A distribution of responses to AV asynchrony for example might be less noisy if it were produced by a larger population of neurons, thus individuals with larger neuronal populations in areas responsible for AV timing might be better at synchronising AV information than individuals who possess smaller neuronal populations.