South Asian populations. The international journal of behavioral nutrition and physical activity, 13
(1). 56 - ?. DOI: https://doi.org/10.1186/s12966-016-0381-y
Link to Leeds Beckett Repository record:
http://eprints.leedsbeckett.ac.uk/2690/
Document Version:
Article
Creative Commons: Attribution 4.0
The aim of the Leeds Beckett Repository is to provide open access to our research, as required by
funder policies and permitted by publishers and copyright law.
The Leeds Beckett repository holds a wide range of publications, each of which has been
checked for copyright and the relevant embargo period has been applied by the Research Services
team.
We operate on a standard take-down policy.
If you are the author or publisher of an output
and you would like it removed from the repository, please
contact us
and we will investigate on a
case-by-case basis.
R E S E A R C H
Open Access
Validity and reliability of the
semi-quantitative self-report Home Food
Availability Inventory Checklist (HFAI-C) in
White and South Asian populations
Maria Bryant
1,2*, Madison LeCroy
3, Pinki Sahota
4, Jianwen Cai
5and June Stevens
3,6Abstract
Background:Despite interest in the importance of the home food environment and its potential influence on children’s diets and social norms, there remain few self-report checklist methods that have been validated against the gold standard of researcher-conducted inventories. This study aimed to assess the criterion validity and reliability of the‘Home Food Availability Inventory Checklist’(HFAI-C), a 39-item checklist including categories of fruit, vegetables, snacks and drinks.
Methods:The HFAI-C was completed by 97 participants of White and Pakistani origin in the UK. Validity was determined by comparing participant-reported HFAI-C responses to data from researcher observations of home food availability using PABAK and weighted kappa statistics. The validity of measuring the amount of items (in addition to presence/absence) available was also determined. Test-retest reliability compared repeated administrations of the HFAI-C using intra-class correlation coefficients.
Results:Validity and reliability was fair to moderate overall. For validity, the average category-level PABAK ranged from 0.31 (95 % CI: 0.25, 0.37) for vegetables to 0.44 (95 % CI: 0.40, 0.49) for fruits. Assessment of the presence/ absence of items demonstrated higher validity compared to quantity measurements. Reliability was increased when the HFAI-C was repeated close to the time of the first administration. For example, ICCs for reliability of the
measurement of fruits were 0.52 (95 %CI: 0.47, 0.56) if re-administered within 5 months, 0.58 (95 % CI: 0.51, 0.64) within 30 days and 0.97 (95 %CI: 0.94, 1.00) if re-administered on the same day.
Conclusions:Overall, the HFAI-C demonstrated fair to moderate validity and reliability in a population of White and South Asian participants. This evaluation is consistent with previous work on other checklists in less diverse, more affluent populations. Our research supports the use of the HFAI-C as a useful, albeit imperfect, representation of researcher-conducted inventories. The feasibility of collecting information using the HFAI-C in large, multi-ethnic samples can facilitate examination of home food availability in relation to exposures such as ethnicity and outcomes including behavioural, social and health outcomes. Future work using the HFAI-C could provide important insights into a modifiable influence with potential to impact health.
Keywords:Home, Food, Availability, Measure, Validation, Reliability, South Asian, Inventory
* Correspondence:[email protected] 1
Clinical Trials Research Unit, Leeds Institute of Clinical Trials Research, University of Leeds, Leeds LS2 9JT, UK
2Bradford Institute of Health Research, Bradford Royal Infirmary, Bradford BD9 6RJ, UK
Full list of author information is available at the end of the article
Background
Measuring the home food environment and understand-ing the potential differences in the availability of foods and drinks in homes of different cultures and populations per-mits a greater knowledge of the causes of energy over-consumption and may support the development of effect-ive obesity prevention and treatment interventions. The majority of work in the area of home food availability has used self-report checklists in which parents/caregivers are asked to report whether foods are present or absent. Des-pite the increased interest in the importance of the home food environment in recent years [1–5], few researchers have validated self-report checklist methods against the gold standard of researcher-conducted exhaustive home food availability inventories and none within South Asian populations [3, 6–10]. Exhaustive researcher-conducted inventories of all foods in the home provide data that de-scribe the total amounts of foods and nutrients available. However, this approach is rarely used due to the burden of collecting and analysing exhaustive data from within family homes [5].
As food selection is highly linked to culture and ethni-city, it is likely that the foods in the home differ in eth-nically and socially distinct households. It is also possible that reporting of foods in the home differs by culture and ethnicity. As such, consideration is also re-quired of the population characteristics when conduct-ing a validation of home food availability checklists. Work investigating home food availability in minority populations has thus far included validity examination in African American, Somali and Hispanic populations [11, 12]. There remains a lack of evaluation of the validity and reliability of home food availability checklists in other populations, including those of South Asian origin. The current study aimed to assess the validity and reli-ability of a brief 39-item home food availreli-ability checklist; the ‘Home Food Availability Inventory Checklist (HFAI-C)’in a sample of White British and South Asian popu-lations in the UK. As the precision to which a checklist can assess the amount of foods in the home (in contrast to assessment of their presence only) is not known, we also aimed to determine the degree to which a self-report checklist can accurately estimate the quantity of foods available in homes by comparing validity and reli-ability from dichotomous outcome data (i.e. food/drink items present or absent) to data from varying levels of quantity (i.e. creating quartiles and tertiles of the quan-tity of foods available).
Methods
Sample
Participants completing the checklist were recruited from ‘Born in Bradford 1000’ (BiB1000) [13]; a nested cohort study within the ‘Born in Bradford’ (BiB) study
[14]. In brief, BiB is a longitudinal multi-ethnic birth co-hort of 12,453 women who were recruited during preg-nancy if they were registered to give birth in the Bradford Royal Infirmary (resulting in 13,776 babies). Participants were almost exclusively of White or South Asian ethnicity. This cohort aims to examine environ-mental, psychological and genetic factors that impact health and development perinatally and during child-hood [14]. The BiB1000 nested population was not a random sample. Instead, all mothers recruited to the full BiB study between August 2008 and March 2009 who had completed the baseline questionnaire were approached to take part in BiB1000 during their routine 26–28 week glucose tolerance test (GTT) [13]. This nested cohort of 1736 mothers aimed to understand the predictors and influences of pregnancy and early life health-related be-haviours specifically to inform the development of a cul-turally specific childhood obesity prevention intervention. BiB1000 characteristics are similar to that of the full BiB cohort [14]; with a similar distribution of age, ethnicity, and marital status (See Table 1). All BiB1000 participants were asked to complete the HFAI-C and a sub-sample of 100 mothers were opportunistically recruited to have researcher-conducted home food availability inventories conducted around the time of their 18 month BiB1000 as-sessment (i.e. all participants completing their 18 month assessment were invited to take part, with the first 100 consenting included in the study). Inventories were then scheduled to occur as soon as possible following the 18 month assessment.
There were no language restrictions for study eligibil-ity and multi-lingual staff were trained to collect data in homes in which the parents were unable to speak Eng-lish. All questionnaires were transliterated into Urdu and Mirpuri language, as the majority of Pakistani popu-lations residing in Bradford are of Mirpuri origin and one of the official languages of Pakistan is Urdu.
This study was conducted according to the guidelines of the Declaration of Helsinki and all procedures involv-ing human subjects/patients were approved by the Brad-ford Research Ethics Committee (07/H1302/112). Written or verbal (for mothers unable to read and/or speak English) informed consent was obtained from all participants. Verbal consent was witnessed and formally recorded.
Measures
Home food availability inventory checklist
range of available sizes for each item. The checklist was intended for use in large cohort studies and therefore was designed so that it did not incur a high level of burden on participants. Foods and drinks were restricted to a list of 39-items that were available within the categories of 1. Fruits (16-items including fresh, dried and canned); 2. Veg-etables (12-items including fresh and canned; 3. Snacks (7-items including savoury (e.g. salted nuts) and sweet (e.g. cake)); and 4. Drinks (4-items including regular and diet fizzy drinks, sports drinks and fruit drinks). These were chosen for study because; 1. they are often the target of obesity interventions [16], 2. there is some evidence that
their intake is related to obesity in children [17–19] and/or, 3. early literature indicates a relationship between availabil-ity in the home and either diet [20, 21] or obesavailabil-ity [22].
[image:4.595.57.539.97.562.2]The HFAI-C instructs participants to report the max-imum availability of each food and drink item in their homes over the previous 7 days. Rather than using a di-chotomous response option of ‘present’ or ‘absent’, four categories of response options were generated to enable an estimation of the quantity of foods within the home (absent, small amount, medium amount, large amount). These response options were not intended to precisely quantify the exact amount of foods, but to rank availability.
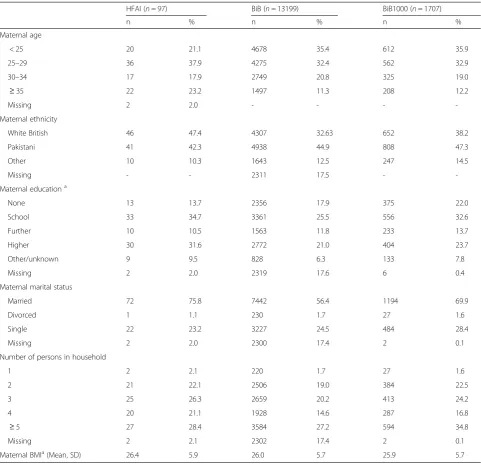
Table 1Demographic characteristics for analytic sample (n= 97)
HFAI (n= 97) BiB (n= 13199) BiB1000 (n= 1707)
n % n % n %
Maternal age
< 25 20 21.1 4678 35.4 612 35.9
25–29 36 37.9 4275 32.4 562 32.9
30–34 17 17.9 2749 20.8 325 19.0
≥35 22 23.2 1497 11.3 208 12.2
Missing 2 2.0 - - -
-Maternal ethnicity
White British 46 47.4 4307 32.63 652 38.2
Pakistani 41 42.3 4938 44.9 808 47.3
Other 10 10.3 1643 12.5 247 14.5
Missing - - 2311 17.5 -
-Maternal educationa
None 13 13.7 2356 17.9 375 22.0
School 33 34.7 3361 25.5 556 32.6
Further 10 10.5 1563 11.8 233 13.7
Higher 30 31.6 2772 21.0 404 23.7
Other/unknown 9 9.5 828 6.3 133 7.8
Missing 2 2.0 2319 17.6 6 0.4
Maternal marital status
Married 72 75.8 7442 56.4 1194 69.9
Divorced 1 1.1 230 1.7 27 1.6
Single 22 23.2 3227 24.5 484 28.4
Missing 2 2.0 2300 17.4 2 0.1
Number of persons in household
1 2 2.1 220 1.7 27 1.6
2 21 22.1 2506 19.0 384 22.5
3 25 26.3 2659 20.2 413 24.2
4 20 21.1 1928 14.6 287 16.8
≥5 27 28.4 3584 27.2 594 34.8
Missing 2 2.1 2302 17.4 2 0.1
Maternal BMIa(Mean, SD) 26.4 5.9 26.0 5.7 25.9 5.7
a
A range of the quantities within each response option was provided based on the distribution of sizes of foods/pack-ages that were previously available from our Universal Product Code (UPC) scanning study [15] and on the usual packaging for purchase.
The HFAI-C was administered as part of a larger ques-tionnaire, which was completed by all BiB1000 partici-pants during cohort assessments when infants were 18 and 36 months of age. For the purposes of the test re-test reliability analyses, checklist data from the 18-month assessment have been used (planned as close to the the time of the researcher-conducted inventorie as possible, but with any permitted). A full questionnaire pack was completed for each infant, so that mothers with multiple births were asked to complete the ques-tionnaire pack multiple times (e.g. two times for twins). Data from three parents were incomplete and as such, the validation analysis sample consisted of 97 parents. Two of these 97 parents included twins but only one child was randomly allocated for comparisons between researcher completed and parent self-report checklists. Three samples were used for the reliability testing in-cluding: (1) Full sample, independent of timing between repeated administrations, excluding twins (n= 95); (2) Reduced sample with repeated measures conducted within 30 days, excluding twins (n= 30); and (3) Twin data taken from an additional BiB1000 sample in which parents were asked to complete separate questionnaires for both infants on the same visit (n= 15). This latter sample was included to explore reliability estimates that were independent of shopping and consumption behav-iours. Since the HFAI-C was administered as part of a larger questionnaire pack, the timing between repeated administrations of the HFAI-C for parents with twins was approximately 1 h. This reduces the likelihood of parents simply copying responses from one administra-tion to the other. Further, quesadministra-tionnaires were re-searcher administered and data were entered directly on to an electronic table by the researcher.
Researcher-conducted food availability inventories
Inventories were conducted when infants were approxi-mately 18 months old using a standardised protocol based on well-established methodologies from previous research [10, 15, 23] in which researchers measured all foods fromall food storage areas in participants’ homes within the higher categories of fruits (with sub-categories: fresh, tinned, dried and frozen), vegetables (with sub-categories fresh, tinned and frozen), snacks (with sub-categories: crisps/tortillas, biscuits, salted nuts, chocolate, sweets, cakes and ice-cream) and drinks (with sub-categories sugar-sweetened and sugar-free). Within each sub-category, open‘exhaustive’ data were collected rather than using a pre-defined checklist of items. This
method requires researchers to remove all items from one storage location at a time and only replace them after they have been recorded; ensuring that all relevant items are included. Exhaustive data from 836 food and drink items that were identified were grouped into 215 individual food and drink types. For example, a ‘packet of chocolate digestive biscuits’ was grouped as ‘biscuits with chocolate topping’ within the sub-category of
‘Biscuits/Sweet snacks’ (under the higher category of snacks). Similarly, all crisps that were made with corn were assigned to the group of ‘tortillas’ within ‘Crisps/ Savoury snacks’and ‘red grapes’and ‘green grapes’were grouped as ‘grapes’ within the sub-category of fresh fruits (under the higher category of fruits). For the pur-pose of these analyses, 1 handful of fresh produce repre-sented 1 serving/cup. Other fresh produce that were recorded as whole units (e.g. melons) were converted to the number of adult size servings by a nutritionist (MB) using standards provided by Self Nutrition Data (http:// nutritiondata.self.com/facts) and USDA National Nutri-ent Database for Standard Reference Release 27 (http:// ndb.nal.usda.gov/ndb/foods). A repeated administration of the HFAI-C was also completed by participants in the nested sample of 100 homes on the same day as the researcher-conducted inventories.
Other measures
Demographic data were obtained from the full BiB co-hort during recruitment by self-report (26–28 weeks of pregnancy) [13, 14]. Measures relevant to these analyses include: household structure, marital status, educational status (as a proxy for socio-economic status), and ethnicity.
Analysis
To adjust for differences in response prevalence and for bias between the researcher and participant, prevalence-and bias- adjusted kappa (PABAK) [24] was calculated in addition to Cohen’s kappa [25] for the dichotomized re-sponses. Cicchetti-Allison linear-weighted kappa [26] was used to examine concordance between the reported and observed responses with the data divided into tertiles and quartiles Weights (w) were thus assigned according to the participant category (i) and the researcher category (j), such that: wij= 1 – [|Ci – Cj|/(CC – C1)], where Ci is
the score fori,Cjis the score forj,Cc is the score for
cat-egory C (the number of categories), andC1is the score for
the first category. For these analyses, the number of cat-egories equalled either four (quartiles) or three (tertiles). Scores were assigned to each closed-ended category using the median of the range in each respective category. The response category indicating the largest amount was open-ended. For this category, we assigned a score that was 1.5 times the total range of the other responses. As opposed to PABAK, the weighted kappa approach allows for differential weighting according to the level of dis-agreement between reported and observed responses.
Single-measures intra-class correlation coefficients (ICC) [27] were used to examine test-retest reliability across parent completion of the HFAI-C within 5 months, 30 days and repeated on the same day. Two-way random effects models with measures of absolute agreement [28] were used to assess the dichotomized re-sponses using the INTRACC macro created by Hamer for SAS [29]. For a more detailed account of psychomet-ric methods, see Nunnally [30].
Category-level kappa statistics and ICCs were assessed by collapsing all checklist and researcher responses for all items in a given food/drink category into two vari-ables: an HFAI-C response and a researcher response. Corresponding confidence intervals were obtained using bootstrap resampling method by sampling with replace-ment from the sub-cohort of 100 mothers 1000 times and then calculating the appropriate statistics on each resulting dataset. The 2.5 and 97.5 percentiles of the dis-tributions of kappa statistics were reported as the bounds of the confidence intervals.
For Cohen’s kappa and weighted kappa interpretation purposes, we used the guidelines proposed by Landis and Koch: < 0.00 = poor, 0.00–0.20 = slight, 0.21–0.40 = fair, 0.41 – 0.60 = moderate, 0.61 – 0.80 = substantial, and 0.81 – 1.0 = almost perfect [31]. PABAK statistics have been similarly interpreted in the context of existing literature (akin to kappa statistics), although it is recog-nised that descriptive terms like‘moderate’and‘fair’are not always universally accepted. Because Cohen’s kappa is mathematically equivalent to the weighted kappa in the case of only two categories, Cohen’s kappa as op-posed to PABAK was used for comparison purposes.
ICCs were interpreted according to guidelines proposed by Shrout: <0.10 = virtually none, 0.11–0.40 = slight, 0.41
–0.60 = fair, 0.61–0.80 = moderate, and 0.81–1.0 = sub-stantial [32]. All above analyses were repeated for the White British and Pakistini origin subgroups to explore potential differences by ethnicity. All statistical analyses were performed using SAS version 9.4 (SAS Institute, Inc., Cary, North Carolina).
Results
Sample characteristics
Table 1 presents demographic data collected at baseline from the 97 participants, who had complete HFAI-C data. The analytic sample was predominately of White British (47 %) or Pakistani origin (42 %). A high propor-tion of mothers were between the ages of 25 and 29 years (38 %) and were married (76 %). The level of educational attainment was diverse, with 14 % having not completed any education and 32 % having completed some univer-sity education. At least 2 persons (of all ages) lived in nearly all households (98 %). These characteristics are similar to those of the full BiB cohort (e.g. which has 45 % participants of Pakistani origin) [14].
Criterion validity
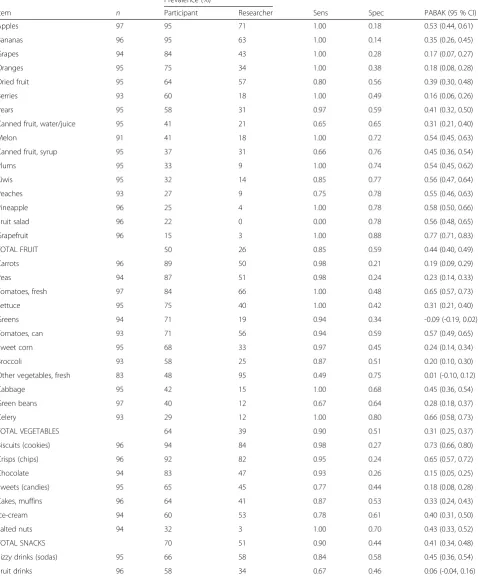
The criterion validation results are shown for individual food/drink items and by the four food/drink categories (fruits, vegetables, snacks, and drinks) for the dichoto-mized responses (presence/absence) (Table 2). Items within each category were ordered in descending order according to participant-reported prevalence. Among fruits and vegetables, participants most commonly re-ported apples, bananas, and carrots as being present over the previous week. For snacks and drinks, partici-pants most commonly reported that biscuits and fizzy drinks had been available respectively. Across all food/ drink items, sensitivity (range: 0.49–1.00) tended to be higher than specificity (range: 0.14–0.88).
PABAK statistics were relatively similar across the four food/drink categories and indicated fair to moderate per-formance of the HFAI-C at the category level, with PABAKs ranging from 0.31 (95 % CI: 0.25, 0.37) for veg-etables to 0.44 (95 % CI: 0.40, 0.49) for fruits. PABAK values were lowest for greens (PABAK -0.09, 95 % CI: -0.19, 0.02) and highest for grapefruit (PABAK 0.77, 95 % CI: 0.71, 0.83).
Table 2Criterion validity comparing researcher administered and participant reported data for analytic sample using dichotomized responses (presence/absence) (n= 97)
Prevalence (%)
Item n Participant Researcher Sens Spec PABAK (95 % CI)
Apples 97 95 71 1.00 0.18 0.53 (0.44, 0.61)
Bananas 96 95 63 1.00 0.14 0.35 (0.26, 0.45)
Grapes 94 84 43 1.00 0.28 0.17 (0.07, 0.27)
Oranges 95 75 34 1.00 0.38 0.18 (0.08, 0.28)
Dried fruit 95 64 57 0.80 0.56 0.39 (0.30, 0.48)
Berries 93 60 18 1.00 0.49 0.16 (0.06, 0.26)
Pears 95 58 31 0.97 0.59 0.41 (0.32, 0.50)
Canned fruit, water/juice 95 41 21 0.65 0.65 0.31 (0.21, 0.40)
Melon 91 41 18 1.00 0.72 0.54 (0.45, 0.63)
Canned fruit, syrup 95 37 31 0.66 0.76 0.45 (0.36, 0.54)
Plums 95 33 9 1.00 0.74 0.54 (0.45, 0.62)
Kiwis 95 32 14 0.85 0.77 0.56 (0.47, 0.64)
Peaches 93 27 9 0.75 0.78 0.55 (0.46, 0.63)
Pineapple 96 25 4 1.00 0.78 0.58 (0.50, 0.66)
Fruit salad 96 22 0 0.00 0.78 0.56 (0.48, 0.65)
Grapefruit 96 15 3 1.00 0.88 0.77 (0.71, 0.83)
TOTAL FRUIT 50 26 0.85 0.59 0.44 (0.40, 0.49)
Carrots 96 89 50 0.98 0.21 0.19 (0.09, 0.29)
Peas 94 87 51 0.98 0.24 0.23 (0.14, 0.33)
Tomatoes, fresh 97 84 66 1.00 0.48 0.65 (0.57, 0.73)
Lettuce 95 75 40 1.00 0.42 0.31 (0.21, 0.40)
Greens 94 71 19 0.94 0.34 -0.09 (-0.19, 0.02)
Tomatoes, can 93 71 56 0.94 0.59 0.57 (0.49, 0.65)
Sweet corn 95 68 33 0.97 0.45 0.24 (0.14, 0.34)
Broccoli 93 58 25 0.87 0.51 0.20 (0.10, 0.30)
Other vegetables, fresh 83 48 95 0.49 0.75 0.01 (-0.10, 0.12)
Cabbage 95 42 15 1.00 0.68 0.45 (0.36, 0.54)
Green beans 97 40 12 0.67 0.64 0.28 (0.18, 0.37)
Celery 93 29 12 1.00 0.80 0.66 (0.58, 0.73)
TOTAL VEGETABLES 64 39 0.90 0.51 0.31 (0.25, 0.37)
Biscuits (cookies) 96 94 84 0.98 0.27 0.73 (0.66, 0.80)
Crisps (chips) 96 92 82 0.95 0.24 0.65 (0.57, 0.72)
Chocolate 94 83 47 0.93 0.26 0.15 (0.05, 0.25)
Sweets (candies) 95 65 45 0.77 0.44 0.18 (0.08, 0.28)
Cakes, muffins 96 64 41 0.87 0.53 0.33 (0.24, 0.43)
Ice-cream 94 60 53 0.78 0.61 0.40 (0.31, 0.50)
Salted nuts 94 32 3 1.00 0.70 0.43 (0.33, 0.52)
TOTAL SNACKS 70 51 0.90 0.44 0.41 (0.34, 0.48)
Fizzy drinks (sodas) 95 66 58 0.84 0.58 0.45 (0.36, 0.54)
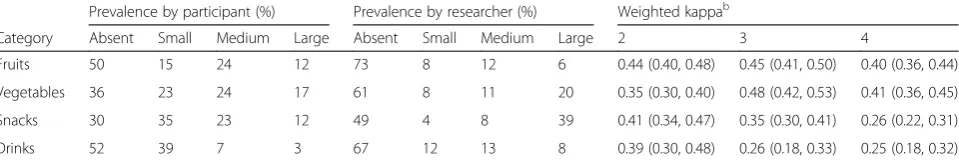
when items were recorded in four quantities of availabil-ity (except for vegetables). Additionally, the use of three quantities of availability for the fruit and vegetable cat-egories was more valid than the use of dichotomized re-sponses. The validity of the HFAI-C was fair to moderate across the two, three, and four quantities of availability. However, the validity of the drink category was only fair when the three and four quantities of avail-ability were used, and the validity of the snack category was only fair when the four quantities of availability were used.
The potential impact of ethnicity was examined by comparing validity data between homes of White British and Pakistani origin. Results were similar between groups with a few exceptions: Agreement was higher for fruits in the White British (PABAK 0.58, 95 % CI 0.53, 0.64) compared to the Pakistani (PABAK 0.32, 95 % CI 0.24, 0.39). Conversely, homes with participants of Paki-stani origin had higher validity in the reporting of the quantity of vegetables (PABAK 0.34, 95 % CI: 0.28, 0.42) compared to home with White British participants (PABAK 0.31, 95 % CI: 0.22, 0.39) (See Additional file 1).
Test-retest reliability
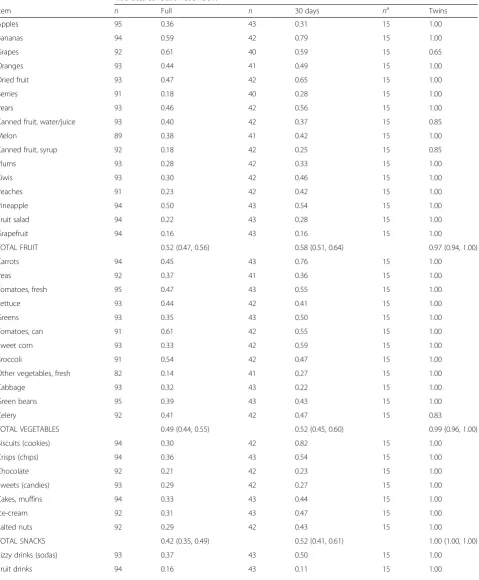
Results from the reliability analyses are presented in Table 4. ICCs are presented only for the dichotomized responses. When all participants with HFAI-C data available at both time points (with repeated completion within 5 months) were included in the analysis, ICCs at the category level indicate that agreement between the two time points was slight to fair, with ICCs ranging from 0.38 (95 % CI 0.29, 0.48) for drinks to 0.52 (95 % CI 0.47, 0.56) for fruits. For individual items, ICCs ranged from 0.14 (for ‘other fresh vegetables’) to 0.61 (for grapes and canned tomatoes). Restricting the sample
to those who completed both assessments within a 30-day time period improved the reliability such that agree-ment at the category level was fair to moderate, with ICCs ranging from 0.48 (95 % CI 0.34, 0.60) for drinks to 0.58 (95 % CI 0.51, 0.64) for fruits. The ICCs for all sets of twins in BiB1000 (where both questionnaires were completed on the same day) had the smallest range of ICCs at the item level, with only four items, (tinned fruits (water/juice and syrup), grapes, and celery result-ing) in ICCs less than 1.00. Agreement was substantial for all categories among the sample of twins.
Discussion
On the whole, the validity and reliability of the 39-item HFAI-C was moderate, with high levels of sensitivity and reliability and fair to moderate agreement between par-ticipant- and researcher- collected data. The instrument was more accurate in the assessment of the presence of foods in the home compared to determining the amount available, although this had little impact on the overall validity results here. Our evaluation also indicated that the HFAI-C may be appropriate for use in households of both Whites and South Asians living in Britain.
[image:8.595.57.538.113.155.2]The level of agreement we found in item-level valid-ation is consistent with previous literature in which re-searcher conducted exhaustive inventories were used as a gold standard comparator [6–9, 33]; however, compari-son of mean category level validation values with other studies is difficult, as others have not conducted a boot-strapping method to enable category level means with confidence intervals. Furthermore, not all previous stud-ies have adjusted analyses and determined PABAK statis-tics. Boles and colleagues validated a 126-item checklist of foods and drinks in 25 homes and reported kappa values ranging from 0.03 to 1.00 for fruits and vegetables
Table 2Criterion validity comparing researcher administered and participant reported data for analytic sample using dichotomized
responses (presence/absence) (n= 97)(Continued)
Diet fizzy drinks 94 45 27 0.80 0.68 0.43 (0.33, 0.52)
Sports drinks 94 24 14 0.77 0.84 0.66 (0.58, 0.74)
[image:8.595.59.539.633.714.2]TOTAL DRINKS 48 33 0.77 0.64 0.40 (0.30, 0.49)
Table 3Criterion validity comparing researcher administered and participant reported data for analytic sample using 2, 3, and 4 response categorizationsa(n= 97)
Prevalence by participant (%) Prevalence by researcher (%) Weighted kappab
Category Absent Small Medium Large Absent Small Medium Large 2 3 4
Fruits 50 15 24 12 73 8 12 6 0.44 (0.40, 0.48) 0.45 (0.41, 0.50) 0.40 (0.36, 0.44)
Vegetables 36 23 24 17 61 8 11 20 0.35 (0.30, 0.40) 0.48 (0.42, 0.53) 0.41 (0.36, 0.45)
Snacks 30 35 23 12 49 4 8 39 0.41 (0.34, 0.47) 0.35 (0.30, 0.41) 0.26 (0.22, 0.31)
Drinks 52 39 7 3 67 12 13 8 0.39 (0.30, 0.48) 0.26 (0.18, 0.33) 0.25 (0.18, 0.32)
a
Categories are 2 (absent, present), 3 (absent, small, medium/large), and 4 (absent, small, medium, large)
b
Table 4Test re-test reliability for full (n= 95), 30-day restricted (n= 43), and twin (n= 15) samples using dichotomized responses (presence/absence)
Intra-class correlation coefficient
Item n Full n 30 days na Twins
Apples 95 0.36 43 0.31 15 1.00
Bananas 94 0.59 42 0.79 15 1.00
Grapes 92 0.61 40 0.59 15 0.65
Oranges 93 0.44 41 0.49 15 1.00
Dried fruit 93 0.47 42 0.65 15 1.00
Berries 91 0.18 40 0.28 15 1.00
Pears 93 0.46 42 0.56 15 1.00
Canned fruit, water/juice 93 0.40 42 0.37 15 0.85
Melon 89 0.38 41 0.42 15 1.00
Canned fruit, syrup 92 0.18 42 0.25 15 0.85
Plums 93 0.28 42 0.33 15 1.00
Kiwis 93 0.30 42 0.46 15 1.00
Peaches 91 0.23 42 0.42 15 1.00
Pineapple 94 0.50 43 0.54 15 1.00
Fruit salad 94 0.22 43 0.28 15 1.00
Grapefruit 94 0.16 43 0.16 15 1.00
TOTAL FRUIT 0.52 (0.47, 0.56) 0.58 (0.51, 0.64) 0.97 (0.94, 1.00)
Carrots 94 0.45 43 0.76 15 1.00
Peas 92 0.37 41 0.36 15 1.00
Tomatoes, fresh 95 0.47 43 0.55 15 1.00
Lettuce 93 0.44 42 0.41 15 1.00
Greens 93 0.35 43 0.50 15 1.00
Tomatoes, can 91 0.61 42 0.55 15 1.00
Sweet corn 93 0.33 42 0.59 15 1.00
Broccoli 91 0.54 42 0.47 15 1.00
Other vegetables, fresh 82 0.14 41 0.27 15 1.00
Cabbage 93 0.32 43 0.22 15 1.00
Green beans 95 0.39 43 0.43 15 1.00
Celery 92 0.41 42 0.47 15 0.83
TOTAL VEGETABLES 0.49 (0.44, 0.55) 0.52 (0.45, 0.60) 0.99 (0.96, 1.00)
Biscuits (cookies) 94 0.30 42 0.82 15 1.00
Crisps (chips) 94 0.36 43 0.54 15 1.00
Chocolate 92 0.21 42 0.23 15 1.00
Sweets (candies) 93 0.29 42 0.27 15 1.00
Cakes, muffins 94 0.33 43 0.44 15 1.00
Ice-cream 92 0.31 43 0.47 15 1.00
Salted nuts 92 0.29 42 0.43 15 1.00
TOTAL SNACKS 0.42 (0.35, 0.49) 0.52 (0.41, 0.61) 1.00 (1.00, 1.00)
Fizzy drinks (sodas) 93 0.37 43 0.50 15 1.00
[33]. Mean category level kappas were not provided. Similarly, a validation study by Marsh et al. [9] presented item level Cohen’s kappa statistics for 31-items within the categories of fruit juices, fruits and vegetables. Ranges within categories were similar to PABAK results of the current study; with kappa values for fruit juices ranging from 0.24–0.53; kappa values for fruits at 0.12– 0.76 (compared to our PABAK values ranging from 0.17–0.77); and kappa values for vegetables between 0.19–0.66 (compared to our PABAK values ranging from 0.01–0.66). These ranges fit into similar boundaries of acceptability (e.g. the majority of fruit items from both studies were described as having at least moderate valid-ity (0.41–0.60). However, caution should be applied when comparing adjusted PABAK findings with kappa statistics as adjusted analyses using PABAK resulted in higher levels of agreement in all studies, including the present study.
In a further validation study of the Healthy Home Sur-vey by Bryant et al. [10] mean PABAK values for cat-egories were provided, although confidence intervals were not. This study differed in the type of data col-lected as, participants reported all items within 6 food and drink categories (i.e. using an exhaustive‘within cat-egory’ approach rather than a checklist). Mean PABAK values were higher than the current study (0.85 and 0.85 for fresh fruits and vegetables respectively) although these were simple means and did not include category level variables. Confidence intervals were generated for the current study to provide a description of the distri-bution of PABAK data. These results indicated a sub-stantial variation between item validation results and mean confidence interval values ranged from -0.02 to 0.87. This suggests that the ability of the checklist to ac-curately reflect what was found in homes by researchers varied between households. Other validation studies in-cluding those by Crockett et al. [6], Miller and Edwards [7] and Fulkerson et al. [8] report similar sensitivity and specificity results to those of the HFAI; however Kappa values were higher. This might be explained by the dif-ferences in study design as, instead of comparing check-list data to exhaustive researcher conducted inventories, these other studies validated their participant completed checklists by comparing data to repeated administration of the checklists by researchers.
Test-re-test data suggest that the HFAI-C demon-strated fair reliability, particularly if the two repeated ad-ministrations were within 30 days of each other. Given the high probability that there were actual changes to foods in the home over this period, the relatively lower reliability with up to 5 months between measurements may actually indicate the transient nature of the environ-ment and acts as a measure of stability rather than consistency. Conversely, when administrations occurred in the same day (i.e. by parents with twins), the higher reliability estimates suggested that the tool has substan-tial consistency.
[image:10.595.51.541.113.156.2]It is a limitation that our validity data may have been impacted by differences in the time referent of the HFAI-C compared to the researcher-conducted inven-tory. Whereas the HFAI-C required participants to re-port the maximum amount of each item over the past 7 days, researchers conducted inventories on a single day. Given this difference, it is not surprising that, for the most part, prevalence as reported by participants was higher than that reported by researchers. This issue has been reported previously by Marsh et al., whose checklist required participants to report over the previ-ous 7 days, whereas researcher conducted inventories were on a single day [9]. These authors theorised that the variability in observed agreement statistics may therefore be related to the perishable nature of some foods. However, kappa and PABAK statistics in the current study were similar between perishable and non-perishable items. Evidence from a small study with 9 households, each measured five times, indicates high intra-monthly changes in availability due to purchasing and consumptions behaviours [34]. However, in larger studies home food availability has been shown to be relatively stable, as the within household variation of home food availability is relatively low compared to be-tween household variability [35]. Intuitively, this is lo-gical, as households tend to purchase similar items over time. In fact, research in this area suggests that, only one observation per household may be required to ob-tain a correlation between r= 0.7–0.9 with the true within household mean when assessing the number of items available [35]. Nevertheless, it is likely that the ab-solute maximum amount of foods reported amount over 7 days will differ from that in a single day within a
Table 4Test re-test reliability for full (n= 95), 30-day restricted (n= 43), and twin (n= 15) samples using dichotomized responses
(presence/absence)(Continued)
Diet fizzy drinks 92 0.51 41 0.71 15 1.00
Sports drinks 93 0.36 42 0.56 15 1.00
TOTAL DRINKS 0.38 (0.29, 0.48) 0.48 (0.34, 0.60) 1.00 (1.00, 1.00)
a
household, especially with fresh produce. This may be particularly important in low-income households who are less likely to have car access enabling them to shop at larger retailers [36].
It is a strength of the current study that we assessed the quantity of foods and drinks that were available. We found that quantitative results were generally less valid than the identification of the presence or absence of items. However, these differences had little impact on the overall validity results. Measurement of the pres-ence/absence of food items in the home is the most common approach used in other checklists of home food availability, perhaps because of feasibility. Data from this study may indicate that such an approach is most appropriate for the assessment of home food avail-ability when using a self-report checklist. It has been ar-gued that the quantity of foods available provides a richer picture of the environment and would better dis-criminate between households providing a‘healthy’ com-pared to a ‘non-healthy’ environment [10]. Further research is required in this area as few checklists assess any level of quantity other than presence or absence.
It is a strength that this study included participants with South Asian cultural identities. Given the large role of culture in food selection types of foods and drinks available in the home are likely to be impacted and dif-ferences were anticipated between White and South Asians in our sample. In the checklist development stage, data from 24-h dietary recalls taken from South Asian populations in Bradford were examined to identify foods or drinks that were consumed regularly that were missing from the checklist. Instead of identifying com-pletely new items, this process identified prompts and examples that needed to be added. For example, under
‘other vegetables’,‘okra’was included as one of the ples. Providing a range of ethnically appropriate exam-ples or prompts for measures is therefore one way that a tool may be developed or modified for use in mixed population groups. Other approaches to make tools more culturally have been suggested by others including working with the target populations to modify existing tools (i.e. delete items, add items, or altering categories) or by applying modifications (i.e. additions) to produce a tool appropriate for use in a mixed population [12, 37, 38]. The latter approach ensures appropriate items are included, but increases the length of checklists, which may be less feasible to administer. Administration of the HFAI-C in other populations should involve working with members of the intended population to modify the prompt and examples provided without increasing the number of items.
It is possible that the validity of such measures may be impacted by cultural or social identity (for example, par-ticipants of one ethnicity may be more accurate at
reporting availability than others using the checklist). Our investigation of this identified similarities in validity and reliability by ethnicity, except that agreement be-tween participant and researcher reported fruit availabil-ity was greater for White British participants compared to those of Pakistani origin, but that participants of Paki-stani origin had better validity for reporting the quantity of vegetables in their homes. This study was not statisti-cally powered to identify differences by ethnicity, but analyses were conducted as a means to explore potential disparities in the validity and reliability. Homes with par-ticipants of Pakistani origin from this cohort have a greater amount of fruits available compared to those of White British origin [23], which may be one possible ex-planation for differences in the ability to accurately measure them; as the measurement of fresh produce is more likely to be impacted by shopping and consump-tion behaviours [36] Further research may be warranted to explore potential cultural or ethnic difference in reporting accuracy, in addition to understanding the im-pact of statistical adjustment of other potential covari-ates [35].
gathered from gardens and its analysis and interpret-ation can be labour intensive). Methods that do not rely on self-reported data, including researcher conducted in-ventories, are most likely to provide the most valid as-sessment; however these are often less feasible especially in larger studies.
This study adds to the literature on the measurement of home food availability by providing an evaluation of a brief checklist in relatively large a bi-ethnic sample, that can be used to rank the availability of foods and drinks (including an estimation of quantity) that are hypothe-sised to relate to childhood obesity. An important strength of the current study is its inclusion of a diverse ethnic population with high levels of deprivation. The HFAI-C has also been administered to a wider sample of 1700 families within the BiB1000 cohort, which benefits from the inclusion of a large amount of other assess-ments [42]. This will allow further examination of home food availability in relation to exposures such as ethni-city and outcomes including behavioural, social and health outcomes; thus providing further insight into how the home food environment may relate to obesity and health related behaviours. One limitation of the validity of the tool might relate to confusion in the interpret-ation on some of the items. Items with the lowest valid-ation results were ‘greens’and‘other fresh vegetables’. It is likely that lower values for these items related to un-certainties in their definitions as we have since learnt that this differs between individuals. Cognitive testing of the HFAI-C was not conducted due to its checklist na-ture, although issues related to interpretation may have been alleviated if cognitive testing was conducted. Fur-ther implementation of the HFAI-C should Fur-therefore provide a clearer definition of these items. Like other checklists, the HFAI-C is limited by the foods that are include in the list and therefore cannot assess the overall availability of foods in the home. Lastly, although the variance in the timing between administrations for the reliability study permitted a greater understanding of the impact of time on measurement, estimates may have been improved if data were gathered from a larger sam-ple of participants in which data were collected within 30 days or even 7 weeks of one another.
Conclusion
The HFAI-C is a simple checklist that can be used to as-sess the availability of foods in the home, in addition to estimating the amounts available. Similar to other home food availability checklists, the HFAI-C demonstrated fair to moderate validity and reliability, with high vari-ability between items. More research is recommended in this area to confirm this hypothesis or to improve on the validity of the measurement of quantity. Future work should also focus on the ability of the checklist to
discriminate between participant characteristics such as obesity and to evaluate the impact of home food avail-ability on behaviours such as dietary intake.
Additional file
Additional file 1: Table S1.White British (WB,n= 47) and Pakistani (P,n= 40) criterion validity for analytic sample using 2, 3, and 4 response categorizations* (n= 97). Table S2. White British (WB) and Pakistani (P) reliability for full (n= 95), 30-day restricted (n= 43), and twin (n= 15) samples using dichotomized responses (presence/absence). Table S3. Comparison of weighted kappa statistics for 2, 3, and 4 response categorizations using simple averaging vs. category-level variables. Table S4. Comparison of ICC for simple averages vs. category-level variables. (DOCX 18 kb)
Competing interests
The authors declare that they have no competing interests.
Authors’contributions
MB designed the research, trained the data collection staff, provided oversight in data collection, interpreted results and led the manuscript preparation. ML conducted the analysis, interpreted the data and helped draft the manuscript. PS contributed to the study design, data interpretation and reviewed the manuscript. JC supported the data analysis methodology, interpreted the data and reviewed the manuscript. JS contributed to the design, analysis plan, interpretation and manuscript preparation. All authors read and approved the final manuscript.
Acknowledgments
We are grateful to all the families who took part in this study, to the midwives for their help in recruiting them, the paediatricians and health visitors and to the Born in Bradford team which included interviewers, data managers, laboratory staff, clerical workers, research scientists, volunteers and managers.
This article presents independent research commissioned by the National Institute for Health Research (NIHR) under its Programme Grants for Applied Research funding scheme (RP-PG-0407-10044). The views expressed in this publication are those of the authors and not necessarily those of the NHS, the NIHR or the Department of Health.
Author details 1
Clinical Trials Research Unit, Leeds Institute of Clinical Trials Research, University of Leeds, Leeds LS2 9JT, UK.2Bradford Institute of Health Research, Bradford Royal Infirmary, Bradford BD9 6RJ, UK.3Department of Nutrition, Gillings School of Global Public Health, University of North Carolina, Chapel Hill 27599, USA.4School of Health and Well-being, Leeds Beckett University, Leeds LS1 3HE, UK.5Department of Biostatistics, Gillings School of Global Public Health, University of North Carolina, Chapel Hill 27599, USA. 6Department of Epidemiology, Gillings School of Global Public Health, University of North Carolina, Chapel Hill 27599, USA.
Received: 26 November 2015 Accepted: 28 April 2016
References
1. Cullen KW, Baranowski T, Owens E, Marsh T, Rittenberry L, de Moor C. Availability, accessibility, and preferences for fruit, 100 % fruit juice, and vegetables influence children’s dietary behavior. Health Educ Behav. 2003; 30(5):615–26.
2. Arcan C, Hannan PJ, Fulkerson JA, Himes JH, Rock BH, Smyth M, et al. Associations of home food availability, dietary intake, screen time and physical activity with BMI in young American-Indian children. Public Health Nutr. 2013;16(01):146–55.
3. Boles RE, Scharf C, Filigno SS, Saelens BE, Stark LJ. Differences in Home Food and Activity Environments between Obese and Healthy Weight Families of Preschool Children. J Nutr Educ Behav. 2013;45(3):222–31.
5. Bryant M, Stevens J. Measurement of food availability in the home. Nutr Rev. 2006;64(2):67–76.
6. Crockett SJ, Potter JD, Wright MS, Bacheller A. Validation of a self-reported shelf inventory to measure food purchase behavior. J Am Diet Assoc. 1992; 92(6):694.
7. Miller C, Edwards L. Development and validation of a shelf inventory to evaluate household food purchases among older adults with diabetes mellitus. J Nutr Educ Behav. 2002;34(5):261–7.
8. Fulkerson J, Nelson M, Lytle L, Moe S, Heitzler C, Pasch K. The validation of a home food inventory. Int J Behav Nutr Phys Act. 2008;5(1):55.
9. Marsh T, Cullen KW, Baranowski T. Validation of a fruit, juice and vegetable availability questionnaire. J Nutr Educ Behav. 2003;35:100–4.
10. Bryant M, Ward D, Hales D, Vaughn A, Tabak R, Stevens J. Reliability and validity of the Healthy Home Survey: A tool to measure factors within homes hypothesized to relate to overweight in children. Int J Behav Nutr Phys Act. 2008;5(23):5868–23.
11. Santiago-Torres M, Adams AK, Carrel AL, LaRowe TL, Schoeller DA. Home food availability, parental dietary intake, and familial eating habits influence the diet quality of urban Hispanic children. Child Obes. 2014;10(5):408–15. 12. Hearst MO, Fulkerson JA, Parke M, Martin L. Validation of a home food
inventory among low-income Spanish- and Somali-speaking families. Public Health Nutr. 2013;16(07):1151–8.
13. Bryant M, Santorelli G, Fairley L, West J, Lawlor DA, Bhopal R, et al. Design and characteristics of a new birth cohort to study the early origins of childhood obesity: the BiB1000 study. Longitudinal Life Course Stud. 2013;4(3):119–35.
14. Wright J, Small N, Raynor P, Tuffnell D, Bhopal R, Cameron N, et al. Cohort profile: The Born in Bradford multi-ethnic family cohort study. Int J Epidemiol. 2012;42(4):978–91.
15. Stevens J, Bryant M, Wang L, Borja J, Bentley ME. Exhaustive measurement of food items in the home using a universal product code scanner. Public Health Nutr. 2010;DOI: 10.1017/S1368980010001837
16. Ogen J. Health Psychology: A textbook. 3rd ed. Maidenhead: McGraw-Hill; 2004.
17. Resnicow K, Hearn MD, Smith M, Baranowski T, Lin L, Baranowski J, et al. Social-Cognitive predictors of fruit and vegetable intake in children. Health Psychol. 1997;16:272–6.
18. Malik VS, Schulze MB, Hu FB. Intake of sugar-sweetened beverages and weight gain: a systematic review. Am J Clin Nutr. 2006;84(2):274–88. 19. Nicklas TA, Yang S-J, Baranowski T, Zakeri I, Berenson G. Eating patterns and
obesity in children: The Bogalusa Heart Study. Am J Prev Med. 2003;25(1):9–16. 20. Jago R, Page A, Froberg K, Sardinha LB, Klasson-Heggebø L, Andersen LB.
Screen-viewing and the home TV environment: The European Youth Heart Study. Prev Med. 2008;47(5):525–9.
21. van der Horst K, Oenema A, Ferreira I, Wendel-Vos W, Giskes K. A systematic review of environmental correlates of obesity-related dietary behaviors in youth. Health Educ Res. 2006;22:203.
22. Byrd-Bredbenner C, Maurer Abbot J. Differences in Food Supplies of U.S. Households with and without Overweight Individuals. Appetite. 2009;52:479–84.
23. Bryant M, Sahota P, Santorelli G, Hill A. An exploration and comparison of food and drink availability in homes in a sample of families of White and Pakistani origin within the UK. Public Health Nutr. 2015;18(7):1197–205. doi: 10.1017/S1368980014000147
24. Byrt T, Bishop J, Carlin JB. Bias, prevalence and kappa. J Clin Epidemiol. 1993;46(5):423–9.
25. Cohen J. A coefficient of agreement for nominal scales. Educ Psychol Meas. 1960;20:37–46.
26. Cicchetti D, Allison T. A new procedure for assessing reliability of scoring eeg sleep recordings. Am J EEG Technol. 1971;11:101–9.
27. Shrout PE, Fleiss JL. Intraclass correlations: uses in assessing rater reliability. Psychol Bull. 1979;86:420–8.
28. McGraw KO, Wong SP. Forming Inferences About Some Intraclass Correlation Coefficients. Psychol Methods. 1996;1(1):30–46.
29. Hamer RM. A SAS macro for computing intraclass correlation coefficients. In: Robert M. Hamer: Associate Professor of Psychiatry and Biostatistics VCU, editor.: Copyright (C) 1990, all rights reserved.; 1991.
30. Nunnally JC. Psychometric Theory. 25 Years Ago and Now. Educ Res. 1975;4(10):7–21.
31. Landis J, Koch G. The measurement of observer agreement for categorical data. Biometrics. 1977;33:159–74.
32. Shrout PE. Measurement reliability and agreement in psychiatry. Stat Methods Med Res. 1998;7(3):301–17.
33. Boles RE, Burdell A, Johnson SL, Gavin WJ, Davies PL, Bellows LL. Home food and activity assessment. Development and validation of an instrument for diverse families of young children. Appetite. 2014;80:23–7.
34. Sisk C, Sharkey J, McIntosh W, Anding J. Using multiple household food inventories to measure food availability in the home over 30 days: a pilot study. Nutr J. 2010;9(1):19.
35. Stevens J, Bryant M, Wang C-H, Cai J, Bentley ME. Sample Size and Repeated Measures Required in Studies of Foods in the Homes of African-American Families. J Nutr. 2012;142(6):1123–7.
36. Gustat J, O’Malley K, Luckett BG, Johnson CC. Fresh produce consumption and the association between frequency of food shopping, car access, and distance to supermarkets. Prev Med Reports. 2015;2:47–52.
37. Bauer KW, Widome R, Himes JH, Smyth M, Rock BH, Hannan PJ, et al. High food insecurity and its correlates among families living on a rural American Indian Reservation. Am J Public Health. 2012;102(7):1346–52.
38. Patterson R, Kristal A, Shannon J, Hunt J, White E. Using a brief household food inventory as an environmental indicator of individual dietary practices. Am J Public Health. 1997;87:272–5.
39. Cade J, Thompson R, Burley V, Warm D. Development, validation and utilisation of food-frequency questionnaires - a review. Public Health Nutr. 2002;5(4):567–87.
40. Martin-Biggers J, Koenings M, Quick V, Abbot JM, Byrd-Bredbenner C. Appraising nutrient availability of household food supplies using Block Dietary Screeners for individuals. Eur J Clin Nutr. 2015;69(9):1028–34. 41. French SA, Shimotsu S, Wall M, Gerlach AF. Capturing the Spectrum of
Household Food and Beverage Purchasing Behavior: A Review. J Am Diet Assoc. 2008;108:2051–8.
42. Bryant M, Stevens J, Wang L, Tabak R, Borja J, Bentley ME. Relationship between home fruit and vegetable availability and infant and maternal dietary intake in African-American families: evidence from the exhaustive home food inventory. J Am Diet Assoc. 2011;111(10):1491–7.
• We accept pre-submission inquiries
• Our selector tool helps you to find the most relevant journal
• We provide round the clock customer support
• Convenient online submission
• Thorough peer review
• Inclusion in PubMed and all major indexing services
• Maximum visibility for your research
Submit your manuscript at www.biomedcentral.com/submit