Parameters Measuring Beta-Cell Function Are Only Valuable
in Diabetic Subjects with Low Body Mass Index, High Blood
Glucose Level, or Long-Standing Diabetes
Seung Won Lee, Sangheun Lee, Se Hwa Kim, Tae Ho Kim, Byung Soo Kang, Seung Hoon Yoo,
Min Kyung Lee, Won Jun Koh, Won Sik Kang, and Hyeong Jin Kim
Department of Internal Medicine, Myongji Hospital, Kwandong University College of Medicine, Goyang, Korea.
Received: December 6, 2010 Revised: January 6, 2011 Accepted: January 12, 2011
Corresponding author: Dr. Hyeong Jin Kim, Department of Internal Medicine, Myongji Hospital, 697-24 Hwajeong-dong, Deogyang-gu, Goyang 412-270, Korea. Tel: 82-31-810-5419, Fax: 82-31-969-0500 E-mail: [email protected]
∙ The authors have no financial conflicts of interest.
© Copyright:
Yonsei University College of Medicine 2011
This is an Open Access article distributed under the terms of the Creative Commons Attribution Non-Commercial License (http://creativecommons.org/ licenses/by-nc/3.0) which permits unrestricted non-commercial use, distribution, and reproduction in any medium, provided the original work is properly cited.
Purpose:The aim of this study was to identify the most precise and clinically practi-cable parameters that predict future oral hypoglycemic agent (OHA) failure in pa-tients with type 2 diabetes, and to determine whether these parameters are valuable in various subgroups. Materials and Methods: We took fasting blood samples from 231 patients for laboratory data and standard breakfast tests for evaluation of pancre-atic beta-cell function. Hemoglobin A1c (HbA1c) levels were tested, and we collect-ed data relatcollect-ed to hypoglycemic mcollect-edications one year from the start date of the study. Results: Fasting C-peptide, postprandial insulin and C-peptide, the difference between fasting and postprandial insulin, fasting beta-cell responsiveness (M0), post-prandial beta-cell responsiveness (M1), and homeostasis model assessment-beta (HOMA-B) levels were significantly higher in those with OHA response than in those with OHA failure. The area under the curve (AUC) of the receiver operating characteristic (ROC) measured with postprandial C-peptide to predict future OHA failure was 0.720, and the predictive power for future OHA failure was the highest of the variable parameters. Fasting and postprandial C-peptide, M0, and M1 levels were the only differences between those with OHA response and those with OHA failure among diabetic subjects with low body mass index, high blood glucose level, or long-standing diabetes. Conclusion: In conclusion, postprandial C-peptide was most useful in predicting future OHA failure in type 2 diabetic subjects. However, these parameters measuring beta-cell function are only valuable in diabetic subjects with low body mass index, high blood glucose level, or long-standing diabetes.
Key Words: Type 2 diabetes, beta-cell function, OHA failure, standard breakfast test, C-peptide
INTRODUCTION
ferred to other hospitals, 10 withdrew their participation, and 14 were lost to follow-up without cause. For the remaining 182 patients, hemoglobin A1c (HbA1c) levels were tested and data regarding hypoglycemic medications at one year from the start date of the study were collected.
Standard breakfast test
Blood specimens for plasma insulin, C-peptide, and blood glucose levels were drawn after an overnight fast and 2 h after an individually composed breakfast meal. Plasma pro-insulin was tested only from fasting blood specimens. In or-der to exclude the influence of previous oral hypoglycemic agents or basal insulin on laboratory test results, all subjects discontinued previous medications and were administered a short-acting insulin analog (glulisine, Aventis Pharma) with premeal subcutaneous injections during the three days be-fore testing. The calorie counts of breakfast for each patient were calculated according to the following method:7,8
Car-bohydrates, proteins, and fat comprised 60%, 20%, and 20% of the total calories, respectively. Breakfast accounted for 30% of each day’s total calories.
Laboratory methods
Blood glucose concentrations were measured using a glucose oxidase technique (Beckman, Fullerton, CA, USA). HbA1c concentrations were analyzed using high-performance liq-uid chromatography (Variant II, Bio-Rad, Hercules, CA, USA). Insulin and C-peptide concentrations were measured by radioimmunoassay (Daiichi RI Co., Tokyo, Japan). Proin-sulin concentrations were measured by radioimmunoassay (catalog no. HPI-15K; Millipore, St. Charles, MO, USA). This assay showed <0.1% cross-reactivity to both human insulin and C-peptide.
Data processing
Markers of insulin sensitivity and beta-cell function were determined by the quantitative insulin sensitivity check in-dex (QUICKI) and homeostasis model assessment-beta (HOMA-B) index, respectively.9,10 Fasting beta-cell
respon-siveness (M0) represents the ability of fasting glucose to stimulate beta-cell secretion, and postprandial beta-cell re-sponsiveness (M1) represents the ability of postprandial glucose to step up beta-cell secretion; these values were calculated using the formula of Hovorka, et al.11 with some
modification: M0=100×fasting C-peptide (μg/L)/fasting glucose concentration (mg/dL), and M1=100×[postprandial 2-h C-peptide concentration (μg/L)-fasting C-peptide con-change is thought to be a major reason for poor responses
to OHA treatment.1,2 Deterioration of beta-cell function is
the strongest disease-related factor. In several longitudinal studies, beta-cell function of patients with type 2 diabetes declined continuously over time.3,4 At diagnosis, beta-cell
function was already reduced by 50%, and further deterio-ration occurred regardless of therapy.3 The mechanisms of
action of almost all OHAs are insulin-dependent, and they do not decrease the blood glucose level when beta-cell function has severely deteriorated. Thus, deterioration of beta-cell function is an important cause of OHA failure in patients with type 2 diabetes.
Diagnosis of beta-cell dysfunction in patients with type 2 diabetes plays an important role when OHA failure is sus-pected or new treatment modalities are used. Insulin, C-peptide, and proinsulin are secreted from pancreatic beta-cells and are the key protein hormones that reflect beta-cell function.5 However, insulin and C-peptide levels, as well as
different indexes taking into account fasting plasma insulin in relation to fasting blood glucose, are not clear in mea-surements of insulin secretion and clinical decisions.
The aim of this study was to identify the most precise and clinically practicable parameters that predict future OHA failure in patients with type 2 diabetes, and to determine whether these parameters are valuable in various subgroups.
MATERIALS AND METHODS
Subjects
We recruited 267 patients with diabetes who were managed with oral hypoglycemic agents or insulin in the Endocrinol-ogy Department of Kwandong University Myongji Hospi-tal, located in Goyang, Korea, between February and May 2009. Thirty-six of these patients were excluded for the fol-lowing reasons: type 1 diabetes, pregnant or breast-feeding, acute or chronic infectious diseases, or general treatment with glucocorticoids. The ethics committee approved the study protocol. All patients provided informed consent.
The remaining 231 patients (115 women) gave fasting blood samples for laboratory data and the standard breakfast test for evaluation of pancreatic beta-cell function. We managed the study participants according to a consensus algorithm for the management of hyperglycemia in type 2 diabetes from the American Diabetes Association and The European Association for the Study of Diabetes.6 We were unable to maintain contact
trans-ues (interquartile range) of age and diabetic duration were 61.5 (47.0-71.0) and 9.0 (2.0-15.0) years, respectively. Fif-ty-seven patients had been treated with insulin injections (39 patients with insulin and OHA, 18 patients with insulin only) at one year from the start date of the study. The medi-an insulin dose was 30.0 (22.0-38.0) units. One hundred medi-and twenty-five patients were treated with OHA only: monother-apy in 13 patients, double combination thermonother-apy in 78, and triple combination therapy in 34.
Comparison of baseline insulin secretion parameters of those with oral hypoglycemic response versus failure
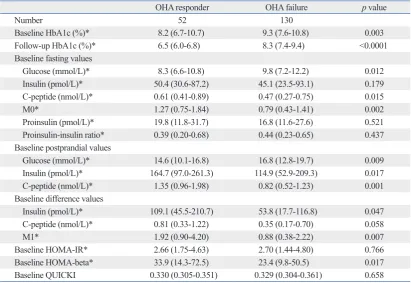
In total, 182 patients (excluding the 49 lost to follow-up) were divided into those with OHA response (n=52) or OHA failure (n=130) according to insulin administration or the follow-up HbA1c 7.0% cutoff. There was no difference in gender, age, weight, or other baseline clinical characteristics between the two groups. Only the duration of diabetes was significantly higher in those with OHA failure than in those with OHA response (Table 1). In laboratory parameters rep-resenting the insulin secretion reserve of pancreatic beta-cells, fasting C-peptide, postprandial insulin and C-peptide, the differences between fasting and postprandial insulin, M0, M1, and HOMA-beta levels were significantly higher in those with OHA response than in those with OHA fail-ure. However, fasting proinsulin, fasting insulin, and insulin sensitivity indices (HOMA-IR and QUICKI) did not differ between the two groups (Table 2).
Prediction model ROC curve for OHA failure
The AUC of the ROC measured with postprandial C-pep-tide to predict future OHA failure was 0.720, and the pre-dictive power for future OHA failure was the highest of the variable parameters representing pancreatic beta-cell func-tion. The AUC of the ROC measured with M0, fasting C-peptide, HOMA-beta, proinsulin, M1, insulin difference, and postprandial insulin were 0.659, 0.637, 0.589, 0.547, 0.655, 0.647, and 0.633, respectively.
When the postprandial C-peptide cutoff dividing those with OHA response and failure was 1.09 nmol/L (3.3 ng/ mL), the sensitivity and specificity of the diagnosis of OHA failure were 67.3% and 65.4%, respectively. When the fast-ing C-peptide cutoff was 0.57 nmol/L (1.57 ng/mL), the sensitivity and specificity of the diagnosis of OHA failure were 59.6% and 58.5%, respectively. The sensitivity and specificity of the diagnosis of OHA failure with an M0 cut-off of 1.03 were 65.4% and 63.8%, respectively. The sensi-centration (μg/L)]/[postprandial 2-h glucose consensi-centration
(mg/dL)-fasting glucose concentration (mg/dL)]. QUICKI was calculated as 1/[log fasting insulin (μU/mL)+log fast-ing glucose (mg/dL)], and HOMA-beta as [20×fastfast-ing in-sulin (μU/mL)]/[fasting glucose (mmol/L)-3.5].
Hypertension was defined as systolic blood pressure of 140 mmHg or greater, diastolic blood pressure of 90 mmHg or greater, or use of antihypertensive medication.12 Dyslipidemia
was defined as triglycerides of 1.3 mmol/L or greater, high-density lipoprotein cholesterol of 1.0 mmol/L or less in men and 1.3 mmol/L or less in women, or use of lipid-lowering agents.13 Diabetic retinopathy was defined as a diagnosis of
nonproliferative retinopathy or proliferative retinopathy by an ophthalmologist. Diabetic nephropathy was defined as an al-bumin to creatinine ratio of 300 μg/mg in a random urine test or an estimated glomerular filtration rate by the Cockroft-Gault equation of 60 mL/min or less per 1.73 m2 body
sur-face area.14 Regular physical activity was defined as weekly
exercise time of 150 min or greater.15 Drinkers were defined
as those with weekly alcohol intake of 210 g or greater in men and 105 g or greater in women.14 OHA failure was
de-fined as insulin use for control of blood glucose or HbA1c of 7.0% or greater with maximal doses of combined OHAs (two or more of metformin, sulfonylurea, or thiazolidinedione).
Statistical analyses
Several variables, including HbA1c, blood glucose, insulin, C-peptide, HOMA-IR, HOMA-beta, and proinsulin, were not normally distributed in the Shapiro-Wilk test. Logarith-mic transformation was used to normalize them, and the variables were applied in the following analyses. A logistic regression analysis was used to compare the clinical and laboratory variables between those who responded to OHA and those in which it failed after adjusting for gender, age, and duration of diabetes. The receiver operating character-istic (ROC) and the area under the curve (AUC) were mea-sured for estimation of the prediction power of future OHA failure by various insulin secretion parameters. We divided subgroups according to body mass index (BMI), fasting glucose, and duration of diabetes, and compared insulin se-cretion parameters by logistic regression analysis after ad-justing for gender, age, and duration of diabetes.
RESULTS
val-peptide (0.55 and 0.36-0.85 vs. 0.34 and 0.25-0.61 nmol/L; p=0.021), M0 (1.24 and 0.66-1.49 vs. 0.66 and 0.41-1.10; p=0.002), HOMA-beta (26.9 and 13.2-55.3 vs. 17.5 and 8.1-41.6; p=0.019), postprandial Cpeptide (1.35 and 0.95-1.77 vs. 0.72 and 0.46-1.15 nmol/L; p=0.005), and M1 (1.92 and 0.95-4.15 vs. 0.83 and 0.37-1.79; p=0.013). In contrast, in the subgroup with high BMIs (≥25), the levels of insulin secretion parameters were higher than in those with OHA failure, but there was no significant difference between OHA response and failure (Fig. 1).
Comparison of baseline insulin secretion parameters of those with OHA response versus failure in subgroup analysis according to fasting glucose levels
Among the 182 patients with follow-up HbA1c, 77 patients had fasting blood glucose levels of 10 mmol/L or greater. In patients with high fasting blood glucose, those with OHA response versus OHA failure have the following character-tivity and specificity of the diagnosis of OHA failure with
an M1 cutoff of 1.33 was 61.5% and 61.5%, respectively. The lowest values of fasting and postprandial C-peptide, M0, and M1 in those with OHA response were 0.18 nmol/L (0.56 ng/mL), 0.45 nmol/L (1.37 ng/mL), 0.32, and -19.21, respectively. When the HbA1c cutoff dividing OHA response and failure was 8.7%, the sensitivity, specificity, and AUC of the ROC were 60.8%, 61.5%, and 0.673. When the dura-tion of diabetes cutoff was 7.5 years, these values were 57.7%, 57.7%, and 0.611.
Comparison of baseline insulin secretion parameters of those with OHA response versus failure in subgroup analysis according to BMI
Of the 182 patients with follow-up HbA1c, 115 had BMIs of 25.0 or less. In patients with low BMIs (<25.0), those with OHA response versus OHA failure have the following char-acteristics: medians and interquartile ranges of fasting
C-Table 1. Comparison of Baseline Clinical Parameters of OHA Responders versus Failures
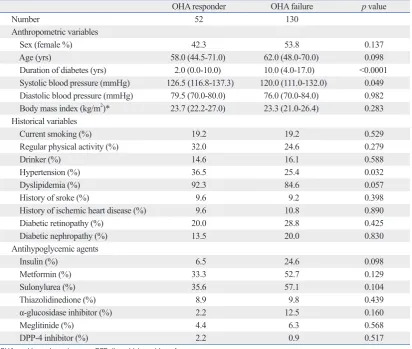
OHA responder OHA failure p value
Number 52 130
Anthropometric variables
Sex (female %) 42.3 53.8 0.137
Age (yrs) 58.0 (44.5-71.0) 62.0 (48.0-70.0) 0.098
Duration of diabetes (yrs) 2.0 (0.0-10.0) 10.0 (4.0-17.0) <0.0001
Systolic blood pressure (mmHg) 126.5 (116.8-137.3) 120.0 (111.0-132.0) 0.049
Diastolic blood pressure (mmHg) 79.5 (70.0-80.0) 76.0 (70.0-84.0) 0.982
Body mass index (kg/m2)* 23.7 (22.2-27.0) 23.3 (21.0-26.4) 0.283
Historical variables
Current smoking (%) 19.2 19.2 0.529
Regular physical activity (%) 32.0 24.6 0.279
Drinker (%) 14.6 16.1 0.588
Hypertension (%) 36.5 25.4 0.032
Dyslipidemia (%) 92.3 84.6 0.057
History of sroke (%) 9.6 9.2 0.398
History of ischemic heart disease (%) 9.6 10.8 0.890
Diabetic retinopathy (%) 20.0 28.8 0.425
Diabetic nephropathy (%) 13.5 20.0 0.830
Antihypoglycemic agents
Insulin (%) 6.5 24.6 0.098
Metformin (%) 33.3 52.7 0.129
Sulonylurea (%) 35.6 57.1 0.104
Thiazolidinedione (%) 8.9 9.8 0.439
α-glucosidase inhibitor (%) 2.2 12.5 0.160
Meglitinide (%) 4.4 6.3 0.568
DPP-4 inhibitor (%) 2.2 0.9 0.517
OHA, oral hypoglycemic agent; DPP, dipeptidyl peptidase-4. Data are expressed as medians (interquartile range) and percentages.
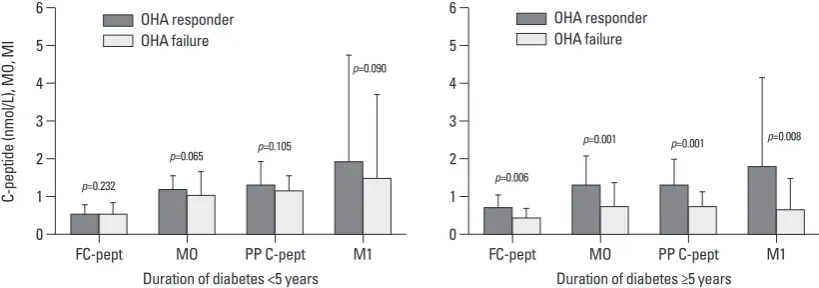
[image:4.595.85.498.81.430.2]Comparison of baseline insulin secretion parameters of OHA response versus failure in subgroup analysis according to the duration of diabetes
Of the 182 patients with follow-up HbA1c, 119 patients had had diabetes for over five years. In patients with long dia-betic duration, those with OHA response versus OHA fail-ure have the following characteristics: medians and inter-quartile ranges of fasting C-peptide (0.72 and 0.55-1.07 vs. istics: medians and interquartile ranges of M0 (0.88 and
[image:5.595.99.511.80.363.2]0.47-1.23 vs. 0.51 and 0.35-0.89; p=0.032), postprandial in-sulin (104.6 and 69.7-259.3 vs. 75.9 and 42.2-171.4 pmol/L; p=0.028), postprandial C-peptide (1.11 and 0.76-1.90 vs. 0.73 and 0.46-1.11 nmol/L; p=0.007), and M1 (1.80 and 0.95-3.93 vs. 0.67 and 0.26-1.59; p=0.009). In the subgroup with low fasting blood glucose, however, there was no signifi-cant difference between OHA response and failure (Fig. 2).
Table 2. Comparison of Baseline Laboratory Parameters of OHA Responders versus Failures
OHA responder OHA failure p value
Number 52 130
Baseline HbA1c (%)* 8.2 (6.7-10.7) 9.3 (7.6-10.8) 0.003
Follow-up HbA1c (%)* 6.5 (6.0-6.8) 8.3 (7.4-9.4) <0.0001
Baseline fasting values
Glucose (mmol/L)* 8.3 (6.6-10.8) 9.8 (7.2-12.2) 0.012
Insulin (pmol/L)* 50.4 (30.6-87.2) 45.1 (23.5-93.1) 0.179
C-peptide (nmol/L)* 0.61 (0.41-0.89) 0.47 (0.27-0.75) 0.015
M0* 1.27 (0.75-1.84) 0.79 (0.43-1.41) 0.002
Proinsulin (pmol/L)* 19.8 (11.8-31.7) 16.8 (11.6-27.6) 0.521
Proinsulin-insulin ratio* 0.39 (0.20-0.68) 0.44 (0.23-0.65) 0.437
Baseline postprandial values
Glucose (mmol/L)* 14.6 (10.1-16.8) 16.8 (12.8-19.7) 0.009
Insulin (pmol/L)* 164.7 (97.0-261.3) 114.9 (52.9-209.3) 0.017
C-peptide (nmol/L)* 1.35 (0.96-1.98) 0.82 (0.52-1.23) 0.001
Baseline difference values
Insulin (pmol/L)* 109.1 (45.5-210.7) 53.8 (17.7-116.8) 0.047
C-peptide (nmol/L)* 0.81 (0.33-1.22) 0.35 (0.17-0.70) 0.058
M1* 1.92 (0.90-4.20) 0.88 (0.38-2.22) 0.007
Baseline HOMA-IR* 2.66 (1.75-4.63) 2.70 (1.44-4.80) 0.766
Baseline HOMA-beta* 33.9 (14.3-72.5) 23.4 (9.8-50.5) 0.017
Baseline QUICKI 0.330 (0.305-0.351) 0.329 (0.304-0.361) 0.658
OHA, oral hypoglycemic agent; HOMA-IR or HOMA-beta, homeostasis model assessment of insulin resistance and beta-cell function; QUICKI, quantitative insulin sensitivity check index.
Data are expressed as medians (interquartile range) and percentages.
p was calculated adjusting for gender, age, and duration of diabetes. *p was calculated from log-transformed data.
Fig. 1. Comparison of baseline insulin secretion parameters of OHA responders versus failures in subgroup analysis according to body mass index (BMI). Data are expressed as medians (interquartile range). OHA, oral hypoglycemic agent; FC-pept, fasting C-peptide; PP C-pept, postprandial C-peptide.
0 1 2 3 4 5 6
C-pe
pt
id
e
(n
m
ol
/L
),
M
O,
M
I
FC-pept
Body mass index <25
MO PP C-pept M1
p=0.021
p=0.002 p=0.005
p=0.013
0 1 2 3 4 5 6
FC-pept
Body mass index ≥25
MO PP C-pept M1
p=0.641
p=0.389 p=0.116
p=0.213
OHA responder OHA failure
[image:5.595.103.508.430.577.2]drawback, different insulin concentrations are required. Ad-ditionally, the need for reaching and maintaining different steady states within the same experiment makes it impossi-ble to perform routinely in clinical practice.
In clinical practice, only fasting samples or simple stimu-lation tests, such as the OGTT, the glucagon stimulatory test, or the standard breakfast test, which are the most wide-ly used and validated, may be used as parameters of insulin secretion. In these tests, mathematical handling of fasting levels of glucose, insulin, and C-peptide concentrations is the simplest method. Mathematical handling of the fasting levels has been used for the calculation of insulin sensitivity and secretion by introducing various indices, such as HOMA, fasting beta-cell responsiveness (M0), and QUICKI.9-11
How-ever, these simplistic approaches do not give clues about the dynamic state of the relationship between insulin sensi-tivity and secretion. To estimate beta-cell function, dynamic tests are more useful than fasting samples.
The most widely used test to evaluate insulin reserves is the glucagon stimulatory test. Its validity has been discussed, 0.43 and 0.26-0.71 nmol/L; p=0.006), M0 (1.34 and
1.14-2.13 vs. 0.76 and 0.44-1.36; p=0.001), postprandial C-pep-tide (1.37 and 1.10-2.02 vs. 0.76 and 0.50-1.13 nmol/L; p=0.001), M1 (1.82 and 0.96-4.20 vs. 0.67 and 0.31-1.53; p=0.008), and C-peptide difference (0.85 and 0.31-1.22 vs. 0.31 and 0.15-0.53 nmol/L; p=0.021). In the subgroup with short diabetic duration, however, there was no significant difference between those with OHA response and with OHA failure (Fig. 3).
DISCUSSION
The gold standard for measuring insulin sensitivity is the euglycemic hyperinsulinemic clamp technique,16 which is
[image:6.595.86.491.68.213.2]reproducible and sensitive. However, insulin secretion can-not be evaluated from the euglycemic clamp. When using the clamp, it is thus necessary to perform another experi-ment, such as a primed hyperglycemic glucose clamp or an intravenous glucose tolerance test.17 To circumvent this
Fig. 2. Comparison of baseline insulin secretion parameters of OHA responders versus failures in subgroup analysis according to fasting blood glucose levels. Data are expressed as medians (interquartile range). OHA, oral hypoglycemic agent; FC-pept, fasting C-peptide; PP C-pept, postprandial C-peptide.
0 1 2 3 4 5 6 C-pe pt id e (n m ol /L ), M O, M I FC-pept
Fasting blood glucose <10 mmol/L
MO PP C-pept M1
p=0.160 p=0.105 p=0.121 p=0.249 0 1 2 3 4 5 6 FC-pept
Fasting blood glucose ≥10 mmol/L
MO PP C-pept M1
p=0.059
p=0.032
p=0.007 p=0.009
OHA responder OHA failure
OHA responder OHA failure
Fig. 3. Comparison of baseline insulin secretion parameters of OHA responders versus failures in subgroup analysis according to dura-tion of diabetes. Data are expressed as medians (interquartile range). OHA, oral hypoglycemic agent; FC-pept, fasting C-peptide; PP C-pept, postprandial C-peptide.
0 1 2 3 4 5 6 C-pe pt id e (n m ol /L ), M O, M I FC-pept
Duration of diabetes <5 years
MO PP C-pept M1
p=0.232
p=0.065 p=0.105
p=0.090 0 1 2 3 4 5 6 FC-pept
Duration of diabetes ≥5 years
MO PP C-pept M1
p=0.006
p=0.001 p=0.001 p=0.008
OHA responder OHA failure
[image:6.595.85.495.260.404.2]one-year period. The sensitivity and specificity of basal C-peptide levels of less than 0.9 nmol/L in patients with insu-lin treatment were 83.6% and 78.9%, respectively. For postprandial values of less than 1.9 nmol/L, the sensitivity and specificity were 77.7% and 78.9%, respectively. The cut-off values, sensitivity, and specificity of the Manzanares study were higher than those of our study. However, only patients with a high basal glucose (greater than 11.1 mmol/ L) were enrolled in the Manzanares study. If we had select-ed patients with a high basal glucose (greater than 10.0 mmol/L) for our study, the sensitivity and specificity would have been higher (data not shown). Thus, the results of our study can be generally applied to all diabetic subjects. The higher cutoff values found in the Manzanares study may be explained by higher BMI, racial differences, higher insulin resistance, or a combination of these factors.
In a previous study, C-peptide release in lean and over-weight patients was found to be significantly lower in insu-lin-treated than in OHA-treated patients, but this difference disappeared in obese patients.25 In our study, we observed
the same relationship between obesity and values of beta-cell functional parameters. Variations in insulin clearance, mainly in obese patients, and particularly those with excess abdominal fat, may modify the relationship between plas-ma insulin values and insulin secretion. Abdominal obesity was inversely correlated with the hepatic extraction frac-tion, and directly correlated with posthepatic delivery of in-sulin.26 Thus, insulin hypersecretion in obese diabetes
pa-tients represents a diminution of peripheral insulin sensitivity rather than insulin secretion function of pancreatic beta-cells. In fact, there was a marked difference in insulin sensi-tivity indicators such as HOMA-IR and QUICKI between the groups with low and high BMI.
In contrast, the data of the subgroups divided by duration of diabetes or fasting plasma glucose levels differed from that of BMI. There was no significant difference in HOMA-IR or QUICKI between groups divided by duration of dia-betes or fasting plasma glucose levels (data not shown). In subjects with high fasting plasma glucose, pancreatic insu-lin secretion was fully stimulated, as opposed to the sub-maximal stimulation in subjects with low fasting plasma glucose. The plasma C-peptide response to intravenous glu-cagon and to a standard test meal was markedly potentiated by acute hyperglycemia in type 2 diabetes mellitus. How-ever, no further potentiation was obtained when the prestim-ulatory blood glucose concentration rose above 12 mmol/L.27
This suggests that maximal stimulation of beta-cells raises along with the methodological aspects of its
interpreta-tion.18 The glucagon test has the advantage of being a more
reproducible stimulus and having much faster action on be-ta-cells (peak values after 6 instead of 120 min), allowing a marked reduction in observation time. In contrast, the stan-dard breakfast test has the advantage of being a greater physiological stimulus, avoiding the side effects of gluca-gon injection. However, in clinical practice, both tests are useful in estimating beta-cell function. The standard break-fast test could be an alternative to the glucagon stimulatory test; a good correlation of C-peptide increments in the two tests has been observed.19
The use of measurements related to the circulating insu-lin concentration does not necessarily translate to informa-tion on insulin secreinforma-tion because only posthepatic insulin delivery is considered. The role of hepatic insulin extraction should also be taken into account if we are interested in evaluating beta-cell function. However, C-peptide is equi-molarly released with insulin, not degraded in the liver, and has a 10-fold longer half-life.20 Therefore, C-peptide is
con-sidered to be a more reliable marker of pancreatic insulin secretion than insulin.
Hovorka, et al.21 proposed pancreatic responsiveness
dur-ing glucose stimulation (M1) and under basal conditions (M0) during the meal tolerance test, and reported a significant difference in these parameters between healthy and type 2 di-abetic subjects. A key aspect of M0 and M1 is that C-peptide, a representative parameter of pancreatic beta-cell function, is corrected by plasma glucose levels. M0 was more valuable for predicting OHA failure than fasting C-peptide, and the predictive power for future OHA failure of M0 was compara-ble to that of postprandial C-peptide. If only fasting samples are available, it has been suggested that M0 is the most valu-able parameter for estimating beta-cell function.
Levels of proinsulin-like molecules are elevated in sub-jects with type 2 diabetes or impaired glucose tolerance.22 It
has been suggested that elevated proinsulin levels are a manifestation of beta-cell dysfunction rather than of in-creased demand on the beta-cell. This may reflect beta-cell “stress”, with defective post-translational processing and/or accelerated granule secretion before processing is complet-ed.23 We found no difference in fasting proinsulin levels or
in the proinsulin to insulin ratio between those with OHA response and failure. Additional studies are necessary to identify the roles of proinsulin-like molecules in diabetes.
Manzanares, et al.24 studied the efficacy of a standard
perglycemic stress. Diabetes 1964;13:6-13.
2. Groop LC, Pelkonen R, Koskimies S, Bottazzo GF, Doniach D. Secondary failure to treatment with oral antidiabetic agents in non-insulin-dependent diabetes. Diabetes Care 1986;9:129-33. 3. U.K. prospective diabetes study 16. Overview of 6 years’ therapy
of type II diabetes: a progressive disease. U.K. Prospective Diabe-tes Study Group. DiabeDiabe-tes 1995;44:1249-58.
4. Festa A, Williams K, D’Agostino R Jr, Wagenknecht LE, Haffner SM. The natural course of beta-cell function in nondiabetic and diabetic individuals: the Insulin Resistance Atherosclerosis Study. Diabetes 2006;55:1114-20.
5. Hutton JC. Insulin secretory granule biogenesis and the proinsulin-processing endopeptidases. Diabetologia 1994;37 Suppl 2:S48-56. 6. Nathan DM, Buse JB, Davidson MB, Ferrannini E, Holman RR, Sherwin R, et al. Medical management of hyperglycemia in type 2 diabetes: a consensus algorithm for the initiation and adjustment of therapy: a consensus statement of the American Diabetes Asso-ciation and the European AssoAsso-ciation for the Study of Diabetes. Diabetes Care 2009;32:193-203.
7. Mifflin MD, St Jeor ST, Hill LA, Scott BJ, Daugherty SA, Koh YO. A new predictive equation for resting energy expenditure in healthy individuals. Am J Clin Nutr 1990;51:241-7.
8. Larsen PR, Kronenberg HM, Melmed S, Polonsky KS. Williams textbook of endocrinology. 10th ed. Philadelphia: SAUNDERS; 2003.
9. Katz A, Nambi SS, Mather K, Baron AD, Follmann DA, Sullivan G, et al. Quantitative insulin sensitivity check index: a simple, ac-curate method for assessing insulin sensitivity in humans. J Clin Endocrinol Metab 2000;85:2402-10.
10. Albareda M, Rodriguez-Espinosa J, Murugo M, de Leiva A, Corcoy R. Assessment of insulin sensitivity and beta-cell function from measurements in the fasting state and during an oral glucose tolerance test. Diabetologia 2000;43:1507-11.
11. Hovorka R, Chassin L, Luzio SD, Playle R, Owens DR. Pancreatic beta-cell responsiveness during meal tolerance test: model assess-ment in normal subjects and subjects with newly diagnosed nonin-sulin-dependent diabetes mellitus. J Clin Endocrinol Metab 1998;83:744-50.
12. Chobanian AV, Bakris GL, Black HR, Cushman WC, Green LA, Izzo JL Jr, et al. The Seventh Report of the Joint National Com-mittee on Prevention, Detection, Evaluation, and Treatment of High Blood Pressure: the JNC 7 report. JAMA 2003;289:2560-72. 13. Expert Panel on Detection, Evaluation, and Treatment of High Blood Cholesterol in Adults. Executive Summary of The Third Report of The National Cholesterol Education Program (NCEP) Expert Panel on Detection, Evaluation, And Treatment of High Blood Cholesterol In Adults (Adult Treatment Panel III). JAMA 2001;285:2486-97.
14. American Diabetes Association. Standards of medical care in dia-betes--2006. Diabetes Care 2006;29 Suppl 1:S4-42.
15. Ryan TJ, Antman EM, Brooks NH, Califf RM, Hillis LD, Hiratz-ka LF, et al. 1999 update: ACC/AHA Guidelines for the Manage-ment of Patients With Acute Myocardial Infarction: Executive Summary and Recommendations: A report of the American Col-lege of Cardiology/American Heart Association Task Force on Practice Guidelines (Committee on Management of Acute Myo-cardial Infarction). Circulation 1999;100:1016-30.
16. DeFronzo RA, Tobin JD, Andres R. Glucose clamp technique: a method for quantifying insulin secretion and resistance. Am J Physiol 1979;237:E214-23.
the predictive power of insulin secretion parameters, detect-ing OHA failure.
Explaining the effect of diabetic duration on the predicting power of the parameters of beta-cell function is less clear. Among patients with OHA failure, the levels of fasting and postprandial C-peptide, M0, and M1 of patients with long duration of diabetes were markedly lower than those with shorter duration of diabetes. This may be due to the continu-ous decrease in beta-cell function that occurs in long-stand-ing diabetes. In contrast, the levels of these parameters did not differ between the two groups in those with OHA re-sponse. The difference in beta-cell function between those with OHA response and those with OHA failure seemed to be pronounced in patients with long diabetic duration.
This study has some limitations. Both patient- and disease-related factors can contribute to OHA failure in type 2 diabe-tes. We primarily evaluated the usefulness of insulin secre-tion parameters in predicting OHA failure. Poor compliance with lifestyle change is thought to be a major reason for poor responses to OHA treatment; we did not relate the effects of lifestyle changes to the participants’ responses to OHA. In this study, we defined OHA failure as insulin use for control of blood glucose or HbA1c of 7.0% or greater with more than double OHA. The cutoff value of HbA1c was quite strict compared to one previous study.26 Some subjects with
mild hyperglycemia may not have been true OHA failures. Future studies correcting these weak points are needed.
In conclusion, postprandial C-peptide was the most useful of the simple insulin secretion parameters for predicting fu-ture OHA failure in type 2 diabetic subjects. M0 using fast-ing samples was shown to be the next most useful. However, these parameters, which measure beta-cell function, are only valuable in diabetic subjects with low BMI, high blood glu-cose level, or long-standing diabetes.
ACKNOWLEDGEMENTS
The authors would like to acknowledge all the patients who participated in this study, and medical staff of Kwandong University Myongji Hospital for their excellent patient care.
REFERENCES
hy-trations in obese and nonobese individuals with varying degrees of glucose tolerance. J Clin Endocrinol Metab 1993;76:44-8. 23. Yudkin JS. Circulating proinsulin-like molecules. J Diabetes
Complications 1993;7:113-23.
24. Manzanares JM, Conget I, Gonzalez-Clemente JM, Vidal J, Ro-dríguez-Villar C, Rojas I, et al. [Insulin treatment in diabetes mel-litus type II: the usefulness of the breakfast test]. Med Clin (Barc) 1995;104:761-4.
25. Pontiroli AE, Calderara A, Maffi P, Bonisolli L, Carenini A, Piatti PM, et al. Secondary failure to oral hypoglycaemic agents in non-obese patients with non-insulin-dependent diabetes is related to reduced insulin release. Diabete Metab 1989;15:79-84.
26. Peiris AN, Mueller RA, Smith GA, Struve MF, Kissebah AH. Splanchnic insulin metabolism in obesity. Influence of body fat distribution. J Clin Invest 1986;78:1648-57.
27. Gjessing HJ, Reinholdt B, Faber OK, Pedersen O. The effect of acute hyperglycemia on the plasma C-peptide response to intrave-nous glucagon or to a mixed meal in insulin-dependent diabetes mellitus. Acta Endocrinol (Copenh) 1991;124:556-62.
17. Pacini G, Mari A. Methods for clinical assessment of insulin sen-sitivity and beta-cell function. Best Pract Res Clin Endocrinol Metab 2003;17:305-22.
18. Scheen AJ, Castillo MJ, Lefébvre PJ. Assessment of residual insu-lin secretion in diabetic patients using the intravenous glucagon stimulatory test: methodological aspects and clinical applications. Diabetes Metab 1996;22:397-406.
19. Koskinen PJ, Viikari JS, Irjala KM. Glucagon-stimulated and postprandial plasma C-peptide values as measures of insulin se-cretory capacity. Diabetes Care 1988;11:318-22.
20. Hovorka R, Jones RH. How to measure insulin secretion. Diabe-tes Metab Rev 1994;10:91-117.
21. Hovorka R, Chassin L, Luzio SD, Playle R, Owens DR. Pancreat-ic beta-cell responsiveness during meal tolerance test: model as-sessment in normal subjects and subjects with newly diagnosed noninsulin-dependent diabetes mellitus. J Clin Endocrinol Metab 1998;83:744-50.