The tear behaviour of some tri-block copolymer
elastomers.
HODGKINSON, John Michael.
Available from Sheffield Hallam University Research Archive (SHURA) at:
http://shura.shu.ac.uk/19802/
This document is the author deposited version. You are advised to consult the
publisher's version if you wish to cite from it.
Published version
HODGKINSON, John Michael. (1980). The tear behaviour of some tri-block
copolymer elastomers. Doctoral, Sheffield Hallam University (United Kingdom)..
Copyright and re-use policy
See
http://shura.shu.ac.uk/information.html
Sheffield City Polytechnic Eric M ensforth Library
REFERENCE ONLY
This book must not be taken from the LibraryPL/26
w —* LH I
POLYTECHNIC LIBRARY
POND STREET SHEFFIELD SI 1WB
ProQuest Number: 10697104
All rights reserved
INFORMATION TO ALL USERS
The quality of this reproduction is dependent upon the quality of the copy submitted.
In the unlikely event that the author did not send a com plete manuscript and there are missing pages, these will be noted. Also, if material had to be removed,
a note will indicate the deletion.
uest
ProQuest 10697104
Published by ProQuest LLC(2017). Copyright of the Dissertation is held by the Author.
All rights reserved.
This work is protected against unauthorized copying under Title 17, United States C ode Microform Edition © ProQuest LLC.
ProQuest LLC.
789 East Eisenhower Parkway P.O. Box 1346
THE TEAR BEHAVIOUR OF SOME TRI-BLOCK COPOLYMER ELASTOMERS
by
John Michael Hodgkinson, MSc
This Thesis Has Been Submitted in Partial Fulfilment of the Requirements for the Award of the
Degree of Doctor of Philosophy
of the Council for National Academic Awards
Sponsoring Establishment June 1980
Sheffield City Polytechnic
Collaborating Establishment |
ofi >01
THE TEAR BEHAVIOUR OF SOME TRI-BLOCK COPOLYMER ELASTOMERS by
John M. Hodgkinson
ABSTRACT
Four SBS block copolymers were subjected to extensive chemical examination to determine block molecular weights and styrene fractions.
Casting from different solvent systems into sheet form resulted in a range of microstructural formations for the normally dispersed styrene phase. These morphological details were studied using transmission electron microscopy and low angle X-ray scattering.
Dynamic mechanical tests, on sheet material cast from different solvent systems, in both shear and tension over a wide temperature range, and static tensile tests at +20°C, revealed significant differences in viscoelastic properties between the materials. These differences were related to changes in morphological detail by the use of a model for composite materials. The large strain behaviour at +20°C is modelled by the inverse Langevin function and a debonding parameter which is related to void growth in the material.
SUMMARY
Four S-B-S block copolymers were subjected to thorough chemical examination to determine block molecular weight and styrene content. Casting the copolymers from several solvent systems resulted in different microstructured details, which were revealed by transmission electron microscopy and small angle X-ray scattering to be either lamellar or
cylindrical formations of styrene in a butadiene matrix. Isotropy in the plane of the cast sheets is conferred by the randomness of the orientation of areas maintaining internal orientation.
Dynamic mechanical tests in both shear and tension were conducted over a wide temperature range encompassing the transition points relating to the styrene and butadiene phases. The high modulus recorded at low temperature falls rapidly to a plateau level between the two transitions; as the styrene glass temperature is approached, the modulus again falls rapidly. The value of the plateau modulus is dependent upon the casting solvent system, solvents favouring the formation of a largely lamellar morphology recording higher moduli than solvents forming the cylindrical type of structure. The relationship between dynamic tensile and shear moduli was found to be described by E r *= 1.5 Gr. The loss tangent recorded at the transition points was also found to be a function of
casting solvent, lamellae-forming solvents resulting in a low tan 6 at the butadiene transition, and a high value at the styrene peak, the opposite being the case for cylinder-forming solvents.
Static tensile tests at +20°C showed that the initial modulus varied with the casting solvent system or microstructure, the lamellar material resulting in an enhanced modulus and yielding accompanied by necking; materials containing a cylindrical structure had a relatively low modulus with no necking. Between 2% and 600% strain, cold drawing occurred, followed by an increase in stress leading to final rupture. The tensile behaviour was found to be described by two analytical functions which, when combined with a debonding parameter, gives expression to an internal cavitation process which is dependent upon the microstructure of the material.
the volume proportion of the dispersed phase. Using data from static tensile tests, the relevant structure factors for the materials were determined. The composite theory is further extended to include the prediction of dynamic tensile and shear moduli and loss tangent over a
range of k values. Using the previously determined structure coefficients
for each material, the experimentally determined dynamic moduli and tan 6
were compared with the predicted values at -90°C and +20°C. Although agreement with experimental data was not absolute, the approach shows some promise.
The final set of experiments concerned the tearing behaviour of these materials over wide temperature and tearing rate ranges. The data were analysed according to the conventional method originally proposed by
workers at the Natural Rubber Producer's Research Association. It was,
however, noted that this analysis is based on a linear relationship
between the tearing force and the material thickness, whereas the data here appear to support more nearly a square relationship. Using this premise, a relationship is presented between the tearing force and the product of the elastic modulus, energy to break in tension and material thickness squared. The experimental evidence supports this relationship over the complete temperature and rate ranges investigated, and S-B-S block
ACKNOWLEDGEMENTS
The author would like to express his thanks for assistance and advice from Director of Studies, Dr N.C. Hilyard, supervisors Dr G. Corfield and Dr D. Quayle of Sheffield City Polytechnic, and Dr I. Bowman of the
International Synthetic Rubber Company for his contribution as industrial supervisor.
Parts of the chemical characterisation were carried out at the
Universities of Sheffield, Manchester and Akron (USA), for which thanks are due to Dr R.N. Young, Dr C. Price and Dr L.J. Fetters, respectively. The Rubber and Plastics Research Association (RAPRA) also collaborated in respect of characterisation studies.
A special thank you goes to all members of the Sheffield City
Polytechnic technical, secretarial and library staff who have helped in a variety of ways, but particularly to Mr R. Codd for his unstinting
assistance with the electron microscopy.
The author is indebted to the Sheffield Local Education Authority for financing the project in the form of a Research Assistantship.
CONTENTS
Page
Abstract 1
Summary 2
Acknowledgements 4
Contents 5
List of Figures 10
Nomenclature 18
CHAPTER 1: INTRODUCTION 23
CHAPTER 2: LITERATURE SURVEY 26
2.1 The Chemistry of Block Copolymers 26
2.1.1 Synthesis 26
2.1.2 Chemical characterisation 27
2.1.3 Polymeric impurities 29
2.1.4 Thermodynamics of microphase separation 3Q
2.1.5 Summary 33
2.2 The Microstructure of Block Copolymers 34
2.2.1 Introduction 34
2.2.2 Block copolymers under the electron 34
microscope
2.2.3 Small angle X-ray scattering (SAXS) 37
2.2.4 Summary 39
2.3 Mechanical Properties 41
2.3.1 Introduction 41
2.3.2 Dynamic viscoelastic properties 41
2.3.3 Swelling 43
2.3.4 Tensile properties 45
2.3.4.1 Stress-strain characteristics 45
2.3.4.2 The effect of structural 46
modification
2.3.4.3 Relaxation phenomena 47
2.3.4.4 Models of two-phase systems 47
2.4 Tearing of Rubbers 50
2.4.1 Introduction 50
2.4.2 Choice of test-piece shape and analysis 50
2.4.2.1 Trousers test-piece 51
Page
2.4.3 Some problems with the trouser-leg 54
specimen
2.4.4 Qualitative information obtained from 55
tearing - two types of tearing
2.4.5 The effect of filler reinforcement on tear 57
energy
2.4.6 The non-WLF viscosity dependence of SBR 58
(Gum) tear energy
2.4.7 Tearing energy from the strain concentration 58
at an incision
CHAPTER 3: POLYMER CHARACTERISATION 67
3.1 Introduction 67
3.1.1 The triblock copolymer elastomers 67
3.1.2 Parameters investigated and experimental 67
methods used
3.2 Number Average Molecular Weight by Osmotic Pressure 69
3.3 Gel Permeation Chromatography for Molecular Weight, 71
Polydispersity and Polymeric Impurity
3.3.1 The GPC tests 73
3.3.2 Analysis of chromatograms 74
3.3.2.1 M 9 M and polydispersity 74
3.3.2.2 Proportions of triblock, diblock 74
and homopolymer
3.3.3 Discussion 77
3.4 Copolymer Composition and Structure by ’H NMR 80
3.4.1 The NMR phenomenon 80
3.4.2 Analysis of NMR spectra 80
3.4.3 The NMR spectra 81
3.4.4 Data derived from NMR spectra 83
3.4.5 Discussion 86
3.5 Network Parameters by Microswelling 87
3.5.1 The swelling experiment 87
3.5.2 Analysis of swelling data 88
3.5.3 Discussion 91
3.6 The Plasticiser 93
CHAPTER 4: MATERIAL MORPHOLOGY 115
Page
4.2 Polymer Sheet Preparation 115
4.3 Preparation of Specimens for Electron Microscopy 116
4.4 The Electron Micrographs 117
4.4.1 Analysis of domain parameters 117
4.5 Small Angle X-Ray Scattering Measurements (SAXS) 123
4.5.1 Introduction 123
4.5.2 Experimental 124
4.5.3 Results of SAXS 124
4.6 Discussion 126
CHAPTER 5: SMALL STRAIN DYNAMIC PROPERTIES 137
5.1 Introduction 137
5.2 The Torsion Pendulum 137
5.2.1 Description of equipment and testing 137
procedure
5.2.2 Analysis 139
5.2.3 Experimental results 141
5.3 The Rheovibron 144
5.3.1 Description of equipment and testing 144
procedure
5.3.2 Experimental results for small strain 145
dynamic tensile modulus and loss tangent
5.4 Discussion of Dynamic Mechanical Results 146
CHAPTER 6: LARGE STRAIN TENSILE BEHAVIOUR 170
6.1 Introduction 170
6.2 Analysis 173
6.2.1 The simple kinetic theory 173
6.2.2 The inverse Langevin function 173
6.2.3 Mathematical model for tensile response 174
6.3 Discussion 180
CHAPTER 7: THE ELASTIC MODULUS OF BLOCK COPOLYMERS 204
7.1 Introduction 204
7.2 The Nielsen Equations 207
7.3 The Initial Static Tensile Moduli: Results and 210
Discussion
7.3.1 Series-parallel model 210
Page
7.4 A Theoretical Analysis for the Dynamic Moduli 216
7.5 The Prediction of Dynamic Moduli: Results and 220
Discussion
CHAPTER 8: THE TEARING BEHAVIOUR OF THERMOPLASTIC ELASTOMERS 233
8.1 The Classical Analysis and Related Experimentation 233
8.1.1 Introduction 233
8.1.2 The modified trousers tear specimen 234
8.1.3 Environmental chamber and temperature 235
control equipment
8.1.4 The testing programme 235
8.1.5 Test procedure 236
8.1.6 Testing the tear criterion 237
8.1.7 Tearing energy/rate/temperature surfaces 237
8.1.8 Detailed analysis of tear data 238
8.1.9 The effect of temperature and rate 238
8.1.10 The effect of casting solvent 239
8.1.11 Comparing TR1101 and TR1102 241
8.1.12 A comparison of the tear behaviour of 242
thermoplastic elastomers with other rubbery materials
8.1.13 Discussion 243
8.2 An Alternative Correlation 246
8.2.1 Introduction 246
8.2.2 Theoretical 246
8.2.3 Energy density at break, P/p* 247
8.2.4 Elasticity modulus, E 248
8.2.5 The relationship between tearing force and 248
thickness
8.2.6 The relationship between tearing force and 250
tensile data
8.2.7 Discussion 250
CHAPTER 9: FINAL DISCUSSION AND CONCLUSIONS 295
References 299
Appendix A Tearing energy/temperature/rate surfaces A1
Page
Appendix C Tearing energy/rate curves for TR1102 Cl
Appendix D Tearing energy/rate curves comparing TR1101 and 1102 D1
Appendix E Tearing force as a function of the tensile parameter El
Page '60 61 62 63 64 65 66 94 95 96 97 98 99 100 101 102 103 104 105 106 107 108 109 110 111 112 113 114 LIST OF FIGURES
: ABA copolymer chain molecule
: Effect of polystyrene content on idealised micro structure for SBS block copolymers
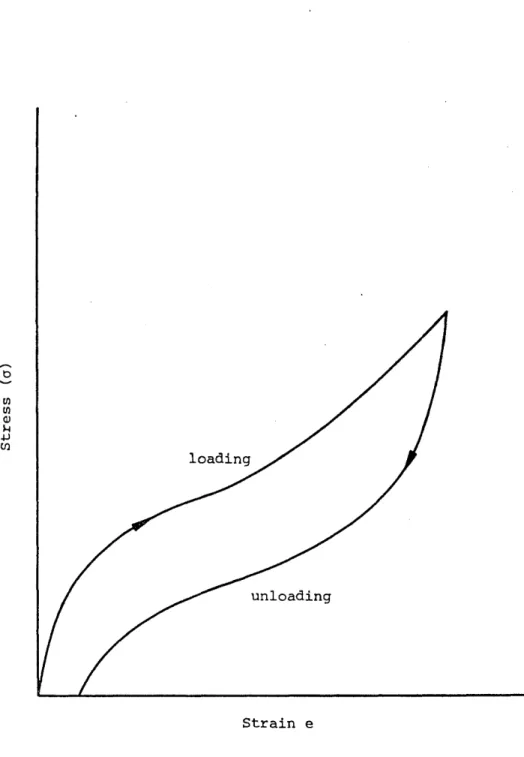
: Schematic of stress cycling hysteresis
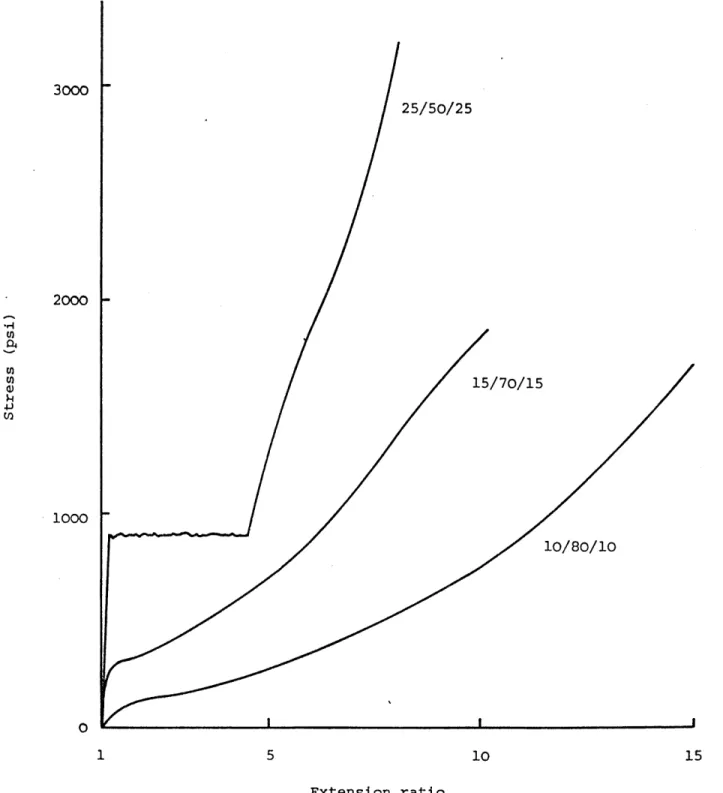
: Effect of styrene content on the stress-strain curve
: Trousers and plane strain tearing specimen : Three-dimensional of tearing energy versus
temperature and rate for NR and SBR : Strain concentration at an incision
: Membrane osmometry, v/C versus C
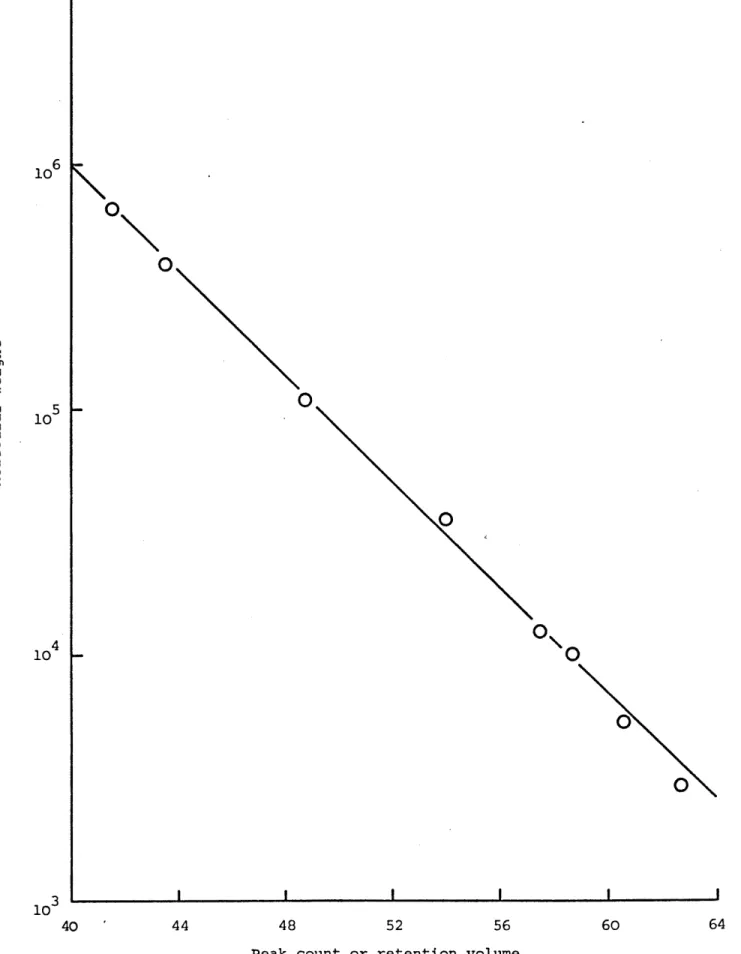
: Gel material in a section of GPC column : Calibration for GPC
: Calibration for GPC
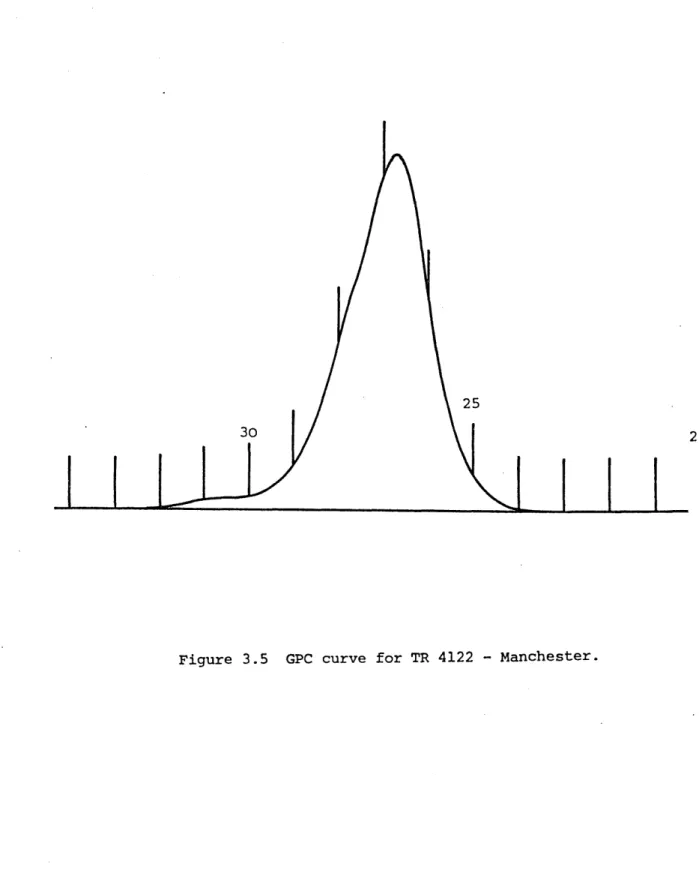
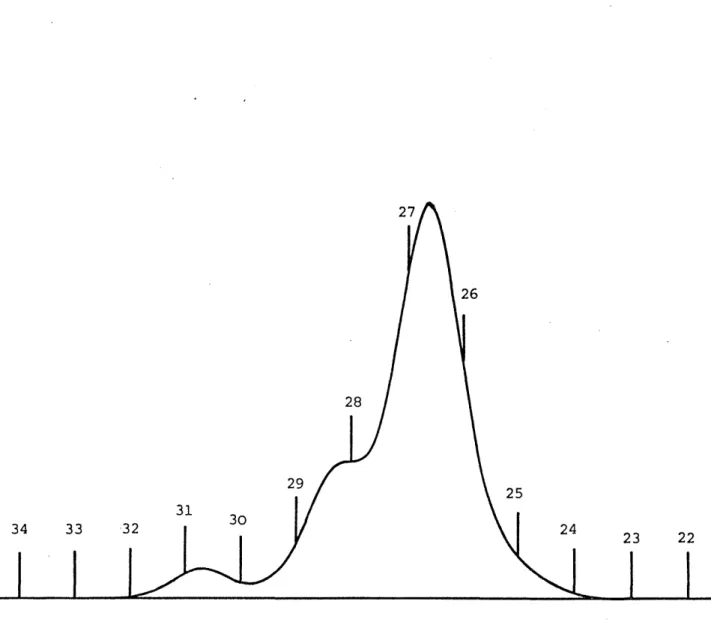
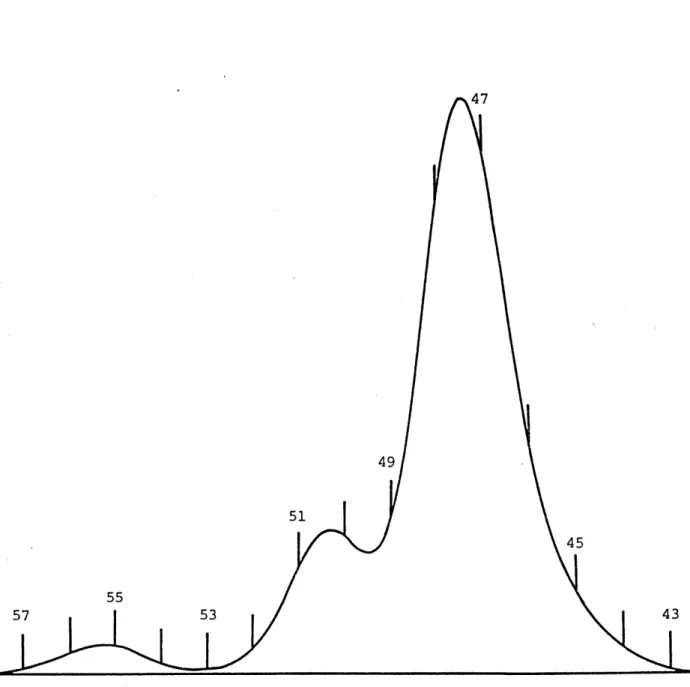
: GPC chromatogram for TR4122 : GPC chromatogram for TR4122 : GPC chromatogram for TR4122 : GPC chromatogram for TR4122
: NMR spectrum at 60 MHz for TR1101 : NMR spectrum at 60 MHz for TR1102 : NMR spectrum at 60 MHz for TR4122 : NMR spectrum at 60 MHz for TR4113
: NMR spectrum at 60 MHz for TR4113 deplasticised : NMR spectrum at 100 MHz for TR1101
: NMR spectrum at 300 MHz for TR1101
: NMR spectrum expanding the 1,4 aliphatic protons for TR1101
: NMR spectrum expanding the 1,4 olefinic protons for TR1101
: NMR spectrum spin-decoupled for TR1101 : The swelling experiment
: Swelling data for triblocks swelling as a function of time
Page
Chapter 4
Figure 4.1 The sledge microtome 130
Figure 4.2 Micrograph TR1101 BEN/HEP 131
Figure 4.3 Micrograph TR1102 BEN/HEP 131
Figure 4.4 Micrograph TR4122 BEN/HEP 131
Figure 4.5 Micrograph TR4113 BEN/HEP 131
Figure 4.6 Micrograph TR1101
cci
4
132Figure 4.7 Micrograph TR1102
cci
4
132Figure 4.8 Micrograph TR4122
cci
4
132Figure 4.9 Micrograph TR4113
cci
4
132Figure 4.10 Micrograph TR1101 THF/MEK 133
Figure 4.11 Micrograph TR1101 THF/MEK 133
Figure 4.12 Micrograph TR1102 THF/MEK 133
Figure 4.13 Micrograph TR4122 THF/MEK 133
Figure 4.14 Micrograph TR4113 THF/MEK 134
Figure 4.15 Micrograph TR1101 Ethyl acetate 134
Figure 4.16 Micrograph TR1102 Ethyl acetate 134
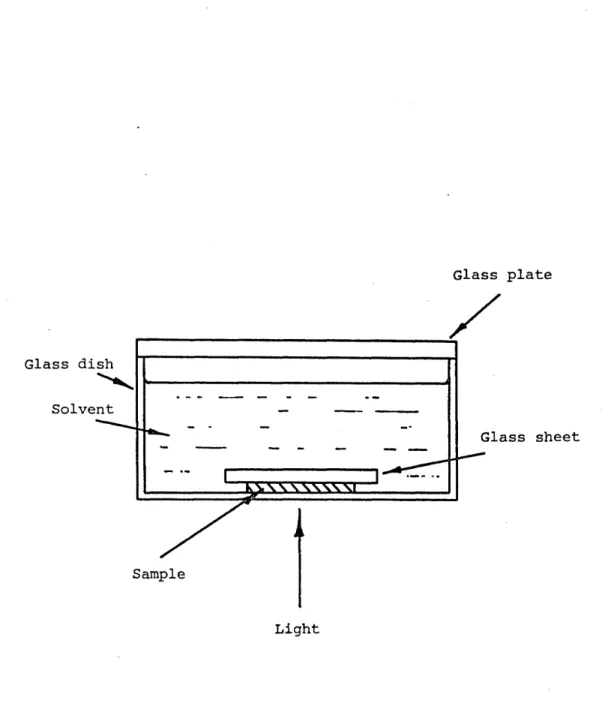
Figure 4.17 The X-ray scattering pin-hole camera 135
Figure 4.18 SAXS photograph for TR1101 THF/MEK and 136
TR1102 CC14
Chapter 5
Figure 5.1 The torsion pendulum 152
Figure 5.2 The torsion pendulum 153
Figure 5.3 G' as a function of temperature at 1 Hz for TR1101 154
Figure 5.4 G' as a function of temperature at 1 Hz for TR1102 155
Figure 5.5 Tan 6 at 1 Hz for TR1101 156
Figure 5.6 Tan 6 at 1 Hz for TR1102 157
Figure 5.7 The Rheovibron 158
Figure 5.8 Tan 6 at 11 Hz for TR1101 159
Figure 5.9 Tan 6 at 11 Hz for TR1102 160
Figure 5.10 Tan 6 at 11 Hz for TR4122 161
Figure 5.11 Tan 6 at 11 Hz for TR4113 162
Figure 5.12 E' at 11 Hz for TR1101 163
Figure 5.13 E ’ at 11 Hz for TR1102 164
Figure 5.14 at 11 Hz for TR4122 165
Figure 5.15 E* at 11 Hz for TR4113 166
Page
Figure 5.17 : The ratio E'/G1 as a function of temperature
for TR1101
Figure 5.18 : The ratio E t/ G t as a function of temperature for TR1102
168
169
Chapter 6 Figure 6.1 Figure 6.2
Figure 6.3
Figure 6.4
Figure 6.5
Figure 6.6
Figure 6.7 Figure 6.8 Figure 6.9 Figure 6.10 Figure 6.11 Figure 6.12 Figure 6.13 Figure 6.14 Figure 6.15 Figure 6.16 Figure 6.17 Figure 6.18 Figure 6.19 Figure 6.20 Figure 6.21 Figure 6.22
The dumbell tensile specimen
Tensile stress-strain curves for TR1101 and TR1102
Tensile stress-strain curves for TR1101 and TR1102
Tensile stress-strain curves for TR4122 and TR4113
Tensile stress-strain curves for TR4122 and TR4113
Stress as a function of strain (simple kinetic theory)
Stress as a function of strain using Langevin Schematic of stress versus strain
True stress as a function of strain for TR1102
The debonding factor as a function of strain
Log (- log Bj) as a function of strain for TR1101 Log (-logS^) as a function of strain for TR1102 Log (- log Bg) as a function of strain' for TR4122
Log (-log B as a function of strain for TR4113
Initial modulus as a function of exponent £>£ Rubbery modulus as a function of exponent £>£
Initial modulus as a function of the strain intersection of the exponents bj and
Equilibrium swelling strain as a function of styrene content
M as a function of styrene content
Maximum extension ratio X_ as a function of m Mc
Styrene content as a function of maximum extension ratio X
m
Equilibrium swelling strain as a function of predicted maximum tensile strain
Page
Chapter 7
Figure 7.1 : The parallel/series model of Takayanagi 222
Figure 7.2 : Arrangement of ribbons in the Halpin-Tsai theory 223
Figure 7.3 : Arrangement of ribbons and their dimensions in the 224
Halpin-Tsai theory
Figure 7.4 : Effect of composition on modulus after Nielsen 225
Figure 7.5 : The effect of packing fraction on predicted static 226
tensile modulus
Figure 7.6 : The determination of k from predicted modulus 227
and 7.7 curves TR1101 and TR1102 228
Figure 7.8 : Comparison of predicted and experimental dynamic 229
and 7.9 data at -90°C 230
Figure 7.10 : Comparison of predicted and experimental dynamic 231
and 7.11 data at +20°C 232
Chapter 8
Figure 8.1 : Specimen cutting jig for trousers tear test piece 252
Figure 8.2 : The environmental chamber 253
Figure 8.3 : Instron and ancilliary equipment for tear testing 254
Figure 8.4 : Tear test piece dimensions 255
Figure 8.5 : Instron and tear test specimen 256
Figure 8.6 : Tearing force as a function of crosshead movement 257
Figure 8.7 : Tearing load as a function of specimen thickness 258
for TR1101
Figure 8.8 : Three-dimensional tearing surface for TR1101 THF/MEK 259
Figure 8.9 : Three-dimensional tearing surface for TR1101 BEN/HEP 260
Figure 8.10 : Three-dimensional tearing surface for TR1101 CCl^ 261
Figure 8.11 : Tearing energy as a function of rate for 262
TR1101 THF/MEK
Figure 8.12 : Tearing energy as a function of rate for 263
TR1101 CC14
Figure 8.13 : Tearing energy as a function of rate for 264
TR1101 BEN/HEP
Figure 8.14 : Tearing energy as a function of rate for TR1101 265
comparing solvent effects
Figure 8.15 : Tearing energy as a function of rate for TR1101 266
comparing solvent effects
Figure 8.16 : Tearing energy as a function of rate for TR1101 267
Page
Figure 8.17 :: Tearing energy as a function of rate for TR1101 comparing solvent effects
268
Figure 8.18 ;: Tearing energy as a function of rate comparing TR1101 and TR1102 THF/MEK
269
Figure 8.19 :: Tearing energy as a function of rate comparing TR1101 and TR1102 THF/MEK
270
Figure 8.20 :: Tearing energy as a function of rate comparing
TR1101 and TR1102 THF/MEK
271
Figure 8.21 :: Tearing energy as a function of rate comparing
TR1101 and TR1102 THF/MEK
272
Figure 8.22 :: Tearing energy versus rate for several rubbery
materials
273
Figure 8.23 :: Tearing energy versus rate for several rubbery materials
274
Figure 8.24 :: Tearing energy versus rate for several rubbery materials
275
Figure 8.25 :: Tearing strength as a function of dynamic modulus 276
Figure 8.26 :: Tearing strength as a function of dynamic modulus 277
Figure 8.27 :: Tearing strength as a function of dynamic modulus 278
Figure 8.28 :: Energy density F/p* as a function of temperature for TR1101
279
Figure 8.29 :: Tearing force as a function of material thickness at +20°C
280
Figure 8.30 :: Tearing force as a function of material thickness at -40°C
281
Figure 8.31 :: Tearing force as a function of material thickness at +40°C
282
Figure 8.32 :: Tearing force as a function of material thickness at -80°C
283
Figure 8.33 :: Tearing force as a function of material thickness at +20°C
284
Figure 8.34 :: Tearing force as a function of tensile properties for TR1101 at 0.1 cm/min
285
Figure 8.35 :: Tearing force as a function of tensile properties for TR1101 at 0.5 cm/min
286
Figure 8.36 :: Tearing force as a function of tensile properties for TR1101 at 10 cm/min
287
Figure 8.37 :: Tearing force as a function of tensile properties for TR1101 at 50 cm/min
Page
Figure 8.38 : Figure 8.39 :
Figure 8.40 :
Figure 8.41 :
Figure 8.42 :
Figure 8.43 :
Appendix A Figure A.l : Figure A.2 : Figure A.3 : Figure A.4 : Figure A.5 : Figure A.6 :
Figure A.7 :
Figure A.8 : Figure A.9 :
Appendix B Figure B.l :
Figure B.2 :
Figure B.3 :
Figure B.4 :
Figure B.5 :
Figure B.6 :
Figure B.7 :
Histogram of measured force about predicted force 289
Tearing force as a function of for a number of materials Tearing force as a function of for TR1101 at 0.1 cm/min
Tearing force as a function of for TR1101 at 0.5 cm/min
Tearing force as a function of for TR1101 at 10 cm/min
Tearing force as a function of for TR1101 at 50 cm/min
Tear energy surface for TR1102 Tear energy surface for TR1102 Tear energy surface for TR1102 Tear energy surface for TR4122 Tear energy surface for TR4122 Tear energy surface for TR4122 Tear energy surface for TR4113 Tear energy surface for TR4113 Tear energy surface for TR4113
tensile properties 290
tensile properties 291
tensile properties 292
tensile properties 293
tensile properties 294
THF/MEK A2
BEN/HEP A3
CCl^ A4
THF/MEK A5
BEN/HEP A6
CC14 A7
THF/MEK A8
BEN/HEP A9
CC14 A10
Tearing energy as a function TR4122 THF/MEK
Tearing energy as a function TR4122 CC14
Tearing energy as a function TR4122 BEN/HEP
Tearing energy as a function TR4113 THF/MEK
Tearing energy as a function TR4113 CC14
Tearing energy as a function TR4113 BEN/HEP
Tearing energy as a function TR1102 THF/MEK
of rate for B2
of rate for B3
of rate for B4
of rate for B5
of rate for B6
of rate for B7
Page
Figure B.8
Figure B.9 Appendix C Figure C.l Figure C.2 Figure C.3 Figure C.4 Appendix D Figure D.l Figure D.2 Figure D.3 Figure D.4 Figure D.5
Figure D.6
r Figure D.7
Figure D.8
Appendix E Figure E.l
Figure E.2
Tearing energy as a function TR1102 CC1,4
Tearing energy as a function TR1102 BEN/HEP
Tearing energy as a function all solvents
Tearing energy as a function all solvents
Tearing energy as a function all solvents
Tearing energy as a function all solvents
Tearing energy as a function TR1101 and TR1102 CC1^
Tearing energy as a function TR1101 and TR1102 CC1.4
Tearing energy as a function TR1101 and TR1102 CC1,4
Tearing energy as a function TR1101 and TR1102 CC1,4
Tearing energy as a function TR1101 and TR1102 BEN/HEP Tearing energy as a function TR1101 and TR1102 BEN/HEP Tearing energy as a function TR1101 and TR1102 BEN/HEP Tearing energy as a function TR1101 and TR1102 BEN/HEP
of rate for B9
of rate for BIO
of rate for TR1102, C2
of rate for TR1102, C3
of rate for TR1102, C4 ‘
of rate for TR1102, C5
of rate comparing D2
of rate comparing D3
of rate comparing D4
of rate comparing D5
of rate comparing D6
of rate.comparing D7
of rate comparing D8
of rate comparing D9
Tearing force as a function of tensile properties E2
for TR1102 at 0.1 cm/min
Tearing force as a function of tensile properties E3
Page
Figure
Figure
Figure
Figure
Figure
Figure
Figure
Figure
Figure
Figure
2.3 : Tearing force as a function of tensile properties E4
for TR1102 at 10 cm/min
2.4 : Tearing force as a function of tensile properties E5
for TR1102 at 50 cm/min
2.5 : Tearing force as a function of tensile properties E6
for'TR4122 at 0.1 cm/min
2.6 : Tearing force as a function of tensile properties E7
for TR4122 at 0.5 cm/min
2.7 : Tearing force as a function of tensile properties E8
for TR4122 at 10 cm/min
2.8 : Tearing force as a function of tensile properties E9
for TR4122 at 50 cm/min
2.9 : Tearing force as a function of tensile properties E10
for TR4113 at 0.1 cm/min
2.10 : Tearing force as a function of tensile properties Ell
for TR4113 at 0.5 cm/min
2.11 : Tearing force as a function of tensile properties E12
for TR4113 at 10 cm/min
2.12 : Tearing force as a function of tensile properties E13
NOMENCLATURE
: constants dependent upon the geometry in composite systems
: area of aromatic protons on NMR curve unstrained area of specimen
: diblock copolymer : triblock copolymer
: width of reinforcement in composite system : exponent in Mark-Houwink equation
: constants dependent upon geometry and moduli of component phases in composite system
area of other than aromatic protons on NMR curve debonding parameter
benzene
width of specimen
thickness of reinforcement in composite system
exponents describing the dimensionality of crack growth solution concentration
carbon tetrachloride crack length
instantaneous crack length a constant
instantaneous diameter of swollen specimen initial diameter of swelling specimen equilibrium swelling fraction
microstructural dimension, e.g. sphere diameter thickness of specimen
tear tip diameter interdomain distance tensile modulus
initial tensile modulus
tensile modulus of interfacial phase terminal modulus (from Kaelble) terminal modulus (from Langevin) tensile modulus of composite matrix
tensile modulus of composite reinforcement
tensile modulus in direction of reinforcement orientation tensile storage modulus
: tensile complex modulus
: energy stored elastically per unit volume at edge of cut at angular distance 0 from the centre of a semi circular hole
: energy stored to break per unit volume of material : energy absorbed by nuclei in NMR
: ethyl acetate
: force on legs of tear specimen : cumulative survival function
: functionality of network crosslinks : shear modulus
: dynamic shear modulus
: complex shear modulus of composite
: complex shear modulus of butadiene phase : complex shear modulus of styrene phase
: complex upper bound shear modulus of composite : complex lower bound shear modulus of composite : storage shear modulus of butadiene phase
: loss shear modulus of butadiene phase : storage shear modulus of styrene phase : loss shear modulus of styrene phase : storage shear modulus of composite : loss shear modulus of composite
: upper bound storage modulus of composite : upper bound loss modulus of composite : lower bound storage modulus of composite : lower bound loss modulus of composite : fracture toughness
: Gibbs free energy difference : gel permeation chromatography : generalised flaw growth rate
: growth rate of crack in x,y,z directions : parameter dependent upon b/d ratio
: enthalpy change of mixing : heptane
: GPC curve to base line height : magnetic field in NMR
: Planck’s constant : moment of inertia
strain invariants
a constant in the Mark-Houwink equation a constant
a constant
Einstein coefficient specimen length
fixed crack dimensions in y and z directions
width of plastic zone at crack tip
distance ahead of crack tip at which stress reduces to zero
modulus of composite
modulus of butadiene phase modulus of styrene phase
complex modulus of butadiene phase complex modulus of styrene phase upper bound modulus of composite lower bound modulus of composite number-average molecular weight weight-average molecular weight dispersity ratio of molecular weight viscosity-average molecular weight
network molecular weight or molecular weight between entanglements in elastomer homopolymer
calibrated molecular weight in GPC methyl ethyl ketone
weight of styrene sample
weight fraction of styrene in block copolymer mass of added weights on torsion bar
constant with dimensions of length natural rubber
nuclear magnetic resonance
number of links in statistical chain order of SAXS maxima
osmium tetroxide
period of torsion pendulum
period of torsion pendulum without a sample load
tear propagation rate ideal gas constant radius
SBS : triblock copolymer of styrene-butadiene-styrene
SIS : triblock copolymer of styrene-isoprene-styrene
SBR : styrene-butadiene rubber
SAXS : small angle X-ray scattering
T : temperature
TQ : critical tearing energy
TB : temperature relating to tan 5 maximum for diene phase
TS : temperature relating to tan 6 maximum for styrene phase
T
1R : temperature at which a rapid decrease in modulus occurs
Tg : glass transition temperature
THF : tetra hydrofuran
TMS : tetra methylsilane
t : material thickness
tan 6 : loss factor in dynamic measurements
tan 6^, tan 6^ : loss tangent relating to torsion pendulum measurements
tan : upper bound loss factor
tan : lower bound loss factor
: total molar volume of block copolymer system : molar volumes of homopolymers
VR : retention volume
W : volume fraction of styrene in block copolymer
V : rate of extension approaching the crack tip
vo : frequency of resonant radio-frequency field in NMR
Ve : concentration of elastically effective chains
Vr : molar fraction of rubber in swollen network
Vs : molar volume of solvent
vro : true volume fraction of rubber in swollen network
Vd : defect volume
vd (t) : instantaneous defect volume
w : elastically stored free energy of deformation
Wo : energy stored elastically per unit volume of material
: area under stress-strain curve
WLF : Williams-Landel-Ferry equation for time-temperature
superposition
W : width of sheet specimen
h : weight fraction of polystyrene
Greek Symbols
a, 3, y : temperature dependent transitions
: solubility parameters of homopolymers A and B : polymer-solvent interaction parameter
: polymer-polymer interaction parameter : extension ratios
: extension ratio at crack tip
: theoretical maximum extension ratio : extension ratio at break
: wavelength of radiation : osmotic pressure
: intrinsic viscosity : hydrodynamic volume : magnetic moment : density of styrene : density of butadiene : logarithmic decrement : scattering angle : stress
: strain
: reduced concentration term dependent upon : as ^ but for inverted composite system : Poisson’s ratio
styrene volume fractions for lamellar, rod-like and spherical structures
: volume fraction of butadiene : volume fraction of styrene
: volumetric packing fraction in normal system : volumetric packing fraction in inverted system : fraction of styrene in continuous phase which is
actually continuous
CHAPTER 1 INTRODUCTION
In recent years, there has been considerable interest and research effort in the field of heterophase polymer systems possessing improved physical properties in the elastomeric state. With their enhanced
properties, these systems comprise an integral and increasingly important section of the engineering materials presently available; and the
technology offers the possibility of designing materials to perform given functions under specific conditions.
The search for novel elastomeric solids led to the eventual discovery of the class of materials known as thermolastic elastomers. At ambient temperatures, these materials exhibit properties similar to those of vulcanised rubber, but whereas the product of vulcanisation is a thermo setting rubber, thermolastic elastomers may be remoulded at elevated temperatures as thermoplastic materials. It is quite normal for these materials to have tensile strengths in excess of 30 x 106 Nm“2 and fracture elongations of greater than 1000 per cent at temperatures of about 20°C.
This unusual combination of properties is a reflection of the chain structure of the block copolymer. A relatively simple block polymer may be defined as a macromolecule composed of alternating segments, or blocks,
of two essentially pure homopolymers. If A and B represent the two
component homopolymers, then possible configurations include AB, ABA, BAB, ABAB and so on.
The particular class of materials of interest here are those where the component blocks are polystyrene (S) and polybutadiene (B), the limit of use being the softening point of the polystyrene domains, above which
they become thermoplastic and flow. In addition, the polybutadiene blocks
are unsaturated and must be protected from oxidation. Polybutadiene
material, such as titanium dioxide, or a light absorbing material, such as carbon black, gives improved stability.
The combination of elasticity with solubility and thermoplasticity makes SBS block copolymers useful in the formulation of contact and
pressure-sensitive adhesives, joint sealants, strain relief interlaps and solution adhesives. The polymers themselves are tack-free, but may be
tackified by the use of appropriate resins. SBS copolymer can also be
compounded with other materials, such as inorganic fillers, petroleum oils, asphalts and reactive monomers to develop desirable properties.
Absorption of naphthenic oil imparts improved tack to copolymer/resin blends used as pressure-sensitive adhesives, decreases melt viscosity in hot melt formulations, and plasticises the copolymer to reduce its cohesive strength for caulk and sealants. Dispersed in small proportions in hot asphalts, SBS copolymers give low temperature flexibility and resistance to flow at higher temperatures. At increased proportions, blends with asphalt are extremely tacky and make useful cements.
Elastomeric block copolymers may be fabricated in conventional plastics processing equipment, such as extruders, blow moulders, and injection moulders, and have been used to make a wide variety of moulded
articles. Elastic bands may be prepared by tumble blending the crumb
with antioxidant and anti-blocking agents, followed by tube extrusion and cutting. Various types of shoe soles and heels giving a wide range of hardness and stiffness, coupled with high surface friction, are
manufactured, as is microcellular soling using SBS as the base polymer to give a higher stiffness at equivalent hardness than other elastomers. Numerous products such as baby bottle teats, toy tyres, bath mats and pencil erasers are injection moulded, and blow moulding is used in the manufacture of children’s toys. The material is used in the form of rubber sheeting for the backing of self-laying carpet tiles, and for sound insulation in automobile interiors. Further outlets include pharmaceutical, medical and food packaging applications.
Although many studies of the mechanical behaviour of these materials have been reported in the literature, and some understanding obtained of the relationships between composition, microstructure and properties, little information is currently available concerning the tear strength and the mechanisms involved in the tearing process. Tear phenomena are of
fundamental importance to the mechanical qualities of a material. Even
interrelated. These include the energy required to create new surface, ductile processes, hysteresis and crack propagation mechanisms, all of which may themselves be dependent upon such factors as the environmental
conditions and the rate of crack propagation.
The purpose of this work is to characterise as far as possible a number of SBS block copolymers in terms of composition, microstructure, molecular size, small and large strain quasi-static mechanical properties and small strain dynamic behaviour. The aim being to elucidate the mechanisms involved in the tear process, and to help explain the observed tear behaviour.
In the first part of this thesis, literature pertinent to the chemical, microstructural and molecular characterisation of thermolastic triblock copolymers and their mechanical behaviour is reviewed. The application of these characterisation techniques to the polymers of the present study is then discussed. The techniques employed include nuclear magnetic
resonance, gel permeation chromatography and membrane osmometry. Use of these systems allows the determination of overall molecular weight,
individual block molecular weights, polymeric diblock and homopolymer
impurity, styrene content, and the cis-trans structure of the diene centre-block. This type of analysis is desirable in any work involving the
investigation of mechanical behaviour of polymers, but is essential when the morphology of the system depends upon such chemical properties, as may occur with these materials.
Since it is known that the technique used for sample preparation determines to a large extent the morphology, and hence the mechanical properties of the material, it is demonstrated how, by the use of
different mixtures of casting solvents, these morphologies are achieved. Electron microscopy and small angle X-ray scattering are vehicles used for the determination of particular microstructural formations.
CHAPTER 2 LITERATURE SURVEY
2.1 THE CHEMISTRY OF BLOCK COPOLYMERS 2.1.1 Synthesis
It is only within the last 15 years that complete
characterisation of block copolymers has been possible, primarily due to earlier difficulties in analysis and in the synthesis of pure blocks of uniform molecular weight. A number of books and review papers currently available [1-6] summarise the addition and condensation reactions used in the synthesis of early block copolymer materials of commercial importance. More recently, termination-free homogeneous anionic polymerisation has been developed as a useful technique for the synthesis of block copolymers. It is well documented that this method, which involves initiation by
alkyllithium compounds (dubbed ’living1 polymerisation), produced block polymers with well defined blocks of nearly uniform molecular weight [7-22].
The preparation of ABA type block polymers possessing precise and predictable structures can be achieved by four methods [23], each using soluble organo-alkali metal initiators:
(a) a three-stage process using monofunctional initiators;
(b) using difunctional initiators, for example sodium naphthalene, leading to a two-stage process (that is, polymerisation of monomer B followed by polymerisation of monomer A);
(c) using monofunctional initiators, a two-stage process to synthesise AB diblock polymer with subsequent coupling to AB-BA polymer;
(d) again using monofunctional initiators, a two-stage process involving the formation of an initial A block followed by the copolymerisation of A and B in which the latter is preferentially polymerised. Thus, a ’tapered’ segment of monomers A and B is formed between the middle block and the final A block.
It is important when dienes are used to prepare the centre segment in a styrene-diene-styrene block polymer that the polymerisation be carried out in a hydrocarbon solvent (benzene, for example), since the polydiene microstructure is influenced by the presence of ether type
solvents [23]. Studies [24] of the polyisoprene microstructure have
microstructure from the high cis-1,4 structure obtained in hydrocarbon solvents to that of a chain containing significant amounts of the 1,2 and 3,4 forms of addition. A similar effect is seen for polybutadiene which has the high 1,4 content when prepared in hydrocarbon solvents [25], while ether solvents convert the structure to virtually all the 1,2 type [8].
The structure of an individual polymer chain may be represented in the manner of Figure 2.1. The particular example shown is that of the copolymerisation of butadiene and styrene, for which the most commercially successful systems have a relatively long butadiene segment between two shorter polystyrene segments. Polymers of this type exhibit elastomeric properties without vulcanisation.
2.1.2 Chemical Characterisation
Although the synthesis of block copolymers is a well-publicised field of research [10,18,21,22], it was not until comparatively recently that most researchers began to include appropriate characterisation data
in their published work. It is clear that polymer characterisation is
desirable in order to gain an appreciation of the efficiency of the synthesis procedure used, and to give an assessment of the purity of the material. An equally important point is that without full characterisation as an integral part of any research programme, the comparison of inter laboratory data, whether it be chemical, physical or mechanical, is-hindered.
Dependent upon the particular characterisation technique used, information may be gained about block length, overall molecular weights, polydispersity in molecular weight and composition, and estimates of the percentage and type of chains present [7,8,11,14].
Membrane osmometry gives information on the absolute overall molecular weight of a material and involves the use of various
concentrations of the polymer in a suitable solvent. These solutions are
introduced individually into the sample compartment of the osmometer. Solvent from the instrument side of the membrane diffuses through to the polymer sample, thus creating a pressure. When equilibrium is reached and solvent flow ceases, this osmotic pressure may be related to the number average molecular weight, M' [26-28].
differences in molecular size, and is therefore a potent characterisation tool for commercial block polymers, not only in the measurement of
molecular weight, but also for determining the molecular composition in terms of triblock, diblock and homopolymer.
In the GPC separation, a solution of the polymer is passed through columns containing a separating medium or gel consisting of pores ranging in size from 6 nm to 106 nm average diameter. The gel is
completely immersed in the solvent and when a polymer solution is passed through the column, polymer molecules enter those pores capable of
accommodating them. Consequently, if the columns are packed with gel having a distribution of pore sizes, a separation of the polymer molecules can be effected. Very large molecules have only a small number of pores available to them, and pass through the columns fairly rapidly. Very small molecules enter most of the gel pores and therefore take longer to pass through. The concentration of the species in the solvent stream emerging from the columns is monitored continuously using a suitable detector.
Since the technique is a comparative one, polymers with a narrow molecular weight distribution are required for calibration
purposes. The standards used are anionically prepared polystyrenes with
polydispersity ) ratios of the order 1.06-1.15. Although such
standards may be prepared by individual experimenters, the normal source of such materials is the Pressure Chemical Company, which markets a range of sharp molecular weight fractions.
High resolution nuclear magnetic resonance (NMR) spectroscopy [37-42] has become an important tool in the field of compositional and structural analysis of block copolymers. The technique makes use of the
•f*
magnetic moment possessed by the H proton, and the predictable movement
when a magnetic field is applied. It follows that certain types of proton
usually appear in the same region of the NMR spectrum and may be identified. Another feature which may be observed is the interaction between protons through the bonds joining them, again allowing the identification of the protons giving rise to the excitation. The intensity of the resonance peak is proportional to the number of protons causing the peak, so that analysis of the relative intensities of observed peaks can give important
information on the composition of the material. In addition to providing
an accurate estimate of the weight content of styrene in an SBS copolymer, it is possible, with sufficiently high resolution spectrometers, to
2.1.3 Polymeric Impurities
Polymeric impurities are the result of either termination during polymerisation or incomplete coupling if this procedure is used.' Although small quantities of block polymer may be manufactured under laboratory conditions in order to maintain a narrow distribution of molecular weight and to prevent premature termination or incomplete
coupling, commercially it is not normally possible to control the process sufficiently rigidly to obtain a material which is 100% ABA.
Taking the simplest case where termination is rapid in
comparison to propagation, any terminating impurities cause the formation of homopolystyrene or a styrene-diene diblock (SB) polymer. The effect of these polymeric species on the properties of SDS block polymers has been studied [43] by blending known quantities of the impurity with the pure triblock. It was found that the addition of homopolystyrene had virtually no effect on the tensile strength of the block polymer, although
the stress for a given strain was increased; apparently, the
homopolystyrene located itself in the block polystyrene domains, so that the net result was equivalent to having a polymer with a higher styrene content. The addition of free polydiene decreased the tensile strength and decreased the stress for a given strain, the polydiene serving as a diluent for the block polydiene chains in the network. When the
homopolystyrene differed greatly in molecular weight (Mw ) from the block polystyrene, significant incompatibility was achieved with consequent deterioration of the tensile properties of the material. Here, the term incompatibility refers to the fact that it may be physically impossible for the styrene of higher molecular weight to fit into the domains formed by the lower molecular weight end blocks. The conclusions to be drawn are that the presence of free styrene homopolymer is not harmful to the tensile properties of these block polymers, provided it is of a similar molecular weight to that of the styrene end block. However, the presence of only a few percent of diblock material has a marked effect on the
tensile properties of the triblock copolymer. The diblock material apparently causes network defects by virtue of the fact that the styrene block is absorbed into the glassy domain while the diene block is
2.1.4 Thermodynamics of Microphase Separation
The mixing of two components has associated with it a free-energy of mixing given by the equation:
AG = W - T LS (2.1)
where AH and AS are, respectively, the enthalpy and entropy changes of
mixing, and T is the absolute temperature. If AG is negative, a true molecular solution will form; if it is positive, however, the two components will segregate into separate phases. Although this thermo dynamic analysis is in principle applicable only to reversible or
equilibrium processes, and the mixing of two polymer molecules is not an equilibrium process due to restricted large-scale molecular mobility, the
analysis is still qualitatively useful. The mixing of any two components
is accompanied by an increase in the disorder of the system, and hence, by an increase in entropy (that is, AS > 0), with AS being smaller for two polymer molecules than for the mixing of lower molecular weight materials of equivalent mass [44]. The entropy contribution to the free-energy change is then always favourable to the formation of a molecularly homogeneous system. It follows that the enthalpy, AH, change can be
negative, zero or a small positive number for AG to remain negative. However, when two homopolymers are mixed, A# may be expressed:
" Vv (6A ~ SB)2 VA VB (2'2>
where is the total molar volume of the system, and 6^ and 6^ are
solubility parameters for homopolymers A and B. From equation (2.2), Aff is necessarily positive, and the common result is that the enthalpy term dominates the free-energy expression (equation (2.1)), giving a positive free-energy change for mixing which predicts that it is unlikely that a single homogeneous phase will form when two polymer molecules are mixed.
polymer-polymer interaction parameter, which can be predicted from the properties of the individual homopolymers. By arbitrarily defining that values of Xj2 greater than 10 indicate insolubility, Fedors [45] was
able to predict minimum molecular weights required for immiscibility. In
an SBS block polymer, he predicts the minimum molecular weights to be about 6000 for the butadiene segment, and 2500 each for the styrene segments. Hence, the lowest molecular weight for the SBS system which would guarantee insolubility would be 11,000. Krause [47] considered the entropy change associated with the decrease in total volume available to each polymer block when separation occurs, assuming that there is no volume change on mixing. Complete phase separation with sharp boundaries between phases was assumed so that the only contacts between the blocks were via the covalent bonds linking the A and B blocks. In a further work [48], Krause included a term to represent the decrease in entropy caused by the immobilisation at the interface of the A-B junctions in each copolymer
molecule. Taking AG to be zero, an expression was derived for the
121critical' whlch was used t0 make
predictions about the types of block copolymer that exhibit phase
separation. Some interesting conclusions arose from this treatment:
(a) AS increases as the number of blocks increases in a copolymer
molecule of given length, so that phase separation becomes more difficult.
(b) For constant copolymer composition and the same number of blocks per molecule, phase separation becomes easier as molecular weight increases.
(c) For molecules having the same chain length and the same number of blocks, a copolymer with V. = 0.25 and Vn « 0.75
A D
undergoes phase separation less readily than a copolymer with VA = VB = 0.5.
Meier's [46] argument is similar to that of Krause with the size of the domains fixed by molecular chain dimensions. He predicts that the critical molecular weights for domain formation in the S-B block polymer system would be between 5000 and 10000 for the styrene segment when the polybutadiene block molecular weight is of the order of 50000. Meier cites some observations from Holden et al [49] which tend to verify the prediction. Although insufficient data were available to compute the size of the polystyrene domains, the molecular weight would put an upper limit on the spherical domain radius in that work at about 20 nm.
The arguments of Fedors and Meier have been applied only to spherical domains. However, the phases in block polymers may take shapes other than spheres; for example, layered and cylindrical structures have been observed [16,50,51]. If a similar argument as that used by Meier
[46] to compute approximate spherical domain radii is applied to determine the thickness of lamellar domains, or the radius of cylindrical regions, and one assumes that the domains are essentially pure with little or no phase mixing; then for an ABA copolymer, the absolute maximum thickness of the layer A, or the maximum diameter of the cylinder, would be just twice the fully extended length of the A segment. Other assumptions are implicit in this argument, the density of the layers or cylinders is assumed to be uniform, and more importantly perhaps, the effects of shrinkage during solvent evaporation are ignored. Further work by Soen et al [52] on domain structure in block copolymers cast from solution
points out that isotropic shrinkage is a reasonable assumption for spherical domain structures, but the same assumption would be unreasonable for rod-like or lamellar formations. They conclude that on solvent evaporation, spherical micelles shrink isotropically to form spherical domains of a diameter proportional to the 2/3 power of the molecular weight of the corresponding block segment. Rod-like and lamellar micelles, on the other hand, shrink anisotropically to form rod-like and lamellar domains such that the diameter and thickness of the respective structures are roughly proportional to the | power of the molecular weight of the corresponding block segment.
The incompatibility of two components manifests itself in the
aggregation of like segments into separate phases. In a study of rubber
blends, Corish [53] presents a practical, if not very sophisticated, definition of compatibility which may be applied to block polymers.
Incompatibility being indicated by the presence of two or more transition temperatures, T , approximately equal to the T 1 s of the component polymers.
Q Q
Compatibility of the components being indicated by a single T' intermediate
between the values which represent the components. Using this definition, any method which defines glass transition regions could discern whether a block copolymer was phase-separated or not. Differential thermal analysis
Also, some single-phase systems exhibit multiple transition regions; for example, the a, 3 and y transitions in polystyrene [55,231]
2.1.5 Summary
The materials under consideration are a combination of
polystyrene (S) and a polydiene (B), the polydiene being the inner segment
(My of the order of 5x10**), while the outer segments of styrene have M
of around l x l O 4. When this type of polymer is moulded at a higher temperature than the glass transition (T ) for polystyrene (a practical lower limit for moulding is 150°C [56]), the styrene end blocks soften, diffusing to join other end segments and, being incompatible with the
polydiene, form discrete aggregates when cooled. Similarly, a
three-dimensional lattice structure is formed when the polymer is cast from a solvent. Phase separation occurs since the entropy to be gained by mixing is very small. This is due to the small number of molecules per unit mass involved, simply as a result of their high molecular weight. Therefore, a normally insignificant positive free-energy of interaction is sufficient to overwhelm this small entropy of mixing. It follows that two polymers do not have to be very dissimilar before they are incompatible leading to a two-phase mixture. Taking the example of SBS polymers, a low styrene content will yield styrene as the discrete phase, uniformly distributed in the continuous butadiene phase. However, at intermediate proportions of styrene, either styrene or butadiene may be the discrete phase, and at high proportions of styrene it may be continuous. A good balance of thermoplastic and elastomeric properties is obtained when the
styrene phase is discrete and the butadiene phase is continuous. This is
normally obtained at between 15% and 40% by weight of styrene [57]. By the use of a combination of testing techniques, the block copolymer may be chemically characterised to determine overall molecular weight, polydispersity, the molecular weight of individual blocks, the magnitude of any polymeric impurities, the composition and chemical
structure of the polymer. Used in concert with one another, the techniques available may yield information pertaining not only to the polymer itself, but also to its method of preparation.