Nonlinear statistical modeling and model discovery for cardiorespiratory data
D. G. Luchinsky,1,2,3M. M. Millonas,2V. N. Smelyanskiy,2A. Pershakova,3A. Stefanovska,3,4and P. V. E. McClintock3 1Newstead Mission Critical Technologies, Inc., 9100 Wilshire Boulevard, Suite 540, East Beverly Hills,
California 90212-3437, USA 2
NASA Ames Research Center, Mail Stop 269-2, Moffett Field, California 94035, USA 3
Department of Physics, Lancaster University, Lancaster LA1 4YB, UK 4
Faculty of Electrical Engineering, University of Ljubljana, Tržaška 25, 1000 Ljubljana, Slovenia 共Received 12 April 2005; published 19 August 2005兲
We present a Bayesian dynamical inference method for characterizing cardiorespiratory共CR兲dynamics in humans by inverse modeling from blood pressure time-series data. The technique is applicable to a broad range of stochastic dynamical models and can be implemented without severe computational demands. A simple nonlinear dynamical model is found that describes a measured blood pressure time series in the primary frequency band of the CR dynamics. The accuracy of the method is investigated using model-generated data with parameters close to the parameters inferred in the experiment. The connection of the inferred model to a well-known beat-to-beat model of the baroreflex is discussed.
DOI:10.1103/PhysRevE.72.021905 PACS number共s兲: 87.19.Hh, 02.50.Tt, 05.10.Gg, 05.45.Tp
I. INTRODUCTION
Model identification is important for both fundamental and applied research关1–8兴on the human cardiovascular sys-tem共CVS兲. Because of the complexity of CVS dynamics and the multiplicity of its mechanisms, it is inherently difficult or impossible to isolate and study individual response mecha-nisms in the intact organism关9兴. In such cases mathematical models of cardiovascular control that are consistent with the experimental data can provide valuable insight 关10,11兴. Al-tered dynamics of the cardiovascular system is associated with a range of cardiovascular diseases and with increased mortality, and it is hoped that dynamical metrics will provide a means of evaluating autonomic activity and eventually form the basis for diagnostic tests for many conditions
关12–16兴.
Notwithstanding that most cardiovascular controls are de-monstrably nonlinear关8,10,13,17–20兴 and are perturbed by stochastic inputs 关8,21,22兴, assumptions of model linearity
关1,3–6,23,24兴 and/or determinism关10,17兴are often made in an attempt to facilitate progress in cardiovascular system identification. Such choices are often influenced more by the ready availability of particular statistical tools and method-ologies than by biophysical or medical considerations. It is therefore highly desirable to develop reliable methods of sys-tem identification that are free of such limitations and are capable of treating more realistic models. The latter could be used to relate difficult-to-access parameters to noninvasively measured data关11兴.
Thus, although a number of numerical schemes have been proposed recently to deal with different aspects of the in-verse problem using linear approximations 关1,5,25,26兴, or estimation of either the strength of some of the nonlinear terms 关27,28兴 or the directionality of coupling 关29–31兴, in-verse cardiovascular problems remain difficult because of the complexity and nonlinearity of the cardiovascular interac-tions. The stochasticity of many dynamical inputs to the sys-tem presents an additional complication. The problem of nonlinear cardiovascular system identification has been
ad-dressed in a number of publications关7,8,32–35兴. Nonlineari-ties generally require the use of more complex and involved numerical techniques 关36–42兴, while the presence of dy-namical noise in continuous systems can introduce system-atic errors in the estimation of the model parameters关43,44兴. Analogous difficulties arise in a broad range of scientific disciplines, including problems in lasers关45兴and molecular motors 关46兴, in epidemiology 关47兴, and in coupled matter-radiation systems in astrophysics 关48兴. An obstacle to progress in these fields is the lack of general methods of dynamical inference for stochastic nonlinear systems. Ac-cordingly, the methods described in this paper should be of broad interdisciplinary interest.
Following a short report published elsewhere 关49兴, we now provide a full description of our method, applying it to the analysis of cardiorespiratory dynamics and doing so within a general nonlinear Bayesian framework for the infer-ence of stochastic dynamical systems关44兴. The basic meth-odology is described in Sec. II. The Bayesian inference scheme is outlined in Sec. III, and the technique is applied to the analysis of a univariate blood pressure共BP兲time-series in Sec. IV. In this way, a simple nonlinear dynamical model based on coupled nonlinear oscillators 关13,50,51兴 is found, able to describe time-series data in the relevant frequency range. In Sec. V, the accuracy of the method is investigated using model time-series data with parameters inferred from the experimental data. The results are considered in Sec. VI including a discussion of the connections between this model and the well-known beat-to-beat model of the baroreflex. Fi-nally, Sec. VII summarizes the conclusions that can be drawn.
II. METHODOLGY
Our methodological framework involves three essential steps:共i兲the input data are prepared;共ii兲a parametrized class of models is chosen, with the hope that one of them may describe the data; and共iii兲the parameters of this model class are inferred from the time-series data.
A. Data
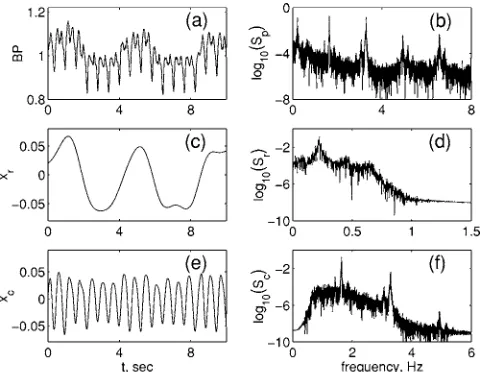
We analyze a particular recording of the central venous blood pressure, a sample of which is shown in Fig. 1共a兲. A feature of this BP time-series is the presence of the two oscillatory components at frequencies approximately
fr⬇0.2 Hz and fc⬇1.7 Hz 共see spectrum of this signal shown in the Fig. 1兲 corresponding, respectively, to respira-tory and cardiac oscillations. The effect of nonlinear terms, including those related to the nonlinear cardiorespiratory in-teraction 共corresponding to the side peaks兲, are clearly evi-dent. We note that the relative intensities and positions of the cardiac and respiratory components vary from subject to sub-ject, with the average frequency of respiration being
⬃0.3 Hz and that of the heart beat being⬃1.1 Hz.
In preprocessing cardiovascular data for model identifica-tion one has to bear in mind that CVS power spectra reflect a variety of complex cardiovascular interactions that give rise to peaks and other features over a broad frequency range
关21,52–54兴. In order to make sense of these multiscale phe-nomena, parametric modeling is usually restricted to a spe-cific part of the power spectrum. It is clear that, in order to model the cardiorespiratory interaction, the frequency range considered must include at least the basic frequencies of car-diac and respiratory oscillationsfcandfrand their combina-tional frequencies. Moreover, as was pointed out earlier
关55,56兴 locally measured blood pressure signals resemble a steady-state oscillation and the sum of the first three harmon-ics contains more then 70% of the total signal variance. Therefore, it is desirable that at least the second and the third
harmonics共see also discussion below兲, besides the basic fre-quencies of the respiratory and cardiac oscillations, are in-cluded in the frequency range of modeling.
B. Models
When one considers modeling the cardiovascular system, one usually envisages the construction of a model based on biophysical principles, one that is capable of generating so-lutions that reproduce, to some degree, the measured data. This approach tackles the forward modeling problem
关10,17,22,57兴. One may also consider theinverse modeling
problem in which models are built specifically to describe measured data关1,3–5,35兴. Both approaches have proven use-ful in the context of cardiovascular research, with the for-ward approach providing valuable insight into the system and its causal relationships, and the inverse approach provid-ing a useful means of intelligent monitorprovid-ing of cardiovascu-lar function in patients.
As a third alternative one may try to bridge the two ap-proaches by building a model that accurately reproduces the experimental observations while at the same time being based on the physiological principles of circulation. In such a case the form of the mathematical model is taken from physiological principles, with its component parts corre-sponding, to a greater or lesser degree, to specific physiologi-cal mechanisms, while the values of some or all of the pa-rameters of the mathematical model are inferred directly from the data. In such a case it is hoped that information with direct physiological significance, more than mere mathemati-cal or statistimathemati-cal characterization, can be inferred from the data.
Many studies have been carried out to explore the physi-ological mechanisms underlying cardiorespiratory interac-tions关58–60兴. Those shown to be involved are the modula-tion of cardiac filling pressure by respiratory movements
关61兴, the direct respiratory modulation of parasympathetic and sympathetic neural activity in the brain stem 关62兴, and the respiratory modulation of baroreceptor feedback control
关63兴. A common feature that these mechanisms is that they are nonlinear, have a dynamical 共or memory兲 component, and are subject to exogenous fluctuations关7,13,50,64–67兴.
A simple beat-to-beat model was introduced by DeBoeret al.关57,68兴 to describe the cardiorespiratory system. The model has further been elaborated recently in关10,11,22兴. In-sight into cardiorespiratory dynamics can also be gained through inverse modeling, treating the cardiac and respira-tory cycles as coupled nonlinear oscillators关13,21,50–52兴. In this approach spectral and synchronization features 关32–34兴 observed in the time-series data are interpreted, physiologi-cally, and related to the model parameters关13兴. However, the model parameters could not be identified directly from the time-series data. Instead, they were deduced on the basis of physiological assumptions and then evaluated through exten-sive computer simulations关21兴.
The simplest model that can reproduce steady-state oscil-lations of the blood pressure signal at two fundamental fre-quencies is a system of two coupled limit cycles on a plane. The Poincaré-Bendixson theory of planar dynamical systems FIG. 1. Data derived from time-series record 24 of the
[image:2.612.54.294.56.242.2]implies that, for a system to have a limit cycle in a simply connected region, the divergence of the vector field must change sign within this region关69兴. We conclude, therefore, that the simplest system that can reproduce the BP signal features considered is a planar one with limit cycles whose vector field contains polynomials of order 3. Accordingly, we model the time-series data as a system of two coupled oscil-lators with vector fields including nonlinearities共as well as those in coupling terms兲up to the third order in the form
x˙r=a1xr+b1yr, y˙r=
兺
i=1 N␣ii共x,y兲+
兺
j=1 21jj, 共1兲
x˙c=a2xc+b2yc, y˙c=
兺
i=1 Nii共x,y兲+
兺
j=1 22jj,
具i共t兲典= 0, 具i共t兲j共t
⬘
兲典=␦ij␦共t−t⬘
兲. 共2兲Here the noise matrix mixes zero-mean white Gaussian noises j共t兲, which are related to the diffusion matrix D =T. The base functions are chosen in the form
=兵1,xr,xc,yr,yc,xr 2
,xc 2
,yr 2
,yc 2
,xryr,xcyc,xr 3
,xc 3
,xr 2
yr,xc 2
yc,xryr 2
,xcyc 2
,yr 3
,yc 3
,xrxc,xr 2
xc,xrxc 2其
. 共3兲
Signalsxrandxccan be directly related to the respiratory and cardiac components of the blood pressure signal shown in the Figs. 1共c兲 and 1共e兲 共see also Sec. IV for a more de-tailed discussion兲. The restrictions imposed on the equations forx˙randx˙cin共1兲and共2兲are determined mainly by the fact that we have to infer four unknown dynamical variables us-ing univariate time-series data共see Sec. III for further de-tails兲. The parametric representation of共1兲and共2兲 covers a wide range of models with limit cycles in the plane. In par-ticular, with appropriate choices of model parameters it can describe either a van der Pol or a FitzHugh-Nagumo共FHN兲 oscillator system, both of which have been widely used in the context of cardiovascular modeling. Furthermore, the choice of the parametric model in the form of 共1兲 and 共2兲 allows one to relate them to physiological parameters char-acterizing the autonomous nervous system 共note discussion in Sec. VI兲. See 关13兴 for an alternative choice and corre-sponding physiological reasoning, taking account of more complex interactions and considering the influence of blood flow and pressure propagation through the closed system of vessels.
C. Parameters
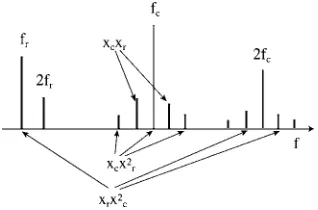
Following the logic of the inverse modeling approach, we must then identify the parametersM=兵a,b,␣,,D其 of the model共1兲and共2兲that reproduce the dynamical and spectral features of the BP signal shown in the Fig. 1. Terms repre-senting nonlinear cardiorespiratory interactions are described by the last three base functions in共3兲. The correspondence of these terms to the experimentally observed combinational frequencies in the BP signal is summarized in the Fig. 2. It can be seen from the figure that the same combinational fre-quencies correspond to the nonlinear coupling terms in both limit-cycle systems in the model. A nonlinear time-series analysis is therefore a requirement for the identification of such a model.
III. BAYESIAN INFERENCE OF STOCHASTIC NONLINEAR DYNAMICAL MODELS
Details of the Bayesian technique can be found elsewhere
关44兴, but, for completeness, we now provide a brief descrip-tion of the main steps of the algorithm.
Stochastic nonlinear dynamical models of the type共1兲and
共2兲can be expressed as a multidimensional nonlinear Lange-vin equation
x˙共t兲=f共x兲+共t兲=f共x兲+共t兲, 共4兲 where共t兲 is an additive stationary white, Gaussian vector noise process characterized by
具共t兲典= 0, 具共t兲T共t
⬘
兲典=Dˆ␦共t−t⬘
兲, 共5兲whereDˆ is a diffusion matrix.
It is assumed that the trajectory x共t兲 of this system is observed at sequential time instants 兵tk;k= 0 , 1 , . . . ,K其 so that the time seriesS=兵sk⬅s共tk兲其thus obtained is related to the 共unknown兲 “true” system states X=兵xk⬅x共tk兲其 through some conditional probability density function 共PDF兲
[image:3.612.358.517.568.673.2]po共S兩X兲.
The a priori expert knowledge about the model param-eters, if any, is summarized in the so-called prior PDF
ppr共M兲. In our case we chose the prior PDF in the form of a zero-mean Gaussian distribution for the model parameters and uniform distributions for the coefficients of the diffusion matrix.
If experimental time-series dataSare available, they can be used to improve the estimation of the model parameters. The improved knowledge of the models parameters is sum-marized in theposteriorconditional PDFppost共M兩S兲, which is related to the prior PDF via Bayes’ theorem
ppost共M兩S兲=
ᐉ共S兩M兲ppr共M兲
冕
ᐉ共S兩M兲ppr共M兲dM. 共6兲
Here,ᐉ共S兩M兲, usually termed the likelihood, is the condi-tional PDF that relates measurements S to the dynamical model. The denominator on the right-hand side of 共6兲 is a normalizing factor. In practice,共6兲can be applied iteratively using a sequence of data blocksS,S
⬘
, etc. The posterior PDF computed from blockSserves as the prior PDF for the next block S⬘
, etc. For a sufficiently large number of observa-tions,ppost共M兩S,S⬘
, . . .兲 becomes sharply peaked at a cer-tain most probable modelM=M*.The main efforts in research on stochastic nonlinear dy-namical inference are focused on construction of the likeli-hood function, which compensates noise-induced errors, and on the introduction of efficient algorithms for optimization of the likelihood function and integration of the normalization factor共cf. 关36,37,43,70兴兲.
In our earlier work关44兴a technique of nonlinear dynami-cal inference of stochastic systems was presented that solves both problems. To avoid extensive numerical methods of op-timization of the likelihood function and integration of the normalization factor, we suggested parametrization of the vector field of共4兲in the form
f共x兲=Uˆ共x兲c⬅f共x;c兲, 共7兲
whereUˆ共x兲is aN⫻M matrix of suitably chosen basis func-tions兵Unm共x兲;n= 1 :N,m= 1 :M其, andcis anM-dimensional coefficient vector. An important feature of共7兲 is that, while possibly highly nonlinear inx,f共x;c兲is strictly linear inc.
The computation of the likelihood function can be cast in the form of a path integral over the random trajectories of the system关71,72兴. Using the uniform sampling scheme intro-duced above we can write the logarithm of the likelihood function in the following form for a sufficiently small time steph共cf. 关71,72兴兲:
− 2
Klogᐉ共y兩M兲
= ln detDˆ + h
K
兺
k=0 K−1关v共yk兲c+共y˙k−Uˆkc兲TDˆ−1共y˙k−Uˆkc兲兴
+Nln共2h兲, 共8兲
which relates the dynamical variablesx共t兲of the system共4兲
to the observations s共t兲. Here, we introduce the following notation:Uˆk⬅Uˆ共yk兲;y˙k⬅h−1共yk+1−yk兲; and vectorv共x兲with components
vm共x兲=
兺
n=1 NUnm共x兲 xn
, m= 1:M.
The vector elements 兵cm其 and the matrix elements 兵Dnn⬘其 together constitute a setM=兵c,Dˆ其 of unknown parameters to be inferred from the measurementsS.
Choosing the prior PDF in the form of Gaussian distribu-tion
ppr共M兲=
冑
det共⌺ˆ
pr −1兲
共2兲M exp
冉
− 1 2共c−cpr兲T⌺ˆ pr −1共c−c
pr兲
冊
共9兲 and substituting ppr共M兲 and the likelihood ᐉ共S兩M兲 into
共6兲 yields the posterior PDF ppost共M兩S兲= const ⫻exp关−L共M兩S兲兴, where
L共M兩S兲 ⬅Ls共c,Dˆ兲= 1
2s共Dˆ兲−c T
ws共Dˆ兲+ 1 2c
T⌶ˆ s共Dˆ兲c.
共10兲 Here, use was made of the definitions
s共Dˆ兲=h
兺
k=0 K−1s
˙kTDˆ−1s˙k+Kln共detDˆ兲, 共11兲
ws共Dˆ兲=⌺ˆpr −1
cpr+h
兺
k=0 K−1冋
Uˆk TDˆ−1s˙k−
v共sk兲
2
册
, 共12兲⌶ˆ
s共Dˆ兲=⌺ˆpr−1+h
兺
k=0 K−1Uˆk T
Dˆ−1Uˆ
k. 共13兲
The mean values of c and Dˆ in the posterior distribution
give the best estimates for the model parameters for a given block of data S of length K and provide the global mini-mum ofLs共c,Dˆ兲. We handle this optimization problem in the following way. Assume for the moment thatc is known in
共10兲. Then the posterior distribution over Dˆ has a mean Dˆpost
⬘
=⌰ˆs共c兲 that provides a minimum of Ss共c,Dˆ兲 with re-spect toDˆ =DˆT. Its matrix elements are⌰ˆ s nn⬘共
c兲 ⬅1
K
兺
k=0 K−1关s˙k−Uˆ共sk兲c兴n关s˙k−Uˆ共yk兲c兴n⬘ T
. 共14兲
Alternatively, assume next that Dˆ is known and note from 共10兲 that in this case the posterior distribution over c is Gaussian. Its covariance is given by ⌶ˆs共Dˆ兲 and the mean
cpost
⬘
minimizesLs共c,Dˆ兲 with respect toccpost
⬘
=⌶ˆs −1共IV. ESTIMATION OF PARAMETERS OF CARDIORESPIRATORY INTERACTION FROM
UNIVARIATE TIME-SERIES DATA
In order to apply algorithm共12兲–共15兲for the identification of the model of nonlinear cardiorespiratory dynamics共1兲and
共2兲from the univariate BP time-series of the type shown in Fig. 1共a兲we have to extract time-series data corresponding to the four dynamical variables in the model. Accordingly, we divide the total spectrum into a low-frequency respiratory componentsr共t兲and high-frequency cardiac componentsc共t兲 as is shown in Figs. 1共c兲and 1共e兲.
A discussion of the physiological relevance of this spec-tral separation can be found in关13,51兴. However, it is per-fectly correct to consider this separation to be a mathematical
ansatz. The filter parameters 共see Fig. 1兲 were chosen to preserve the second and third harmonics of these signals. The two dynamical variables of the model,xr共t兲 andxc共t兲 given by共1兲,共2兲, can be identified with the two-dimensional time series of observationss共t兲=兵sr共t兲,sc共t兲其introduced above and can be interpreted as the contribution to blood pressure from cardiac and respiratory activity. The remaining two dynami-cal variablesy共t兲=兵yr共t兲,yc共t兲其can be related to the observa-tions兵s共tk兲其as follows:
bnyn共tk兲=
sn共tk+h兲−sn共tk兲
h +ansn共tk兲, 共16兲
wheren=r,c. In this way we obtain the velocity of blood pressure changes contributed by the cardiac and respiratory components. The relation共16兲 is a special form of embed-ding. As mentioned above, it allows one to infer a wide class of dynamical models of the cardiorespiratory interactions, including FitzHugh-Nagumo oscillators. The reason that we introduced restrictions on the form of the first equations in
共1兲,共2兲is now clear; it is to reduce the number of embedding parameters that must be selected to minimize the cost 共10兲 and provide the best fit to the measured time series 兵s共tk兲其. The corresponding simplified model of the nonlinear interac-tion between the cardiac and respiratory limit cycles can now be written in a form corresponding to the parametrization
共7兲, as follows:
y˙ =Uˆ共s,y兲c+共t兲, 共17兲 where共t兲 is a two-dimensional Gaussian white noise with correlation matrixDˆ and the matrixUˆ will have the
follow-ing block structure:
Uˆ =
冋
冉
1 00 1
冊
. . .
冉
2 0 0 2冊
. . .
冉
B 0 0 B冊
册
. 共18兲
HereB= 22; thus, there are 22 2⫻2 diagonal blocks formed by the basis functions given in共3兲and the vector of unknown parameterscis of lengthM= 2B.
Finally, the model 共17兲,共18兲 has to be inferred using the method described in Sec. III. A comparison between the time series of the inferred and actual cardiac oscillations is shown in Fig. 3. Similar results are obtained for the respiratory os-cillator, as shown in the Fig. 4. In each case, the level of agreement obtained is encouraging. The nonlinear coupling
parameters and noise intensity of the cardiac oscillations have been estimated to have the following values:20= 2.2, 21= 0.27, 22= −8.67, and 具c
2共t兲典= 8.13. The parameters characterizing coupling of respiratory oscillations to the car-FIG. 3.共Color online兲 共a兲Time series of the cardiac oscillations xc共tn兲=sc共tn兲 in arbitrary units共black line兲obtained from
[image:5.612.317.559.53.242.2]measure-ments of the central venous blood pressure. The sampling rate was 90 Hz after resampling of the original signal. Inferred time series of the cardiac oscillator is shown by the green line.共b兲Power spectra of cardiac oscillations obtained, respectively, from the real data 共black line兲and from the inferred oscillations共green line兲.共c兲Limit cycles of the cardiac oscillationsxc共n兲,yc共n兲obtained, respectively, from real data as described in the text共black line兲and by inference 共green line兲.
FIG. 4. 共Color online兲 共a兲Time series of the respiratory oscilla-tionsxr共tn兲=sr共tn兲in arbitrary units共black line兲obtained from mea-surements of central venous blood pressure. The sampling rate was 90 Hz after resampling of the original signal. Inferred time series of the respiratory oscillator is shown by the green line. 共b兲 Power spectra of the respiratory oscillations obtained, respectively, from the real data共black line兲and from the inferred oscillations 共green line兲.共c兲Limit cycles of the respiratory oscillationsxr共n兲,yr共n兲
[image:5.612.318.559.430.617.2]diac oscillations were estimated as ␣20= 0.12, ␣21= 0.048, ␣22= −0.066, andD11= 0.18. Consistent with expectations, in all experiments the parameters of the nonlinear coupling are more than an order of magnitude higher for the cardiac cillations as compared to their values for the respiratory os-cillations, reflecting the fact that respiration strongly modu-lates cardiac oscillations, while the effect of the cardiac oscillations on respiration is relatively weak.
We have thus shown that this method enables one to si-multaneously infer the relevant coupling strengths and noise parameters directly from a noninvasively measured time se-ries. We view this demonstration of principle as one step toward the practical use of this technique for cardiorespira-tory modeling and its potential for clinical applications. A number of very important physiological and mathematical issues arise in relation to the application of the technique to specific problems, and we hope to address some of these in future publications. Next, however, we consider, explicitly, the problem of estimating the accuracy of the method and initiate a discussion of the connections between the inferred parameters and the indices of autonomous cardiovascular control.
V. VALIDATION OF THE METHOD USING MODEL-GENERATED TIME-SERIES DATA
It is desirable to check the performance of the method on synthesized time-series data obtained by numerically simu-lating the model共1兲,共2兲using parameters inferred from the CVS data. To this end we consider a model-generated signal
x共t兲=xr共t兲+xc共t兲as the time-series data inputs共t兲 for the in-ference. Herexr共t兲,xc共t兲are obtained from numerical simu-lations of the model共1兲,共2兲with parameters inferred from the experimental BP signal described in Sec. IV.
First, we verify that the decomposition of the input signal
s共t兲into low-frequency˜srand high-frequency˜sccomponents allows one to reconstruct the original signal. The decompo-sition is effected using two bandpass Butterworth filters, which were followed by application of the embedding pro-cedure共16兲. In Fig. 5 we compare the velocity of the respi-ratory component of the original signalyr共t兲with the recon-structed velocity˜yr共t兲. The agreement is excellent. Similar results are obtained for the reconstruction of the high-frequency component. We note, in particular, that the noise introduced by embedding can be neglected because it is more
than an order of magnitude smaller then the dynamical noise in the signal.
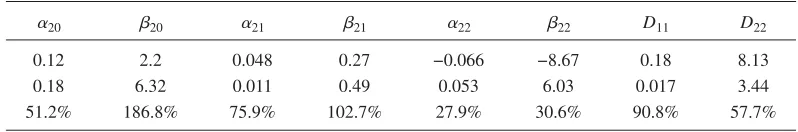
Now we can apply the inference procedure described in Sec. IV to estimate nonlinear coupling parameters of the model from the synthesized univariate time-series data. The results of the estimation are summarized in the Table I. It can be seen from the table that the method allows one to estimate the nonlinear coupling parameter, at least to the correct order of magnitude. For some parameters the estimation accuracy is much better, but in practice the correct values are not known.
Similar results are obtained for the estimation of other parameters of the model. Using parameter values estimated from the univariate model-generated data, one can recon-struct very closely the dynamical and spectral features of the original system as shown in the Fig. 6. The largest estimation errors are for the noise intensity, as shown in the last two columns of Table I. This result can be easily understood in that filtration of the signals has the strongest effect on the noise spectrum of the system. However, the filter-induced errors are systematic and thus can be corrected for based on tests with model-generated data.
[image:6.612.316.557.55.231.2]The main source of error is related to the spectral decom-position of the univariate data, and it is therefore systematic.
TABLE I. Absolute values of the coefficients of nonlinear cardiorespiratory interactions corresponding to the last three base functions in共3兲,兵xrxc,xr
2 xc,xrxc
2其
. The coefficient兵␣i其corresponds to respiration coupling
to the cardiac rhythm. Coefficients兵i其correspond to the cardiac oscillation coupling to respiration. For each set of coefficients the actual values共top row兲are compared to the mean inferred values obtained from 100 nonoverlapped 1000 s blocks of datax共t兲=xr共t兲+xc共t兲. Each block includes 50 000 points with a sampling time of 0.02 s共middle row兲. The estimation error is shown in the bottom line.
␣20 20 ␣21 21 ␣22 22 D11 D22
0.12 2.2 0.048 0.27 −0.066 −8.67 0.18 8.13
0.18 6.32 0.011 0.49 0.053 6.03 0.017 3.44
[image:6.612.105.504.667.733.2]51.2% 186.8% 75.9% 102.7% 27.9% 30.6% 90.8% 57.7%
FIG. 5.共Color online兲 共a兲Velocity of the respiratory oscillations of the original signalyr共t兲 共green line兲 is compared to the signal y
˜r共tk兲 共black dashed line兲 obtained as a result of filtration of s共t兲
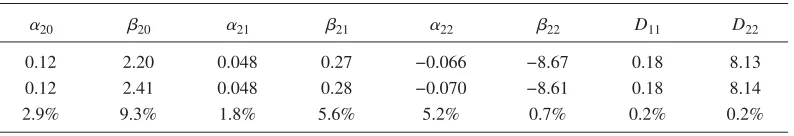
To illustrate this point we use the original synthesized time-series data兵xr共t兲,xc共t兲,yr共t兲,yc共t兲其for two coupled oscillators to infer parameters of the model共1兲,共2兲. The results of infer-ence of the coupling parameters are summarized in Table II. It can be seen that the values of the parameters can be esti-mated with relative error ⬍10%. In particular, the relative error of estimation of the noise intensity is now⬍4%. The accuracy of the estimation can be further improved by in-creasing the total time of observation of the system dynamics as explained in关44兴.
These results should be compared to estimates of either relative strength of some of the nonlinear terms关27兴 or the directionality of coupling关29,30兴 from bivariate time-series data. It becomes clear that our algorithm provides an alter-native effective approach to the analysis of cardiovascular coupling. In particular, the results of this section validate the application of the method to the measured cardiovascular data and demonstrate that it is indeed possible to simulta-neously estimate the strength, directionality, and noise of nonlinear cardiorespiratory coupling form the univariate blood pressure signal.
VI. DISCUSSION
It is important to establish a relationship between the model parameters and physiological parameters of the car-diovascular system. A beat-to-beat model describing the re-lationships between blood pressure and respiration in simple but physiologically meaningful terms is that due to DeBoer
et al.关57,68兴. The DeBoer model incorporates several well-known physiological laws of the cardiorespiratory system based on static relationships. Recent extensions and modifi-cations of this model have included关10,11,22兴. The problem of inverse modeling was not addressed in this earlier work, and it is therefore very desirable to connect it to the approach presented here.
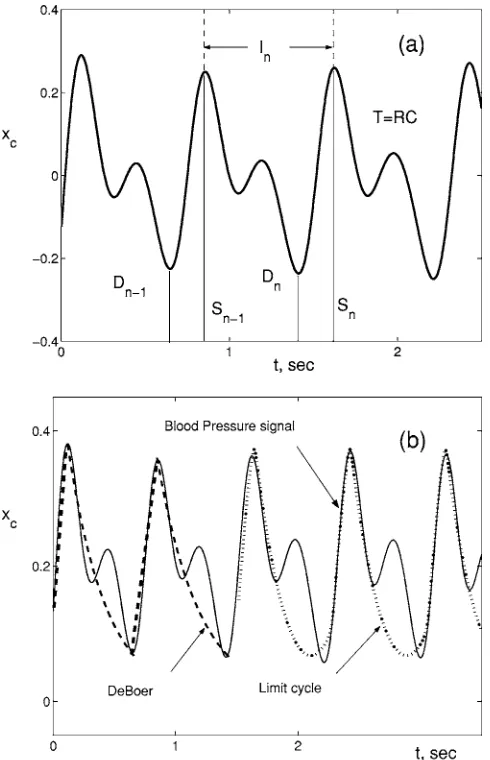
The DeBoer model describes the beat-to-beat evolution of the state variables shown in the Fig. 7共a兲: systolic press-ure 共S兲, diastolic pressure 共D兲, RR intervals 共I兲, and ar-terial decay time 共T=R⫻C= peripheral resistance⫻arterial compliance兲. Following the brief account of the DeBoer model given in关17兴and neglecting for the sake of simplicity variations in the peripheral resistance, we can write the cor-responding set of difference equations as
Di=Si−1exp关共− 2/3兲Ii−1/T兴, 共19兲
Si=Di+␥Ii−1+C1+Asin共2ft兲, 共20兲
Ii=GvSi
⬘
−v+GF共S⬘
,兲+C2. 共21兲HereC1,C2, andC3are constants, and the sigmoidal nature of the baroreceptor sensitivity is accounted for by defining an effective systolic pressure共S
⬘
兲 关57兴Si
⬘
=S0+ 18 arctan共S−S0兲
18 . 共22兲
The first equation共19兲follows from the Windkessel model of the circulation, whereas the second equation共20兲 expresses the contractile properties of the myocardium in accordance with Starling’s law, which takes into account the mechanical effect of circulation on the BP关55,57兴. The last equation共21兲 includes, explicitly, two mechanisms of cardiovascular con-trol defined by their respective gain共G兲and delay共兲:共i兲the fast vagal control of the heart rateGvSi
⬘
−v, and共ii兲the slower -sympathetic control of the heart rate GF共S⬘
,兲. Here [image:7.612.53.293.56.234.2]F共S
⬘
,兲is a linear weighted sum of the form FIG. 6. 共Color online兲 共a兲Synthetically generated cardiac timeseries xc共tn兲 in arbitrary units 共black line兲 obtained from model
共1兲,共2兲, compared to inferred time series of the cardiac oscillator 共green line兲. 共b兲 Power spectrum of the model-generated cardiac oscillations共black line兲compared to that of the inferred oscillations 共green dashed line兲.共c兲Limit cycles of the model-generated respi-ratory oscillationsxc共n兲,yc共n兲 共black line兲and of the inferred
oscil-lations共green dashed line兲.
TABLE II. Absolute values of the coefficients of nonlinear cardiorespiratory interactions corresponding to the last three base functions in共3兲,兵xrxc,xr
2 xc,xrxc
2其
. Coefficients兵␣i其correspond to the respiration coupling
to cardiac rhythm. Coefficients兵i其correspond to the cardiac oscillation coupling to respiration. For each set of coefficients the actual values 共top row兲 are compared to the mean inferred values obtained from 100 nonoverlapped 1600 s blocks of data 兵xr共t兲,xc共t兲,yr共t兲,yc共t兲其. Each block includes 160 000 points with a sampling time of 0.01 s共middle row兲. The estimation error is shown in the bottom line.
␣20 20 ␣21 21 ␣22 22 D11 D22
0.12 2.20 0.048 0.27 −0.066 −8.67 0.18 8.13
0.12 2.41 0.048 0.28 −0.070 −8.61 0.18 8.14
[image:7.612.109.506.666.734.2]F共S
⬘
,兲=兺
k=−MM
akSi
⬘
−+k=共Si
⬘
−−2+ 2Si⬘
−−1兲+共3Si⬘
−+ 2S⬘
i−+1+Si⬘
−+2兲 9Furthermore, we assume for simplicity that the pressure os-cillations do not deviate far from the working point S0 in
共22兲, i.e.,S
⬘
⬇S.To establish the connection between the DeBoer model
共19兲–共21兲 and the model共1兲,共2兲 presented in this paper, we note that the DeBoer model is a piecewise approximation of the actual BP signal. In particular, it describes the BP signal as an exponential decay during 2 / 3 of theRRinterval and a linear increase during 1 / 3 of theInas shown in Fig. 7共b兲. We also note that this model of cardiac oscillations共2兲resembles the FitzHugh-Nagumo共FHN兲model of the system
再
x˙=⑀共y−x兲,y˙=␣y+␥y2+␦y3−x+C,
冎
共23兲 where we have neglected for a moment the cardiorespiratory interaction. The approximation of the BP signal by the output of the FHN system is also shown in Fig. 7共b兲. It can be seen already from a comparison between the two approximations that there is a close connection between the DeBoer model and the model of coupled oscillators considered in this paper. This can be further illustrated by noting that for small⑀the limit cycle in the FHN system consists of fast motion with practically constant values ofy, whenyjumps between nega-tive and posinega-tive values, and slow motion, when y changes very little共see Fig. 8兲. Assuming a constant value ofyat the top 兩a+兩 and at the bottom −兩a−兩 of the dashed curve corre-sponding to slow motion along the limit cycle, we can inte-grate the first equation in共23兲to obtainx0共t兲=
冦
冉
Sn−1+兩a−兩 
冊
e−t−兩a−兩
 , for 0⬍t⬍ 2 3In;
冉
Dn−兩a+兩 
冊
e−t+兩a+兩  , for
2
3In⬍t⬍In.
冧
This solution closely resembles Eqs. 共19兲 and 共20兲 of the DeBoer model.It can be seen even from this simplified discussion that the parameters of the model 共1兲 and 共2兲 found in the present paper can be related directly to the physiological parameters of the autonomous control of circulation. Furthermore, this discussion suggests that it should be possible at least, in prin-ciple, to bridge inverse and forward modeling and to infer parameters of the autonomous nervous control of the cardio-vascular system directly from the time-series data.
We emphasize, however, that the results obtained repre-sent only a first step in this direction. In particular, the De-Boer model itself has to be modified in various ways, includ-ing more realistic functional form of the feedback terms and specifically so as to take into account the fact that the barore-FIG. 7. 共a兲 The BP signal in the frequency range of cardiac
oscillations 共black line兲. Systolic pressure 共Sn兲, diastolic pressure 共Dn兲, RR intervals共In兲, and arterial decay time共T=RC= 1,318 ms兲
[image:8.612.53.298.55.435.2]are shown for thenth heartbeat. 共b兲Comparison of the BP signal 共thin black line兲 with the approximations adopted in the DeBoer 共dashed line兲and FitzHugh-Nagumo共dotted line兲models. The ver-tical scale has arbitrary units.
FIG. 8. Time evolution of the dynamical variablesx共solid line兲 and y共dashed line兲 of the FHN system with parameters:⑀= 0.01,
[image:8.612.320.559.55.240.2]flex control is a closed loop关18,20兴. In fact, it was shown
关73兴that a multicompartment closed-loop model of the car-diovascular responses can simulate well the experimentally observed variations in the time series. On the other hand, this comparison suggests that the inference scheme used in this paper has to be modified in various ways to facilitate con-vergence and guarantee deeper physiological meaning of the model parameters, as will be discussed in more detail else-where. It is also important to emphasize that dynamical in-ference of more sophisticated multidimensional models of the type关73兴, as well as coupled oscillatory models关13兴, can now be addressed within the framework of full Bayesian inference of the unknown dynamical variables.
VII. CONCLUSION
In the present paper we have presented a technique for nonlinear dynamical inference of cardiovascular interactions from blood pressure time-series data. The method is applied to the simultaneous estimation of the dynamical couplings and noise strengths in a model of the nonlinear cardiorespi-ratory interaction. We have identified a simple nonlinear
sto-chastic dynamical model of the cardiorespiratory interaction that describes, within the framework of inverse modeling, the time-series data in a particular frequency band. The method was validated by use of synthesized data obtained by numerically integrating the inferred model itself. We have shown that main source of error in the method is the decom-position of the blood pressure signal into two oscillatory components. We illustrate in the discussion that the dynami-cal model of the cardiorespiratory interaction identified in the present research can be related to the well-known beat-to-beat model of cardiovascular control by DeBoer et al.
关68兴. The method developed in this paper can be used to infer the parameters of stochastic nonlinear dynamical models from observed phenomena and is applicable across many sci-entific disciplines.
ACKNOWLEDGMENTS
This work was supported by the Engineering and Physical Science Research Council共UK兲, NASA CICT-IS-DU Project
共USA兲, the Russian Foundation Science, Wellcome Trust, the ARRS共Slovenia兲, and INTAS.
关1兴R. D. Berger, J. P. Saul, and R. J. Cohen, Am. J. Physiol. Heart Circ. Physiol. 256, H142共1989兲.
关2兴L. P. Faucheux, L. S. Bourdieu, P. D. Kaplan, and A. J. Libch-aber, Phys. Rev. Lett. 74, 1504共1995兲.
关3兴T. J. Mullenet al., Am. J. Physiol. Heart Circ. Physiol. 272, H448共1997兲.
关4兴R. Mukkamalaet al., Am. J Physiol.: Regul. Integr. Compar. Physiol. 276, R905共1999兲.
关5兴R. Mukkamala and R. J. Cohen, Am. J. Physiol. Heart Circ. Physiol. 281, H2714共2001兲.
关6兴G. Nollo et al., Am. J. Physiol. Heart Circ. Physiol. 280, H1830共2001兲.
关7兴K. H. Chon, T. J. Mullen, and R. J. Cohen, IEEE Trans. Biomed. Eng. 43, 530共1996兲.
关8兴S. Lu and K. H. Chon, IEEE Trans. Signal Process. 51, 3020 共2003兲.
关9兴D. Jordan, inCardiovascular regulation, edited by D. Jordan and J. Marshall共Portland Press, Cambridge, 1995兲.
关10兴H. Seidel and H. Herzel, inModeling the Dynamics of Biologi-cal Systems, edited by E. Mosekilde and O. G. Mouritsen 共Springer, Berlin, 1995兲, pp. 205–229.
关11兴H. Seidel and H. Herzel, Physica D 115, 145共1998兲. 关12兴G. G. Berntsonet al., Psychophysiology 34, 623共1997兲. 关13兴A. Stefanovska and M. Bračič, Contemp. Phys. 40, 31共1999兲. 关14兴S. C. Malpas, Am. J. Physiol. Heart Circ. Physiol. 282, H6
共2002兲.
关15兴I. Majercak, Bratisl Lek Listy 103, 368共2002兲.
关16兴P. V. E. McClintock, and A. Stefanovska, inFluctuations and Noise in Biological, Biophysical and Biomedical Systems II, edited by D. Abbott, S. M. Bezrukov, A. Der, and A. Sanchez 共SPIE, Bellingham, WA, 2004兲, pp. 54–68.
关17兴S. Eyal and S. Akselrod, Methods Inf. Med. 39, 118共2000兲. 关18兴T. Satoet al., Am. J. Physiol. Heart Circ. Physiol. 276, H2251
共1999兲.
关19兴P. van Leeuwen and H. Bettermann, Herzschr Elektrophys 11, 127共2000兲.
关20兴J. V. Ringwood and S. C. Malpas, Am. J. Physiol.: Reg. Integr. Compar. Physiol. 280, R1105共2001兲.
关21兴A. Stefanovska, D. G. Luchinsky, and P. V. E. McClintock, Physiol. Meas 22, 551共2001兲.
关22兴K. Kotani, K. Takamasu, Y. Ashkenazy, H. E. Stanley, and Y. Yamamoto, Phys. Rev. E 65, 051923共2002兲.
关23兴J. A. Tayloret al., Am. J. Physiol. Heart Circ. Physiol. 280, H2804共2001兲.
关24兴R. Zou and K. H. Chon, IEEE Trans. Biomed. Eng. 51, 219 共2004兲.
关25兴J. A. Tayloret al., Am. J. Physiol. Heart Circ. Physiol. 280, H2804共2001兲.
关26兴K. H. Chon, IEEE Trans. Biomed. Eng. 48, 622共2001兲. 关27兴J. Jamšek, A. Stefanovska, P. V. E. McClintock, and I. A.
Khovanov, Phys. Rev. E 68, 016201共2003兲.
关28兴J. Jamšek, A. Stefanovska, and P. V. E. McClintock, Phys. Med. Biol. 49, 4407共2004兲.
关29兴M. G. Rosenblum, L. Cimponeriu, A. Bezerianos, A. Patzak, and R. Mrowka, Phys. Rev. E 65, 041909共2002兲.
关30兴M. Paluš, V. Komárek, Z. Hrnčíř, and K. Štěbrová, Phys. Rev. E 63, 046211共2001兲.
关31兴R. Mrowka, L. Cimponeriu, A. Patzak, and M. G. Rosenblum, Am. J. Physiol.: Regul. Integr. Compar. Physiol. 285, R1395 共2003兲.
关32兴C. Schäfer, M. G. Rosenblum, J. Kurths, and H. H. Abel, Na-ture共London兲 392, 239共1998兲.
关33兴N. B. Janson, A. G. Balanov, V. S. Anishchenko, and P. V. E. McClintock, Phys. Rev. Lett. 86, 1749共2001兲.
关35兴S. Lu, H. Ju, and K. H. Chon, IEEE Trans. Biomed. Eng. 48, 1116共2001兲.
关36兴R. Meyer and N. Christensen, Phys. Rev. E 65, 016206 共2001兲.
关37兴P. E. McSharry and L. A. Smith, Phys. Rev. Lett. 83, 4285 共1999兲.
关38兴J. P. M. Heald and J. Stark, Phys. Rev. Lett. 84, 2366共2000兲. 关39兴R. Meyer and N. Christensen, Phys. Rev. E 62, 3535共2000兲. 关40兴J.-M. Fullana and M. Rossi, Phys. Rev. E 65, 031107共2002兲. 关41兴S. Siegert, R. Friedrich, and J. Peinke, Phys. Lett. A 253, 275
共1998兲.
关42兴M. Siefert, A. Kittel, R. Friedrich, and J. Peinke, Europhys. Lett. 61, 466共2003兲.
关43兴J.-M. Fullana and M. Rossi, Phys. Rev. E 65, 031107共2002兲. 关44兴V. N. Smelyanskiy, D. G. Luchinsky, D. A. Timuçin, A. Ban-drivskyy, and D. G. Luchinsky, Phys. Rev. E 72, 026202 共2005兲.
关45兴M. B. Willemsen, M. P. van Exter, and J. P. Woerdman, Phys. Rev. Lett. 84, 4337共2000兲.
关46兴K. Visscher, M. J. Schnitzer, and S. M. Block, Nature 共London兲 400, 184共1999兲.
关47兴D. J. D. Earn, S. A. Levin, and P. Rohani, Science 290, 1360 共2000兲.
关48兴J. Christensen-Dalsgaard, Rev. Mod. Phys. 74, 1073共2002兲. 关49兴V. N. Smelyanskiy, D. G. Luchinsky, A. Stefanovska, and P. V.
E. McClintock, Phys. Rev. Lett. 94, 098101共2005兲.
关50兴P. J. Saul, D. T. Kaplan, and R. I. Kitney, inComputers in Cardiology共IEEE Comput. Soc. Press, Washington, 1989兲, pp. 299–302.
关51兴A. Stefanovska, M. Bračič, S. Strle, and H. Haken, Physiol. Meas 22, 535共2001兲.
关52兴A. Stefanovska and P. Krošelj, Open Syst. Inf. Dyn. 4, 457 共1997兲.
关53兴A. J. Camm, M. Malik, J. T. Bigger et al., Circulation 93, 1043共1996兲.
关54兴A. J. Taylor, D. L. Carr, C. W. Myers, and D. L. Eckberg, Circulation 98, 547共1998兲.
关55兴M. W. R. Milnor,Hemodynamics共Williams and Wilkins, Bal-timore, 1989兲.
关56兴I. Javorka, M. ans Zila, K. Javorka, and A. Calkovska, Physiol. Rev. 51, 227共2002兲.
关57兴R. W. DeBoer, J. M. Karemaker, and J. Strackee, Am. J. Physiol. 253, H680共1987兲.
关58兴E. W. Taylor, D. Jordan, and J. H. Coote, Physiol. Rev. 79, 855共1999兲.
关59兴H. P. Koepchen, inMechanisms of Blood Pressure Waves, ed-ited by K. Miyakawa, H. P. Koepchen, and C. Polosa 共Springer, Berlin, 1984兲.
关60兴A. Melcher, Acta Physiol. Scand. Suppl. 435, 1共1976兲. 关61兴F. L. Abel and J. A. Waldhausen, Am. Heart J.78, 266共1969兲. 关62兴M. P. Gilbey, D. Jordan, D. W. Richter, and K. M. Spyer, J.
Physiol.共London兲 365, 67共1984兲.
关63兴L. Glass and M. C. Mackey,From Clocks to Chaos共Princeton University Press, Princeton, 1988兲.
关64兴C. Braun et al., Am. J. Physiol. Heart Circ. Physiol. 275, H1577共1998兲.
关65兴K. Suder, F. R. Drepper, M. Schiek, and H.-H. Abel, Am. J. Physiol. Heart Circ. Physiol. 275, H1092共1998兲.
关66兴V. Novaket al., J. Appl. Physiol. 74, 617共1993兲.
关67兴J. K. Kanters, M. V. Hojgaard, E. Agner, and N. H. Holstein-Rathlou, Am. J. Physiol. 272, R1149共1997兲.
关68兴R. W. de Boer, J. M. Karemaker, and J. Strackee, Psychophysi-ology 22, 147共1985兲.
关69兴D. K. Arrowsmith and C. M. Place, Ordinary Differential Equations共Chapman and Hall, London, 1982兲.
关70兴R. Meyer and N. Christensen, Phys. Rev. E 62, 3535共2000兲. 关71兴R. Graham, Z. Phys. B 26, 281共1977兲.
关72兴M. I. Dykman, Phys. Rev. A 42, 2020共1990兲.