Usage of Classification based Association for Removal
of Noisy Attributes
Nalini Yadav
PCCOE, Akurdi, Pune, India
K. Rajeswari,
Ph.D. Associate ProfessorPCCOE, Akurdi, Pune, India
V. V. Vaithiyanathan,
Ph.D. Associate Dean ResearchSASTRA University Kumbakonam, India
ABSTRACT
Data mining is a process of extracting knowledge from underlying huge multidimensional data. Data mining techniques discovers hidden patterns from a given data. Classification is one of the techniques of data mining. Data Classification consists of categorization of data under the known class labels for its most effective and efficient utilization. There are different algorithms available for classification. Association rule mining is used to generate the rules for strongly associated attributes. It helps to uncover the association between seemingly unrelated attributes. Association rules are identified by analyzing patterns which satisfies the confidence and support criteria. This paper explains pre-processing for a given bank data set along with classification and association rule mining. Association followed by classification method helps in finding the noisy data attributes. Experimental setup uses WEKA tool for data mining. WEKA is a collection of machine learning algorithms for data mining tasks. Experiment has shown that classification with guidance of strongly supported rules from association rule mining helps in removal of noise and has increased the accuracy of classifier for a given data set.
General Terms
Data mining, WEKA
Keywords
Data mining, Classification, Association rule mining, accuracy, noisy data, confidence, support criteria
1.
INTRODUCTION
Data mining involves the extraction of knowledge from existing raw data. It discover the patterns and associations among the different attributes of data. From collection and management of data, data mining has moved towards analysis and prediction about data [1]. The other term used for the data mining is Knowledge Discovery in Databases (KDD) [1]. It is an extraction of implicit but previously undiscovered or unknown knowledge from data in databases [1]. Different classification techniques are used for data mining purpose [2]. Classification and association are the two popular techniques used to predict user interest and relationship between those data items which has been used by users [3, 4].
Bank data is always important data for taking the finance related decisions by many departments of bank like heath insurance department, loan department and car policy departments. Bank data is mined for bank business analysis. It can be analysed to find the answers of many business questions. Questions can be related to loan payment capability of customer or premium category of customers. Even analysis can be done if customer is able to buy PEP (Personal Equity Plan).
WEKA (Waikato Environment for Knowledge Learning)[5] is a computer program that was developed by the student of the University of Waikato in New Zealand for the purpose of identifying information from raw data gathered from agricultural domains [5]. It is a powerful tool as it contains supervised learning as well unsupervised learning methods. It contains Classification, Clustering, Association Mining, Feature Selection, Data Visualization, etc. WEKA gives easy to operate environment for data mining algorithms. WEKA comes under the open source software issued under GNU General Public License [5].
This paper gives the experiment about how association rule mining with classification, is used to find the noisy data attributes in bank data set.
This paper is organised as follow: Section 2 describes the literature review. Section 3 gives our proposed work and demonstrates experimental steps. Section 4 gives details about classifier evaluation parameters. Section 5 discusses about the observations and result. Section 6 gives the conclusion of experiment.
2.
LITERATURE REVIEW
2.1
Decision Tree
Decision tree [1] is powerful classification algorithm in data mining. There are several popular decision algorithms such as Quinlan’s ID3, C4.5, C5, and CART [1]. A structure of decision tree is like a flow-charting. It has nodes and leafs. Each internal node is a test for an attribute. Branch denotes an outcome for the test which has been performed on an attribute. Leaf node represents the class label [1]. This technique separates observation into branches to construct tree on repetition basis. In most cases, tree classifiers perform classification in two stages: tree-growing and tree-pruning. The tree-growing is top down approach. In this stage, the tree is split in a recursive manner called recursive partitioning. Tree splitting is stopped in two cases. Either the subset at a node has all same class value or there is no value added for predictions after further splitting. In the tree-pruning, the tree will be fully grown, fully grown tree is cut back to avert over fitting data and this way it improves the correctness of the tree in bottom up manner. Decision tree is widely used in various areas because it is strong enough for data distribution. In the experiment Random Tree, Random Forest and J48 decision tree algorithms are used.
A random forest is a collection of unpruned decision tree. Random forest is often used when we have large training data sets and large number of input variables. At the end, this method builds many decision trees [2].
gain (difference in entropy). Normalized information gain is resulted from choosing criteria for splitting the data. Attributes are arranged in decreasing order of information gain and used at each step for building the internal node. The training process concludes when the resulting nodes contain instances of single classes or if no attribute can be found that would result to the information gain [1].
2.2
Bayes Classification
One of the statistical classifier is Bayesian classifier [2]. It is a supervised learning method. It predicts class membership probabilities. Based on prior and posterior probabilities it predicts about the class of given problem. It calculates explicit probabilities for hypothesis and it is robust to noise in input data. When Bayesian classifier is applied to huge database, it gives high accuracy and speed. Naive Bayesian classifier is used in the experiment. Naive Bayesian classifier is based on assumption of independence between the values of the attributes. The assumption is called class-conditional independence.
2.3
K-Nearest Neighbour
K-Nearest Neighbour classifier [1] works on basis of distances between tuples. Nearest neighbour classifier follows the method of analogy learning. This method does the comparison between test tuples and training tuples that are similar to it. The unknown tuple is assigned to the most common class among its K-nearest neighbours. When K = 1, the unknown tuple is assigned the class of the 1 training tuple that is closest in the pattern space. This method is also called the lazy learner method as it simply stores the training data and waits until it is given with test data [2].
2.4
Association Rule Mining
Association rule mining is a method for finding the association or relation between the attributes [5]. It generally helps in discovering the relation between the attributes which seems to be unrelated.
Item set is a set of an item. K-item set contains K items. Occurrence of frequency of an item in transaction is observed. I is said to be a frequent item set, if the relative support of an item set I satisfies a prescribed minimum support threshold [6]. The association rule mining is a 2 step process:
1. Find all frequent item sets satisfying the criteria of minimum support count.
2.
Generation of best association rules from the frequent item sets. Rules must satisfy minimum support and confidence. These rules are called best rules [7].3.
PROPOSED WORK
[image:2.595.48.291.667.755.2]In this paper bank data set is used. This data set is having 600 instances and total 12 attributes. Data set contains the fields as shown in Table 1.
Table 1. Data set description
Attribute Description
id a unique identification number age age of customer in years (numeric)
Sex MALE / FEMALE
Region inner_city/rural/suburban/town
Income income of customer (numeric) Married is the customer married (YES/NO) Children number of children (numeric)
Car does the customer own a car (YES/NO) save_acct does the customer have a saving account
(YES/NO)
current_acct does the customer have a current account (YES/NO)
Mortgage does the customer have a mortgage (YES/NO) Pep did the customer buy a PEP (Personal Equity
Plan) after the last mailing (YES/NO)
To apply this data to association rule mining some pre-processing is needed.
Steps used for Pre-processing:
1. Attributes having all distinct values are removed using WEKA pre-possessing remove attribute filter. 2. The required technique of association rule mining
can only be performed on categorical data. For getting categorical data from numeric and continuous attributes, discretization is performed. There are three numeric attributes – age, income, and children.
3. These numeric attributes are converted to categorical data with help of WEKA.
4. For the attribute children there are only four possible values. Values are 0, 1, 2 and 3. Manual conversion is applied for this attribute for converting from numeric to categorical.
5. WEKA discretize filter is performed on age and income attribute, each is divided into 3 bins. 6. With the binning approach these attributes are
converted to categorical values.
Once the data is pre-processed actual experiment is followed. Experimentation steps are as follows
1. Different classifiers are applied on initial pre-processed data. Classifiers used in experiments are
a. Random Tree b. Random Forest c. J48
d. Naive Bayes
e. K- Nearest Neighbour – ibk1
2. Performance of classifiers are studied on basis of following evaluation parameters
a. Correctly classified instances b. Specificity
3. WEKA, Associate- apriori with CAR is applied to is pre-processed data set.
4. Apriori algorithm gives the best rules for the association between given attributes with 90% confidence.
5. These resultant rules are analyzed. Analysis gives some unimportant attributes from given data set which is not considered in the generation of best association rules by WEKA, Associate-apriori. Post experimental steps
1. Unimportant attributes which were found in previous steps are removed one by one and classifier is applied on resulted data set.
2. Evaluation parameters for each classifier for different experiments are studied for the comparative behaviour.
4.
CLASSIFIER EVALUATION
PARAMETERS
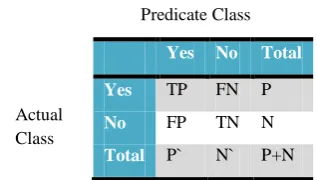
[image:3.595.310.548.85.295.2]Basis for model evaluation is confusion matrix [1]. Confusion matrix gives the summarization of results. Confusion matrix is given in Table 2.
Table 2: Confusion Matrix
Where,
TP: Positive tuples that were correctly labelled by classifier TN: Negative tuples that were correctly labelled
FP: Negative tuples that were incorrectly labelled as positive FN: Positive tuples that were mislabelled as negative
There are different evaluation measures [1]. Evaluation measures are summarised as in Table 3. These evaluation measures are used for evaluating the performance of classifiers.
[image:3.595.64.223.355.445.2]There are different evaluation measures [1]. Evaluation measures are summarised as in Table 3.
Table 3: Evaluation Measures
Measure Formula Comments
Correctly classified Instances
- Number of correctly
classified Instanced by classifier
Sensitivity TP÷P True Positive Rate Specificity TN÷N True Negative Rate Precision TP÷(TP+FP) Exactness i.e. Number
of tuples labelled as positive as actually positive
Accuracy (TP+TN)÷(P+N) Recognition Rate Error Rate (FP+FN)÷(P+N) Misclassification rate ROC Curve True Positive Rate
verses False Positive Rate
Curve for showing trade-offs between TPR and FPR
These evaluation measures are used for evaluating the performance of classifiers.
5.
RESULTS AND DISCUSSION
[image:3.595.317.541.399.512.2]Result of WEKA-associate apriori result is tabulated in Table 4. As an experiment these attributes are removed one by one and classifier is applied. Experimentation result of 3 stages is tabulated in Table 5. Details of 3 stages is given below.
Table 4: Apriori Result
With reference to Table 4 it is found that four attributes are not used by WEKA while generating the best rules. These attributes are - Age, Region, Car and Income.
Stage 1: ‘After initial processing’: After initial pre-processing of data, different classifiers are applied. Classifiers are evaluated with different parameters as discussed in Table 3.
Table 5: Experimental Observation
Classifier (600 instance)
Algorithms implemente d
Correctly classified instances (%)
Sensitivity Specificity Accuracy Error Rate
ROC Area
After Initial Pre-processing
Decision
Tree Random Tree 75.6667 0.757 0.248 0.757 0.243 0.762 Random
Forest 78.6667 0.787 0.217 0.787 0.213 0.839 Yes No Total
Yes TP FN P
No FP TN N
Total P` N` P+N Actual
Class
Predicate Class
Best rules found:
[image:3.595.119.477.622.757.2]J48 86 0.86 0.142 0.86 0.14 0.869 Bayes
Classificati on
Naive Bayes 70.1667 0.702 0.314 0.702 0.298 0.775
K-Nearest
Neighbour ibk 67.1667 0.672 0.335 0.672 0.328 0.668 After removal of Age and Region
Decision
Tree Random Tree 83.1667 0.832 0.165 0.832 0.168 0.832 Random
Forest 82.3333 0.823 0.179 0.823 0.177 0.858
J48 85.3333 0.853 0.146 0.853 0.147 0.869
Bayes Classificati on
Naive Bayes 71.8333 0.718 0.301 0.718 0.282 0.776
K-Nearest
Neighbour ibk 75.8333 0.758 0.246 0.758 0.242 0.756 After removal of age, region, car and income
Decision
Tree Random Tree 76.3333 0.763 0.235 0.763 0.237 0.821 Random
Forest 77.1667 0.772 0.237 0.772 0.228 0.83
J48 79.6667 0.797 0.219 0.797 0.203 0.85
Bayes Classificati on
Naive Bayes 71.8333 0.718 0.304 0.718 0.282 0.763
K-Nearest
Neighbour ibk 73.8333 0.738 0.262 0.738 0.262 0.738 Stage 2: ‘Removal of attributes - age and region’: With
WEKA-remove attribute age and region attributes are removed from pre-processed data set. With this new data set, classifiers are evaluated and observations are tabulated in Table 5 of stage 2.
[image:4.595.121.481.69.544.2]Stage 3: ‘Removal of attributes age, region, car and income’: In this last stage along with age and region; car and income attributes are also removed with WEKA-remove attributes. Observations related to classifier evaluation parameters are tabulated in Table 5.
Table 5 consists of 3 stages which are compared with respect to classifier evaluation parameters for 5 classifiers. Take an example of Random Tree, it’s observed that correctly classified instances are 75.67%, 83.16% and 76.33% for stages of ‘After initial pre-processing’, ‘Removal of attributes - age and region’ and ‘Removal of attributes age, region, car and income’ respectively. Similarly stages are further analyzed and compared for all other parameters for all 5 classifiers.
Graphical representation for comparison of accuracy at each stage for 5 classifiers is given in Figure 1. It compares five classifiers for three stages of experiment.
Fig 1: Comparison of Accuracy (in %)
60 65 70 75 80 85 90
%
Acc
u
racy
Classifiers
[image:4.595.318.545.587.749.2]It is observed that the accuracy of all 5 classifier increases compared to stage 1 when attributes age and region are removed. Further when all 4 attributes age, region, car and income are removed the accuracy of classifiers decreases compared to removal of only 2 attributes age and region.
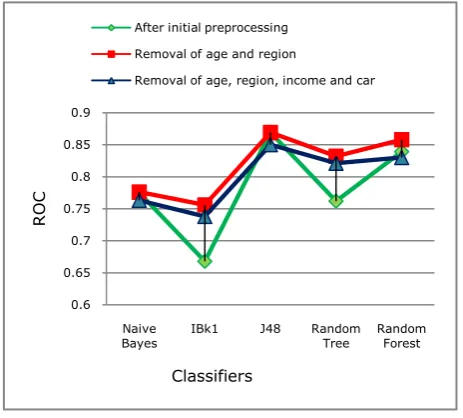
Fig 2: Comparison of ROC curve
Comparison of ROC curves is given in Figure 2. It is observed that Area Under Curve (AUC) [1] is more in stage 2 comparative to stage 1 and 3.
Complete analysis of Table 5, Figure 1 and Figure 2 shows, performance of classifiers improves with removal of 2 attributes - car and income from pre-processed data. This improvement of classifier further decreases when all 4 attributes are removed from pre-processed data.
It is concluded from the experiment that the only age and region are noisy or unimportant attributes because all classifiers’ performance is improved when these attributes are removed.
6.
CONCLUSION
There are several methods in data mining used for pre-processing of data. For removal of noisy data manual observation and study of data is needed. But with the above experiments it can be seen that noisy data can be found easily by applying association rule mining and classification. Experiment consists of removal of attributes which did not
appear in the rules of association rule mining and then applying the classifiers on new data set. In experiment of Bank data set it is observed that WEKA associate rule mining generates the best rules and discards some unimportant attributes from the best rule generation. These unimportant attributes are removed which improves the accuracy of classifier. It is concluded from the experiment that classification with associate rule mining helps to find out noisy or unimportant attributes of given bank data set.
7.
ACKNOWLEDGMENTS
The authors thank to Pimpri Chinchwad College of Engineering for giving an opportunity to publish the paper. The authors also thank University of Waikato for WEKA tool availability as an open source.
8.
REFERENCES
[1] Han J, Kamber M, Pei J. Data Mining: Concepts and Techniques. 3rd ed. Burlington, Massachusetts, USA: Morgan Kaufmann Publishers, 2011.
[2] Shah C, Jivani A. Comparison of Data Mining Classification Algorithms for Breast Cancer Prediction. In: IEEE 2013 Fourth International Conference on Computing, Communications and Networking Technologies; 4-6 July 2013; Tiruchengode, India. [3] Rajeswari K, Vaithiyannathan V. Mining Association
Rules Using Hash Table. Int J Comput Appl 2012; 57: 7-11.
[4] Rajeswari K, Vaithiyannathan V. Heart Disease Diagnosis: An Efficient Decision Support System Based on Fuzzy Logic and Genetic Algorithm. Int J Decision Sci, Risk Manage 2011; 3; 81-97.
[5] Witten I, Frank E, Hall M. Data Mining: Practical Machine Learning Tools and Techniques. 3rd ed. Burlington, Massachusetts, USA: Morgan Kaufmann Publishers, 2011.
[6] Borkar S, Rajeswari K. Attributes Selection for Predicting Students’ Academic Performance using Education Data Mining and Artificial Neural Network. Int J Comput Appl 2014; 86: 25-29
[7] Anwar A, Ahmed N. Knowledge Mining in Supervised and Unsupervised Assessment Data of Students’ Performance. In: IPCSIT 2011 Second International Conference on Networking and Information Technology; Singapore
0.6 0.65 0.7 0.75 0.8 0.85 0.9
Naive
Bayes IBk1 J48 Random Tree Random Forest
R
O
C
Classifiers
After initial preprocessing
Removal of age and region