Spatial Data Fusion with Visual
Feedback
Nikita Schmidt, Corina Sas and Sam Barnett-Cormack Computing Department
InfoLab21, South Drive Lancaster University
Lancaster LA1 4WA United Kingdom [email protected]
This paper outlines our ongoing work towards developing a system for extracting patterns embedded in heterogeneous data streams that contain people’s recorded movements in both physical and virtual spaces. Examples of such spatial data sources are satellite-based sensors (GPS), ultrasound acoustic trackers, radio frequency (WLAN, Bluetooth, UWB) and infrared-based sensors. The core work on pattern extraction relies on the spatial data fusion component aiming to bring various data types to a common format. The additional benefit of this system will consist in the graphical interface that will enable interactive visualisation of the extracted patterns. The rationale of this work is outlined through the relevance of location aware system in the context of ubiquitous computing, which so far have received limited benefits from fields such as Human Computer Interaction (HCI) and interactive visualisation.
Keywords: location, positioning, trajectory, fusion, spatial data, visualisation
1. INTRODUCTION
Location awareness is a key quality of a ubiquitous computing environment. In addition to other information such as identities of relevant people, places and objects, schedules, activities, and so on, location and other spatial information constitutes a large part of the context of each ubiquitous computing device and system. The notion of context is a subject of intensive studies in this area, particularly in the more flexible view of context-as-process rather than the simpler context-as-state [1]. Viewing context as a process allows the system to base its actions on the emergence of information and cooperation rather than the static situation at each moment.
Studies of user location dynamics in virtual environments [2][3][4][5] have confirmed that much useful information can be gained from trajectory analysis [6]. Extending these studies into real environments can be a valuable contribution to the ubiquitous computing research. In a typical ubiquitous system, location data comes from many different sources—from dedicated location sensors such as GPS to logical reasoning (for instance, if the system knows that Alice just logged onto her desktop computer, it can infer her location). Effective use of location and other spatial data (such as trajectories) requires its fusion into a consistent whole.
The development of spatial data fusion algorithms can be greatly assisted by visualising the raw and processed data, as well as additional features related to the dynamic aspects of this data, which can be obtained, for instance, through trajectory analysis. We propose a method for interactive investigation of spatial data fusion techniques through a visual feedback loop, and discuss the issues involved in the ubiquitous computing context.
2. LOCATION IN UBIQUITOUS COMPUTING
car”); on a path (e.g., on the way from home to work); near another object; in one place out of a discrete set (“either in the lab or in the coffee area”); and so on.
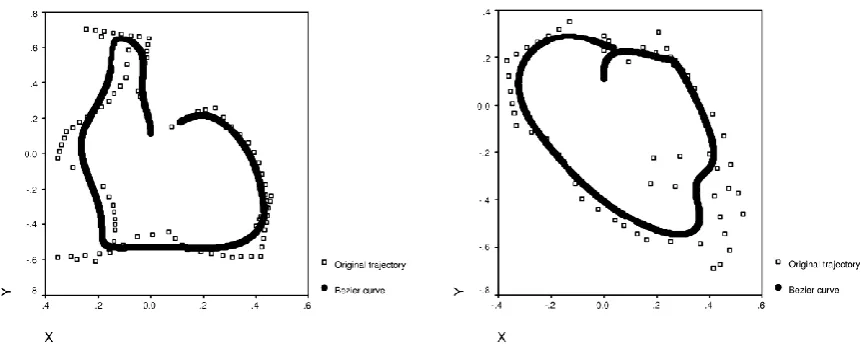
Adding to the mix are secondary spatial features, which can be obtained by analysing the dynamics of suitable data streams. In our previous work, we approximated user trajectories with high order Bézier curves (Figure 1) to derive the following quantitative indicators:
goodness of fit of the actual trajectory to the Bézier curve approximating it; this indicator quantifies the intuitive notion of trajectory “smoothness”;
curvature of the Bézier curve (as most real life trajectory data only represents piecewise-linear trajectories, computing their curvature directly would be meaningless);
[image:2.595.89.521.232.406.2] the number of inflexion points on the Bézier curve (the points where the direction of turning changes).
FIGURE 1: Trajectory analysis with Bézier curves
Additionally, we also computed lengths of straight line segments and the area covered by the convex hull of trajectory points. These indicators were instrumental in deriving higher-level context knowledge such as spatial type (ability) of the users.
An alternative to Bézier curves are B-splines, which are mathematically similar to piecewise Bézier curves, whose degree is typically chosen to be around 3. In addition to reducing the degree, B-splines also have the local control property, whereby changing a single control point only affects its neighbourhood, but not the entire curve (as it is with Bézier). Therefore, a similar analysis can also be conducted with B-splines.
3. SPATIAL DATA FUSION
Two notable definitions of data fusion are [7]:
Data fusion is a formal framework in which are expressed the means and tools for the alliance of data originating from different sources. It aims at obtaining information of greater quality; the exact definition of ‘greater quality’ will depend upon the application.
Data fusion is a multilevel, multifaceted process dealing with the automatic detection, association, correlation, estimation, and combination of data and information from single and multiple sources.
and computer vision [10]. This type of fusion works with static data, where time is not considered. In our research, however, time is a very important component of data and must be taken into account during data fusion.
In location data fusion, Kalman filtering [11] remains the primary technique, widely used for noise reduction in location tracking systems and for merging information from fairly homogeneous sources (such as, for instance, GPS and inertial systems). It is dynamic in the sense that timing is accounted for, and therefore it is a suitable candidate for this project. Particle filters [12], also known as Sequential Monte Carlo methods, are Bayesian model estimation techniques based on simulation and are often used as an alternative to Kalman filtering. Other methods such as machine learning (e.g., genetic algorithms) have not been studied in this context and present an interesting research direction.
4. VISUALISATION
Among the vast array of visualisation techniques, we are particularly interested in addressing two specific requirements.
One is the ability to display data from multiple sensors in multiple dimensions. Apart from the four basic (three space, one time) dimensions of dynamic spatial data, features such as velocity and curvature represent additional dimensions. For instance, on lines showing trajectories these dimensions can be displayed using colour, thickness, and style; existing frameworks [13] may be employed.
The other aspect is uncertainty. Many location sensors are capable of estimating the accuracy and precision of the data they generate. Displaying this information, when it is available, is important for refining the data fusion process. Visualisation of spatio-temporal uncertainty has been particularly studied in the context of GPS [14], which is highly relevant to our goals.
5. VISUAL APPROACH TO LOCATION DATA FUSION
As opposed to the more common form of spatial data fusion dealing with image data, fusion of location and trajectory data from multimodal heterogeneous location sources remains largely unexplored, and is the subject of our research. We propose the following approach.
5.1 Data harmonisation
Spatial data coming from many different sources will be in diverse formats, coordinate systems, and modalities (as explained in section 2 above). It will therefore be first converted to a common representation. We have defined a data model that supports a variety of types of raw and post-processed spatial data, and a corresponding XML schema for storage and exchange. Its extendibility will allow us to annotate the data as it gets processed, and to record feedback from visual analysis. A consideration of existing XML formats for spatial data, such as GML [14] or the simpler GPX [15], showed that they could not be expanded in a consistent way to address our requirements; therefore we felt that a dedicated XML-based format was justified.
5.2 Fusion
Harmonised data from different sources will be merged together so that these different data streams will complement and correct each other. At this stage, algorithms will be chosen and refined following visual feedback. As a starting point, a simple weighted average and a Kalman filter will be used.
5.3 Feature and pattern extraction
The data will be post-processed to extract simple features, such as velocity, acceleration, and rate of turn, as well as more complex features based on Bézier curve analysis [6], such as curvature and goodness of fit. This will allow higher-level patterns to emerge.
5.4 Visualisation
have been tracked. This map, onto which data are projected, can be interactively explored through rotation and scaling.
The data will be displayed in a number of ways:
separately from each source and together, for instance, using multiple linked views [17];
position of static objects reporting proximity information (RFID sensors, Bluetooth devices, WLAN stations, etc.);
raw data and/or features and patterns extracted;
error ranges reported by data sources (where available); the output of the data fusion algorithm;
comparative output from different algorithms and parametric variations;
[image:4.595.72.541.297.541.2] multi-dimensional visualisation of the available location data and computed features (including spatial, temporal and feature dimensions).
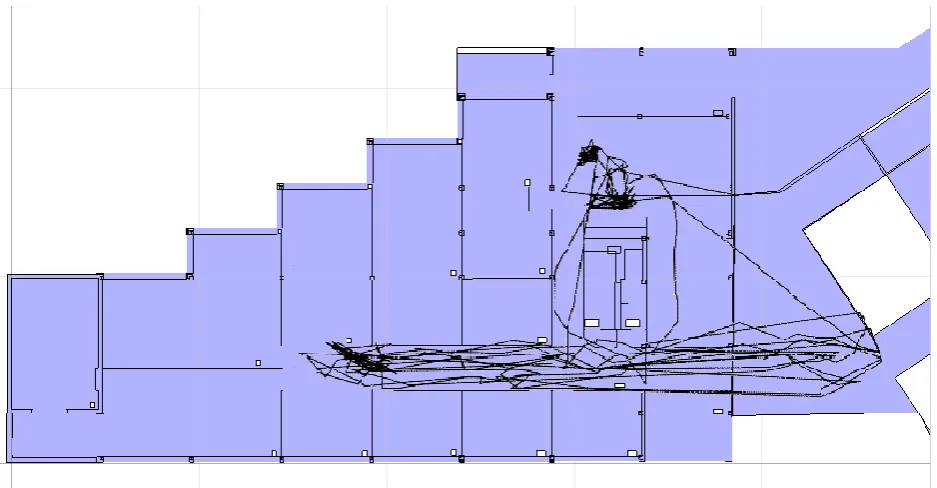
Figure 2 illustrates a very simple visualisation example of one of the authors’ recorded trajectories, laid over a map of the building. Adding other features such as recorded velocity or extracted trajectory patterns allows the user to see how these features highlight accurate and inaccurate data, and assign accordingly their weights for the data fusion algorithm.
FIGURE 2: Map of the building with overlaid trajectories on a 10 metre grid
A variety of techniques can be used for visualising multi-dimensional data: geometric projection, parallel coordinates, drawing attributes (such as colour and thickness), scatterplot matrices, etc. The selection of the appropriate techniques for this type of data is a subject of further investigation. We expect that different fusion and pattern extraction algorithms may require different visualisation types, and the user should, if possible, be allowed to interactively explore them.
6. SYSTEM ARCHITECTURE
The architecture of our system, which is currently under development, is based on a common data model for harmonised data. This data model includes the following core objects:
coordinate systems: Cartesian, spherical, cellular (0-dimensional), etc., together with their parameters such as basis and origin;
coordinates, including estimated measurement or processing error if known; objects being tracked;
sensors providing location data about objects; a sensor can be fixed to a specific location or attached to an object;
Raw multi-sensor data can be represented and stored alongside post-processed and fused data, which can be identified by special sensor IDs corresponding to fusion algorithms. The external storage and exchange format is XML-based, with the schema matching the data model.
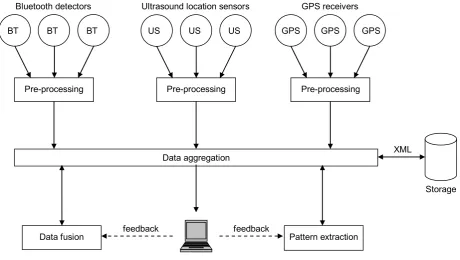
The overall architecture is shown in Figure 3. Data from multiple sources are harmonised and aggregated. The data fusion module provides algorithms for combining and processing these data, whereas pattern extraction uses chiefly the post-processed data to extract high-level behavioural observations through Bézier curve analysis and similar techniques. Pattern extraction can also be used to assist data fusion. Visualisation provides interactive visual access to the aggregated data (raw, processed and patterns), and feeds user input back to the system.
US US US
Pre-processing
GPS GPS GPS
Pre-processing
Storage BT BT
BT
Pre-processing
Data aggregation
Data fusion
Visualisation
Pattern extraction
XML
feedback feedback
[image:5.595.73.534.205.465.2]Bluetooth detectors Ultrasound location sensors GPS receivers
FIGURE 3: System architecture
7. EVALUATION APPROACH
The evaluation of the quality of data fusion depends on the quality of the raw data and the quality of the algorithms involved in data pre-processing and fusion. We shall consider each of them in turn, together with the ways in which their impact can be measured, understood and potentially used to improve the quality of data fusion.
7.1 Quality of raw data.
The quality of raw data can be significantly diminished by inaccurate or missing data. In order to address these issues and limit their impact on the data fusion, it is important to identify them. For this, both statistical descriptors, e.g. outliners, and visualisation methods, e.g. plots will be used. Inaccurate data can be also handled through assigning levels of confidence to each data set, according to the technology that provided the data: for example, GPS-based data collection is more accurate than Bluetooth sightings. 7.2 Quality of pre-processing and fusion algorithms.
each of the recorded data streams. In this way, dynamic visualisation of source data together with fused data overlaid on top of a map offers the basis for qualitative assessment of the quality of fused data. Apart from the obvious benefits of visualisation, this method of assessing data has high face validity. In addition, the quality of the pre-processing and fusion algorithms can be assessed both through software metrics, e.g. complexity, and through statistical descriptors capturing the similarity between the fused data set on the one hand, and the raw data sets and the pre-processed ones on the other hand. 8. CONCLUSIONS
The system introduced in this paper is particularly relevant in the current state-of-the-art development of location aware systems, ubiquitous computing and interactive visualisation. It builds upon our previous work on pattern extraction from spatial data [18][19]. Spatial data fusion depends on the availability of a sensor infrastructure that would enable access to live data. Alternatively, simulated data can be used but the authenticity will be diminished. The interactive visualisation is the component that will be developed through extensive participatory design, since user involvement in the design process will prove highly beneficial.
9. ACKNOWLEDGEMENTS
This work is partially supported by the Nuffield Foundation under grant number NAL/01132/G, “Tracking, recording and modelling movement patterns in public spaces”, and by Science Foundation Ireland under grant number 04/RPI/1544, “Secure and predictable pervasive computing.”
REFERENCES
[1] Coutaz, J., Crowley, J., Dobson, S. and Garlan, D. (2005) Context is key. CACM, 48(3), 49–53.
[2] Sas, C., O'Hare, G. M., & Reilly, R. (2003). A connectionist model of spatial knowledge acquisition in a virtual environment. In
MLIRUM'03, Workshop on Machine Learning, Information Retrieval and User Modelling, June 22-26, Pittsburgh, PA, USA.
[3] Sas, C. (2004). Individual differences in virtual environments. LNCS 3038, 1047-1054. Springer
[4] Sas, C., O'Hare, G. and Reilly, R. (2005). Virtual Environment Trajectory Analysis: A Basis for Navigational Assistance and Scene Adaptivity. Future Generation Computer Systems, 21(7), 1157–1166.
[5] Sas, C., O’Hare, G. and Reilly, R. (2004). A Performance Analysis of Movement Patterns. LNCS 3038, 984-991. Springer. [6] Sas, C. and Schmidt, N. (2006) A typology of course of motion in simulated environments based on Bézier curve analysis.
Knowledge Information Systems, to appear.
[7] Dobson, S. (2005) Leveraging the subtleties of location. In Bailly, G., Crowley, J. and Privat, G. (eds), Proceedings of Smart
Objects and Ambient Intelligence, pp. 175–179
[8] Wald, L. (1999) Some terms of reference in data fusion. IEEE Transactions on Geoscience and Remote Sensing, 37(3, part 1), 1190–1193.
[9] Valet, L., Mauris, G. and Bolon, P. (2001) A statistical overview of recent literature in information fusion. IEEE Aerospace and
Electronic Systems Magazine, 16(3), 7–14.
[10] Chen, H. and Meer, P. (2005) Robust fusion of uncertain information. IEEE Transactions on Systems, Man and Cybernetics,
35(3, part B), 578–586.
[11] Kalman, R. E. (1960) A new approach to linear filtering and prediction problems. Transactions of the ASME — Journal of
Basic Engineering, 82, 35–45.
[12] Arulampalam, M. S., Maskell, S., Gordon, N. and Clapp, T. (2002) A tutorial on particle filters for online nonlinear/non-Gaussian Bayesian tracking. IEEE Transactions on Signal Processing, 50(2), 174–188.
[13] Khan, J., Xu, X. and Ma, Y. (2004) A framework for polysensometric multidimensional spatial visualization. Proceedings of
CGIV ’04, pp. 159–164. IEEE Computer Society, Los Alamitos, CA.
[14] Lodha, S. K., Charaniya, A. P., Faaland, N. M. and Ramalingam, S. (2002) Visualization of spatio-temporal GPS uncertainty within a GIS environment. Proceedings of the SPIE Conference on Radar Sense Technology and Data Visualization, Orlando, FL, April, pp. 216–227
[15] ISO/TC 211/WG 4/PT 19136 Committee Draft (2004) Geography Markup Language (GML). International Organization for Standardization, Geneva, Switzerland
[16] GPX 1.1 (2004) GPX 1.1 schema documentation. TopoGrafix, 24 Kirkland Dr., Stow, MA 01775, USA (http://www.topografix.com/GPX/1/1/).
[17] Roberts, J. C. (2004) Exploratory visualization with multiple linked views. In MacEachren, A., Kraak, M.-J. and Dykes, J. (eds),
Exploring Geovisualization, pp. 159–180. Elsevier, Amsterdam.
[18] Sas, C. (2005) A hybrid model for capturing implicit spatial knowledge. Proceedings of the 4th TAMODIA Workshop, Gdansk, Poland, September, pp. 49–54. ACM Press, New York.
[19] Sas, C., O’Hare, G., & Reilly, R. (2003). Online trajectory classification. In International Conference on Computational Science