http://dx.doi.org/10.4236/jpee.2014.24004
How to cite this paper:Azad, A.K., Rasul, M.G., Khan, M.M.K., Ahasan, T. and Ahmed, S.F. (2014) Energy Scenario: Production, Consumption and Prospect of Renewable Energy in Australia. Journal of Power and Energy Engineering,2,19-25.
http://dx.doi.org/10.4236/jpee.2014.24004
Energy Scenario: Production, Consumption
and Prospect of Renewable Energy in
Australia
A. K. Azad*, M. G. Rasul, M. M. K. Khan, T. Ahasan, S. F. Ahmed
School of Engineering and Technology, Central Queensland University, Rockhampton, Australia Email: *a.k.azad@cqu.edu.au
Received December 2013
Abstract
Australia is the world’s 9th largest energy producer, 17th largest consumer of non-renewable energy resources and ranks 18th on a per person energy consumption basis. Australia’s energy consumption is primarily composed of non-renewable energy resources (coal, oil, gas and related products), which represent 96% of total energy consumption. Renewables, the majority of which is bioenergy (wood and wood waste, biomass, and biogas) combined with clear energy namely wind, solar hot water, solar electricity, hydroelectricity account for the remaining 4% consump-tion. Australia’s renewable energy resources are largely undeveloped which can contribute di-rectly to the Australian economy. In this article, a review of literature on energy scenario is pre-sented and discussed. Australia’s total energy production, consumption, storage and export (in-cluding renewable and non-renewable) data has been analyzed and discussed in this study. The main objective of the study is to analyze the prospect of renewable energy in Australia. This study concludes that Australian economy will grow faster if its undeveloped renewable energies can be used efficiently for electricity generation and transport sector.
Keywords
Renewable Energy; Non-Renewable Energy; Total Energy Production; Electricity Generation; Economy
1. Introduction
The world is facing two major problems, namely energy and environment. Another issue which is closely linked with the above is economy. So, energy, economy and environment are bonded by three dimensional relation-ships with bi-directional causal relationship among them [1]. The world energy consumption is likely to grow faster than the increase in the population [2]. The International Energy Outlook-2013 projects that world energy consumption will be grown by 56% between 2010 and 2040. Total world energy use will rise from 524 quadril-lion British thermal units (Btu) in 2010 to 630 quadrilquadril-lion Btu in 2020 and to 820 quadrilquadril-lion Btu in 2040 [3].
Much of the growth in energy consumption occurs in countries outside the Organization for Economic Coopera-tion and Development (OECD), known as non-OECD, where demand is driven by strong, long-term economic growth. Energy use in non-OECD countries increases by 90%, in OECD countries, the increase is 17%. The In-ternational Energy Outlook 2013 reference case does not incorporate prospective legislation or policies that might affect energy markets [3]. In the world energy status, Australia is holds 9th position in energy production and 17th position as an energy consumer [4,5]. The total energy production including energy export was 17,460 Petajoulesin 2011-2012 which is equivalent to total energy production increase by 5% relative to 2010-2011 [6].
Research is ongoing throughout the world on how to fulfil the energy demand successfully without hampering environment of our planet. Many of them deal with the issue of energy and environment, including the four main measures, namely energy saving and efficiency; switching to natural gas; CO2 recovery; development of alternative energy sources to reduce the CO2 emissions resulting from energy use [7]. Energy generation from the combustion of fossil fuels has simultaneously created several environmental concerns which can threaten the sustainability of our ecosystem. One of the primary concerns is the emissions of greenhouse gases and other types of air pollutants such as hydrocarbons, nitrogen oxide and volatile organic compounds [8]. To minimize the greenhouse effect the world is moving towards alternative energy sources which are eco-friendly, clear, and green energy [9-11].
The population growth is one of the major causes for high energy demand. The United Nations (UN) predicts the world population to reach 9 billion by 2030 [12]. Growth in population and the ever-increasing development of new production technology, new transport, living standard, industrialization etc. is leading to rising energy use [13]. However, development of a country is presently indexing by their energy consumption. But the fossil fuel which is the major sources of energy is decreasing gradually and the harmful effect is increasing sharply day-by-day [14,15]. Australia is presently consuming 96% of non-renewable energy and renewables for the re-maining 4%. Australia has 33% of the world’s uranium resources, 10% of world black coal resources and almost 2% of world conventional gas resources. It has only a small proportion of world crude oil resources. But there is also potential for a number of emerging clear energy technologies that are yet to be commercially developed, in-cluding large scale solar energy plant, geothermal generation technologies, ocean energy technologies and car-bon capture and storage to reduce emissions from coal, oil and gas. Modelling by the Australian Energy Market Operator shows that 100% of power from clean energy would be technically viable by 2030-although with a price tag ranging from $219 billion to $252 billion. Australian Energy Market Operator (AEMO) investigated two future scenarios featuring an electricity grid fuelled entirely by renewable resources in 2030 and 2050. This is the first study of its kind by AEMO into potential costs and the viability of moving to an electricity generation system fuelled entirely by renewable resources [16]. The study aimed to investigate the present energy scenario in Australia. The total energy production by fuel type, energy consumption by fuel type, energy export and prospect of renewable energy data has been analysed and discussed in next sections.
2. Australian Energy Scenario
2.1. Primary Energy Production by Fuel Type
Figure 1 shows the total primary energy production in Australia. In 2011-12 total energy production (17,460 pJ) increased by 5% with respect to 2010-11 (16640 pJ) including exported energy. It has about 37% of domestic consumption and 63% of net energy export [6]. So, Australia’s net energy production serves both domestic and international market. Energy demand increased gradually in both markets has spurred strong growth by 9% per year between 2000-01 and 2011-12 [4]. Presently, more than 60% of primary energy accorded from coal. So, Australian energy economy is fully dependent on coal energy which is clearly shown in Figure 2.
2.2.Primary Energy Consumption by Fuel Type
Figure 1.Total primary energy production in Australia.Source: Energy in Austral-ia 2013 [4], 2013 AES Table-J [17].
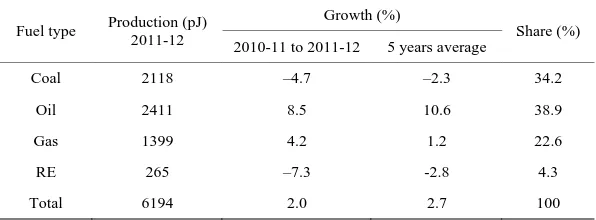
Table 1.Primary energy consumption growth rate by fuel type in Australia.
Fuel type Production (pJ) 2011-12
Growth (%)
Share (%) 2010-11 to 2011-12 5 years average
Coal 2118 –4.7 –2.3 34.2
Oil 2411 8.5 10.6 38.9
Gas 1399 4.2 1.2 22.6
RE 265 –7.3 -2.8 4.3
Total 6194 2.0 2.7 100
Sources: 2013 Australian Energy Statistic Data, Table C [17].
The coal use decreased because the falling coal use in iron and steel sector over the past five years. The re-newable energy account for only 4.3% of total energy consumption. Among the rere-newable energy resources, wind energy contributed only 5.3% of growth whereas solar energy contributed significant growth by 20% from 2010-11 to 2011-12 [6].
2.3. Energy Production by Renewable Energy Sources
Australia is not only gifted with abundant, high quality and diverse non-renewable energy sources but also has large, widely distributed renewable energy sources like wind, solar, geothermal, hydroelectric, ocean energy and bioenergy resources. Australia’s renewable energy resources are largely undeveloped.
Figure 3 shows the energy production from renewable energy sources from 2002-03 to 2011-12. The total renewable energy production reached a peak in 2007-08 and after that it gradually went down reaching a mini-mum in 2008-09. Now the trend is growing and rising. Australian’s renewable energy consumption is 265 pJ which is share around 4.3% of the total energy consumption. The summary of renewable energy consumption, growth and share are presented in Table 2.
Figure 4 shows the Australia’s total energy consumption by fuel type and their percent of share to the total consumption at a glance. The major contributions are from coal about 34.2%, and Oil 38.9%. So, coal and oil sectors contribution in Australian energy economy is more important.
2.4. Energy Consumption by Sectors
Figure 2.Australian’s net energy consumption by fuel type [Unit 1 pe-tajouls, pJ= 1015J]. Source: 2013 Australian Energy Statistics, Table C [17].
Figure 3.Energy production by renewable energy sources [Unit 1 pe-tajouls, pJ= 1015J].Source: 2013 Australian Energy Statistics, Table A [17].
commercial, residential and others is shown in Figure 5. It can be clearly seen from the Figure that the major energy using sectors are electricity generation, transport and manufacturing together account for around 76% of Australia’s energy consumption.
The transport sector accounts for the largest share of Australia’s end use consumption. According to Bureau of Resources and Energy Economy (BREE) estimation, energy consumption of transport increased by an aver-age of 2.4 percent per year during 2000-01 to 2011-12 [6]. This sector consumes mostly petroleum energy. The next largest energy consuming sectors are mining, residential, commercial and services sectors.
3. Prospect of Renewable Energy in Australia
[image:4.595.188.441.327.545.2]Table 2.Australian renewable energy consumption.
Fuel type Consumption (pJ) 2011-12
Growth (%)
2010-11 to 2011-12 Share (%)
Biomass 165 - 0.9 2.3
Biogas/fuel 11 -55.7 0.4
Hydro 51 -16.2 1.0
Wind 22 5.3 0.3
Solar 17 19.9 0.2
Total 265 -7.3 4.3
[image:5.595.148.449.244.410.2]Sources: 2013 Australian Energy Statistic Data, Table C [17].
Figure 4.Total energy consumption and percent of shear. Source: 2013 Australian Energy Statistics, Table C [17].
Figure 5.Total energy consumption by sectors (2011-12).Sources: 2013 Australian Energy Statistics, Table B [17].
[image:5.595.212.413.449.611.2]being faced for large-scale utilization of Australia’s clean energy resources. Changes in regulatory and approval processes are affecting well-established technologies like wind farms in some locations. It is often stated that the deployment of alternative energy resources will require a great deal of new research and development effort. The renewable energy technologies are too sophisticated and complex compared to conventional energy conver-sion technique. Due to the higher initial investment cost the renewable energy technology is not fully used yet. Despite these challenges, the deployment of clean energy technologies is gathering pace, and is expected to play a critical role in moving to a low emissions future while meeting Australia’s continued demand for energy [4,6].
4. Conclusions
The following conclusions can be drawn from this review.
• Total energy production (which includes energy exports) in 2011-12 increased by 5%, relative to 2010-11, to total 17,460 petajoules, reflecting strong growth in natural gas (8%), black and brown coal (5% and 6%) and uranium (6%) production. Production of crude oil and liquefied petroleum gas fell 6%, and renewable ener-gy decreased by 7% in 2011-12 compared to 2010-11.
• Total energy consumption, increased by 2%, relative to 2010-11, to total 6194 petajoules in 2011-12. The result was mainly driven by strong growth in energy use in the commercial and services sector and modest growth in the transport, mining, agricultural and residential sectors. Energy consumption in manufacturing and construction, however, decreased in 2011-12 relative to 2010-11.
• In 2011-12 consumption of renewable energy declined by 7%, relative to 2010-11, largely due to a fall in hydro energy consumption associated with lower hydroelectricity output in southeast Australia due to re-duced water in-flows. Rere-duced hydro energy consumption more than offset the very strong growth observed in wind and solar energy.
• The prospect of renewable energy is more in Australia which will make a great contribution to Australia’s energy economy in near future.
• The authors concluded that the Australia’s renewable energy economic is viable; if its undeveloped renew- able energy can be used effectively for electricity generation and transport sector.
References
[1] Omri,A.(2013) CO2Emissions, Energy Consumption and Economic Growth Nexus in MENA Countries: Evidence from Simultaneous Equations Models.Energy Economics,40, 657-664. http://dx.doi.org/10.1016/j.eneco.2013.09.003
[2] Ong,H.C.,Mahlia,T.M.I. and Masjuki,H.H.(2011) A Review on Energy Scenario and Sustainable Energy in Malay-sia.Renewable and Sustainable Energy Reviews,15, 639-647. http://dx.doi.org/10.1016/j.rser.2010.09.043
[3] U.S.E.I. Administration (2013)International Energy Outlook. http://www.eia.gov/forecasts/ieo/
[4] Willcock,C.N. andMcCluskey, C. (2013)Bureau of Resources and Energy Economics, Energy in Australia 2013.
http://www.bree.gov.au/documents/publications/energy-in-aust/BREE-EnergyInAustralia-2013.pdf
[5] Penney,A.S.K., Ball, A. and Hitchins,N. (2013)Bureau of Resources and Energy Economics, Energy in Australia 2012.
http://www.bree.gov.au/documents/publications/energy-in-aust/energy-in-australia-2012.pdf
[6] Che,A.F.N., McCluskey,C., Pham,P.,Willcock,T. and Stanwix,G. (2013)Bureau of Resources and Energy Economics. Australian Energy Update 2013. http://www.bree.gov.au/publications/aes.html
[7] van Ettinger,J.(1994) Sustainable Use of Energy: A Normative Energy Scenario: 1990-2050.Energy Policy,22, 111-118. http://dx.doi.org/10.1016/0301-4215(94)90128-7
[8] Masjuki, H.H.,Mahlia,T.M.I., Choudhury, I.A. and Saidur,R.(2002) Potential CO2Reduction by Fuel Substitution to Generate Electricity in Malaysia.Energy Conversion and Management,43, 763-770.
http://dx.doi.org/10.1016/S0196-8904(01)00074-7
[9] Bushnell,J., Chen,Y. and Zaragoza-Watkins,M.(2014) Downstream Regulation of CO2Emissions in California’s Elec-tricity Sector.Energy Policy,64, 313-323. http://dx.doi.org/10.1016/j.enpol.2013.08.065
[10] Kirsten, S. (2014) Renewable Energy Sources Act and Trading of Emission Certificates: A National and a Suprana-tional Tool Direct Energy Turnover to Renewable Electricity-Supply in Germany.Energy Policy,64, 302-312.
http://dx.doi.org/10.1016/j.enpol.2013.08.030
[11] Talaei,A.,Ahadi,M.S. and Maghsoudy, S.(2014) Climate Friendly Technology Transfer in the Energy Sector: A Case Study of Iran.Energy Policy, 64, 349-363. http://dx.doi.org/10.1016/j.enpol.2013.09.050
Boston, 2001, 83-113.
[13] Vadiee,A. and Martin,V. (2014) Energy Management Strategies for Commercial Greenhouses.Applied Energy,114, 880-888.http://dx.doi.org/10.1016/j.apenergy.2013.08.089
[14] Hannam,P.(2013) Renewable Energy Study Tips Viable Reality by 2030.
http://www.smh.com.au/business/carbon-economy/renewable-energy-study-tips-viable-reality-by-2030-201308232shb y.html#ixzz2l9LJldlH
[15] Puri,M.,Abraham, R.E.and Barrow, C.J. (2012) Biofuel Production: Prospects, Challenges and Feedstock in Austral-ia.Renewable and Sustainable Energy Reviews,16, 6022-6031. http://dx.doi.org/10.1016/j.rser.2012.06.025
[16] D.O.E. Australian Government (2013)The Australian Energy Market Operator’s 100 Percent Renewavle Study.
http://www.climatechange.gov.au/reducing-carbon/aemo-report-100-renewable-electricity-scenarios/100-cent-renewab les-study-community-summary
[17] Bureau of Resources and Energy Economics (2013) Australian Energy Statistics Data.
![Figure 2.Australian’s net energy consumption by fuel type [Unit 1 pe-tajouls, pJ= 1015J]](https://thumb-us.123doks.com/thumbv2/123dok_us/8028399.768030/4.595.188.441.327.545/figure-australian-energy-consumption-fuel-type-unit-tajouls.webp)

