Munich Personal RePEc Archive
The Responsiveness of Taxable Income
to Changes in Marginal Tax Rates in
Barbados
Moore, Winston
University of the West Indies, Cave Hill Campus, Barbados
15 June 2008
Online at
https://mpra.ub.uni-muenchen.de/21583/
The Responsiveness of Taxable Income to Changes in Marginal Tax
Rates in Barbados
Winston Moore
1Department of Economics, University of the West Indies, Cave Hill Campus,
Bridgetown, BB11000, Barbados
15
thJune 2008
1
The Responsiveness of Taxable Income Changes in Marginal Tax Rates in Barbados
Abstract
Since 2003 policymakers in Barbados have implemented a series of tax reforms that have lowered both basic as well as marginal income tax rates. These changes have more than likely induced taxpayers to alter their behaviour in order to affect their reported taxable income. This paper employs an annual sample of 3,000 individual taxpayers between 2003 and 2006 to investigate the sensitivity of taxable income to changes in marginal tax rates. The empirical approach adopted also allows the researcher to provided evidence on the variation in taxable income by gender and income group. The paper finds that for every 1 percent rise in the marginal tax rate, taxable income decreases by 0.2 percent. Further disaggregation of the database also revealed that a strong negative labour supply effect causes the elasticity for low-income taxpayers to rise to 0.9, while females tend to be more responsive to changes in marginal taxes relative to males.
JEL Classification: H2; H31; C23
1. Introduction
Taxes are an important component of the economic policy mix. If high-income individuals pay
relatively higher rates of tax and those revenues are redistributed to poorer members of the
society, taxes can reduce income inequality. Taxes levied on income and the expenditure are
used in developing countries to generate revenues to finance projects that can have significant
benefits to long-run growth and development. If these taxes, however, are used to finance the
continued growth of the public sector, they can crowd-out overall private capital investment
(Hayek, 1960). In addition, by taking funds away from those members of society who are more
likely to engage in investment activities, a poorly designed tax system can inhibit the long-run
growth prospects for a country.
The empirical literature has, for the most part, found evidence supporting the inverse association
between taxes and economic growth. Helms (1985) reports that higher tax rates, when used to
fund transfer payments, has a negative impact on economic growth. However, if these additional
funds are employed to finance improvements in public services such as education, highways and
public health and safety, the relationship is reversed. This occurs since the quality of public
services positively influences firms‟ location and production decisions. Analogous results are
obtained by Hines (1996) using enterprise-level observations, while Bleaney, Gemmell and
Kneller (2001), using observations on 22 Organisation for Economic Cooperation and
Development economies between 1970 and 1995 find that distortionary taxes adversely influence
In an attempt to speed-up the process of economic convergence, developing countries have, since
the 1970s, engaged in major tax reform plans (Gills, 1989). Tax reform is generally taken to
imply some approach to improving the existing state of affairs. For the most part major attempts
at tax reform usually arise from the recognition of distortions and/or inequities created by the tax
system. Policymakers in these countries have therefore attempted to address these problems
through broadening the tax base, flattening the tax rate structure as well as simplifying the overall
tax administration systems.
The effectiveness of these attempts at tax reform largely depends on the response of economic
agents. A fall in taxes, for example, could lead to a decline in labour supply by some economic
agents as they take the opportunity to increase their leisure since their after-tax income has risen.
In this scenario, the tax reform plan could lower national output. However, it is also possible that
the cutback in tax rates will encourage some individuals to engage in more overtime and thus
lead to greater economic output. Some economic agents can also respond to the change in taxes
by changing the structure of their compensation packages, in an attempt to reduce their tax
liabilities. The response of economic agents to changes in tax rates is therefore ambiguous, i.e. it
has to be assessed empirically, and may vary from one country to the next.
Since the seminal work of Lindsey (1987) and Feldstein (1995) there have been numerous
attempts to assess the impact of tax rate changes on taxpayers‟ responses. In general, these
studies report a statistically significant association between changes in marginal tax rates and
taxable income. However, the magnitude of this association is somewhat controversial. Earlier
This paper attempts to add to this debate by providing estimates of relationship between marginal
taxes and taxable income in the small island developing state of Barbados. Up until now, most of
the research in the area has employed tax return data from US tax reforms that took place in
1981, 1986 and 1993. There are a number of reasons for utilising tax return data for Barbados.
First, it allows the reader to assess whether the relationship between changes in tax rates and
taxable income varies based on the country‟s level of economic development. Second, the study
also gives an analysis of the gender differentials of taxpayer responses.
The remainder of this study is structured as follows. Following the introduction, Section 2
presents a review of the literature in the area. Section 3 offers a brief description of tax reform in
Barbados as well as a discussion of the data and the econometric approach employed. Section 4
provides the empirical results and conducts various tests for the robustness of analysis. Section 5
summarises the key empirical findings as well as discuss the main policy implications arising
from the findings.
2. Literature Review
Lindsey (1987) provides one of the first attempts to assess the relationship between changes in
tax rates and taxable income using observations on individual tax returns. Observations on 100
data items for a stratified sample of 100,000 taxpayers are employed to assess the impact of the
1981 Economic Recovery Tax Act. This legislation provided for a series of tax rate reductions
Individual Retirement Accounts to basically all taxpayers and a two-earner deduction for working
married couples. To assess the effects of tax rates on taxable income, Lindsey first ranked the
taxpayers by adjusted gross income and then did the same for tax returns in 1982. The implicit
assumption behind this approach is that taxpayers in successive fractiles corresponded to the
same individuals in both years. Using this approach, the author reported elasticity estimates with
respect to tax rates and taxable income. These elasticity estimates ranged from 0.7 for taxpayers
earning $50,000, and up to as high as 2.0 for taxpayers with incomes of $1,000,000. These
elasticity estimates were large, suggesting that for high-income taxpayers a 1 percent reduction in
the tax rate leads to greater than proportionate increase in taxable income. The implication of this
for policymakers is that tax rate increases, would likely generate less revenue that tax rate
reductions. The rise in reported income obtained by Lindsey could have occurred due to changes
in labour supply and participation, changes in the form of compensation, reduced tax evasion and
avoidance as well as changes in decisions regarding deductions.
The main limitation‟s of Linsey‟s (1987) study was that the database employed did not provide
the researcher with a panel of observations to conduct the empirical analysis. In addition, the
assumption that individuals in the successive fractiles are identical is quite strong and could have
influenced the overall results. Building on this early research, Feldstein (1995), utilised a panel
of individual tax returns that allows the researcher to follow the same individual over several
years. In contrast to Lindsey, Feldstein conducted his analysis around the Tax Reform Act of
1986, however, the characteristics of both plans were similar: reduced marginal tax rates as well
as broadened the tax base. Nevertheless, Feldstein also obtained relatively large elasticity
Auten and Carroll (1999), however, notes that these earlier studies did not employ effective
controls for other nontax factors that may have impacted on income changes. A panel of over
15,000 individuals is examined for the years before and after the 1986 tax reform episode.
Utilising a two-stage regression approach, Auten and Carroll attempt to control for the effects of
various individual taxpayer characteristics (for example, age, occupation, marital status and
region) on reported income. The empirical results, in contrast to earlier studies, suggest an
elasticity estimate of around 0.6. In reconciling Auten and Caroll‟s result to those of Lindsey
(1987) and Feldstein (1995), Goolsbee (2000) notes that there may be significant differences
between the short- and long-run elasticities. Using a restricted sample of only corporate
executives, the author finds that while the short-run response of taxable income to changes in tax
rates exceeds 1, after just one year the elasticity estimate drops to 0.4.
Gruber and Saez (2002) also attempt to control for these dynamic effects by using a database
containing a large number of households observed over the 1980s. The regression model
expresses changes in individual income as a function of marginal tax rate change, changes in
after-tax income, the previous year‟s income, base year, marital status dummies and a spline term
to capture the non-linear effects of taxes rate changes on income distribution. Gruber and Saez
obtain an elasticity estimate of 0.4, with lower estimates for real and broadly defined income.
Using a somewhat different approach, which compares the effects that differences in state income
tax rates have on taxable income of individuals with the same income and demographic
characteristics, Long (1999) obtains a relatively similar elasticity estimate. Kopczuk (2005) also
find relatively low elasticity estimates, but notes that elasticity may depend on available
There are two main drawbacks of these early approaches: (1) the tax reform episodes considered
usually involved a change in tax rates as well as allowances or deductions, making it difficult to
separate these two effects, and; (2) the analysis was based on comparisons of high and low- to
middle-income taxpayers, which could be affected by increased inequality. Saez (2003) employs
a somewhat different approach to evaluate the relationship between tax rates and income.
Instead, the author uses „bracket creep‟ as the source of variation in tax rates. Using observations
on around 40,000 individuals observed between 1979-1981, Saez obtained elasticity estimates of
0.3 for the full sample, and 0.4 for married taxpayers and 0.2 for singles. While these estimates
are significantly lower than earlier studies, such as those by Lindsey (1987) and Feldstein (1995),
they are in line with recent studies in the area.
3. Tax Reform in Barbados
The income tax system in Barbados is presently regulated by Income Tax Act, Cap. 73 and
requires that income taxes should be levied on all persons that have earned income in Barbados
during the year. Taxable income generally includes income from all business, property, offices
and employment. There are two tax rates, the basic and marginal rates of tax. The basic tax rate,
set at 20 percent is applied to the first $24,200 of taxable income for the tax year. The marginal
tax rate, presently at 35 percent, is then assessed on all income in excess of $24,200.
Table 1 shows the importance of personal taxes to revenue collections in the island by providing
FY1985/86. At the end of FY2006/07 total personal income tax receipts were $297.4 million, the
[image:10.612.116.497.181.491.2]third largest single category behind the value-added tax (VAT) and company taxes.
Table 1: Tax Revenue in Barbados
1985/86 1990/91 1995/96 2000/01 2006/07
BDS $m
Tax Revenue 606.5 891.8 1081.5 1596.3 2066.6 Taxes on Income and Profit 204.2 249.6 376.5 599.0 810.3 Personal Income Tax 134.5 140.0 213.6 293.4 297.4 Company Tax 56.8 95.1 133.5 268.8 444.9 Other 12.9 14.6 29.4 36.8 68.0
Levies 29.5 91.3 13.4 14.6 0.0
Taxes on Property 34.7 46.2 69.7 95.3 150.8 Taxes on Goods and Services 166.7 285.7 438.0 753.7 911.8 Import Duties 115.5 117.8 93.1 120.6 167.6 Other Taxes 85.5 101.1 90.7 13.1 26.1
% of Total
Tax Revenue 100.0 100.0 100.0 100.0 100.0 Taxes on Income and Profit 33.7 28.0 34.8 37.5 39.2 Personal Income Tax 22.2 15.7 19.8 18.4 14.4 Company Tax 9.4 10.7 12.3 16.8 21.5
Other 2.1 1.6 2.7 2.3 3.3
Levies 4.9 10.2 1.2 0.9 0.0
Taxes on Property 5.7 5.2 6.4 6.0 7.3 Taxes on Goods and Services 27.5 32.0 40.5 47.2 44.1 Import Duties 19.0 13.2 8.6 7.6 8.1 Other Taxes 14.1 11.3 8.4 0.8 1.3
Source: Central Bank of Barbados‟ Annual Statistical Digest.
Prior to the 2002-2006 tax reforms, there were three prior major tax reform efforts in Barbados‟
history in 1986, 1992 and 1997 (Howard, 2006). The 1986 tax reform system reduced the
taxable income of a large number of taxpayers, as individuals earning $15,000 or less were now
exempted and all taxpayers were provided with a standard deduction of $15,000. In the ensuing
years, the tax system was made more complex and inefficient via a system of itemised
allowances and deductions. These policy changes resulted in a significant fall in taxable income:
15.7 percent, contributing to one of the largest single fiscal deficits on record in 1990/1991. The
1992 reform effort there attempted to simplify the system and improve the efficiency of the
income tax system. The main policy changes were a reduction in standard deduction to $13,000,
a reduction in the top marginal tax rate from 50 to 40 percent and the elimination of most
itemised deductions. These policy changes were more revenue efficient and therefore resulted in
a 4 percentage point or $38.4 million increase in the contribution of personal income taxes to
overall tax receipts. The third reform in 1997 replaced a number of consumption based taxes
with a VAT system.
The most recent tax reform effort began in 2001. In the 2001 Financial Statement of Economic
and Financial Policies, the Government communicated the desire to ensure that tax rates in
Barbados were not out of sync with other regional economies. No changes were, however, made
to individual income taxes payable in this year. From 2003 onward, however, Government made
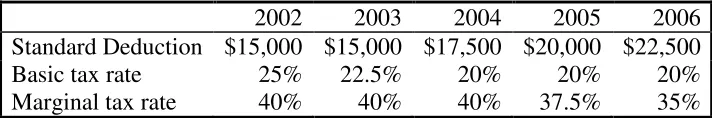
sweeping changes to both the standard deduction as well as basic and marginal tax rates. Table 2
shows that the standard deduction jumped by 50 percent: from $15,000 in 2002 to $22,500 by
2006. In addition, both the basic and marginal tax rates were lowered by 5 percentage points
[image:11.612.128.484.595.654.2]over the four year period.
Table 2: 2002-2006 Tax Reform
2002 2003 2004 2005 2006
Standard Deduction $15,000 $15,000 $17,500 $20,000 $22,500
Basic tax rate 25% 22.5% 20% 20% 20%
Although the 2002-2006 tax reform effort constituted one of the most significant changes in tax
policy in recent memory, little or no research has examined the implications of this reform. To
provide an initial investigation of the distributional impact of this change, an approach similar to
that outlined by Mascoll (1991) is employed: using income and allowance values for the
representative tax payer, the effective tax rate is calculated for three representative individuals
and the results are provided in Table 3. The results provided in the table suggest that the primary
beneficiaries of the tax change seemed to have been middle- to high-income individuals as these
representative tax payers would have experienced a three percentage point decline in their
[image:12.612.178.435.375.698.2]effective rates of tax after the 2002-2006 tax reform effort.
Table 3: Distributional Impact 2002-2006 Tax Reform on the Representative Tax Payer
Before After
INCOME
Low Income Individual
1. Gross Annual Income 25,000 25,000 2. Less Allowances 23,000 23,000 3. Taxable Income 2,000 2,000 4. Income Taxes Paid 500 400 5. Effective Tax Rate 2% 2% 6. Real after-tax Income 24,500 24,600
Middle Income Individual
1. Gross Annual Income 64,000 64,000 2. Less Allowances 27,500 27,500 3. Taxable Income 36,500 36,500 4. Income Taxes Paid 10,970 9,145 5. Effective Tax Rate 17% 14% 6. Real after-tax Income 53,030 54,855
High Income Individual
It is likely, however, that the tax reform plan may have changed the behaviour of individual tax
payers. For example, individuals might decide to increase their supply of labour to the labour
market as a result of the reduction in effective tax rates or vice versa. The results reported in
Table 3 do not take such behavioural responses into account. The following section therefore
outlines an empirical approach that can be employed to examine the behavioural response of
Barbadians to changes in marginal tax rates.
4. Empirical Approach
The empirical approach employed in this study is similar to that proposed by Gruber and Saez
(2002) who develop a microeconomic model to decompose the changes in taxable income due to
changes in marginal tax rates and after-tax income. The empirical specification of the regression
equation is of the following form:
it it t it it t it t t t i it it y T y y T y T T y y ))] ( /( )) ( log[( )] 1 /( ) 1 log[( ) / log( 1 1 1 1 1 (1)
where yit is before-tax income for individual i in period t, i and t are unobserved
individual- and time-specific effects respectively, Tit is the marginal tax rate, Tit(yit) is the tax
liability and vit is an error term that is assumed to have normal properties. The term
)] 1
/( ) 1
log[( Tt Tt1 in Equation (1) captures the effect that changes in tax rates have on
reported income, while the term log[(yit Tt (yit))/(yit1Tt1(yit1))] is the change in tax
Both of the terms on the right-hand side of Equation (1) are likely to correlated with the error
term. As a result, the equation is estimated using two stage least squares (2SLS). To control for
the endogeneity of these terms, the predicted log of net-of-tax rate change and the predicted log
of after-tax income change if there were no behavioural response if real income does not change
are employed as an instruments forlog[(1Tt )/(1Tt1)] and (yit Tt(yit))/(yit1Tt1(yit1)),
respectively.
There are a number of other factors that can impact on changes in before-tax income. If these
factors are not captured in the regression model the elasticity of income to changes in tax rates
could be imprecisely estimated. As a result, the log of initial income, age, initial age-squared, the
initial number of children and marital status are include in the regression equation. The initial
income variable captures any reversion-to-the-mean effects, while age, age-squared, the number
of children and marital status attempt to capture any life-cycle and household effects.
The observations employed in this study uses a specially generated database of randomly selected
individuals from the Inland Revenue Department of Barbados. The analysis is conducted over
the period 2003 to 2006 and provides information on all the items on the tax return form for 3000
individuals each year. Since the database provides cross-section rather than panel data, the
approach proposed by Lindsey (1987) is employed to use the four separate samples of tax returns
to approximate the difference-in-differences method to analysing the impact of changes in tax
rates. The framework ranks the taxpayers by before-tax income for all four years and then stacks
the cross-sections to create a panel. The technique therefore makes the assumption that
Table 4 provides descriptive statistics for the database. Median net income from employment
over the sample period for individuals captured in the database was $27,783, with the maximum
earnings from income for any one individual being $787,977. The median individual paid about
$1,125 in taxes after claiming $21,419 in deductions. Besides the personal allowance, the
median taxpayer also claimed about $11,211 in allowances for home improvement, savings in
credit unions as well as the purchase of new shares or mutual funds. Savings in credit unions was
the most popular allowance claimed with 35 percent of taxpayers utilising this vehicle to reduce
their tax liability. In contrast, less than one percent of tax payers utilised the allowance for
[image:15.612.71.540.347.657.2]investment in venture capital funds.
Table 4: Descriptive Statistics
Mean Median Maximum Minimum Std. Dev. Observations Age 41.666 41.000 102.000 16.000 12.571 11670 Marital Status 2.229 3.000 3.000 1.000 0.965 7956 Gender 1.472 1.000 2.000 1.000 0.499 10756 Resident 1.012 1.000 2.000 1.000 0.109 7898 Total Assessable Income 34297.630 27435.460 786976.800 -85671.000 30411.400 12000 Tot Deductions Allowed 22303.850 21419.520 65500.000 0.000 6103.351 12000 Taxable Income 13585.660 5412.515 766476.800 0.000 27329.710 12000 Tax Payable 3609.982 1118.000 301748.000 0.000 9408.222 12000 Tax Paid 3618.629 1125.000 301748.000 0.000 9415.951 12000 PAYE 4196.302 1681.030 302553.200 -2372.290 8797.850 12000 Income from Employment 35493.940 27782.740 786976.800 0.000 31802.330 11339 Net Income from Employment 32598.080 26466.480 786976.800 0.000 30172.390 12000 Income from Pensions 11824.080 0.000 170661.200 0.000 19747.620 1009 Personal Allowance 19033.490 20000.000 30000.000 0.000 3679.664 11870 Spouse Allowance 2773.014 3000.000 3000.000 0.000 793.871 793 Venture Capital Funds 1235.239 0.000 10000.000 0.000 3068.047 71 Share/Mutual Funds 5102.274 4159.800 10000.000 0.000 4321.169 711 NIS Contributions 518.453 117.580 3636.600 0.000 726.485 253 Savings in Cooperative 2012.134 2197.615 6000.000 0.000 1269.929 4190 Trade Union Subs 212.802 234.000 240.000 0.000 54.016 3430 Parliamentary Subs 422.938 0.000 5000.000 0.000 1104.356 105 Home Improvement 5040.358 4855.390 10000.000 0.000 3400.843 3567 Total Other Deductions 2648.558 321.385 35500.000 0.000 4037.276 12000
5. Results
5.1 Preliminary Estimates
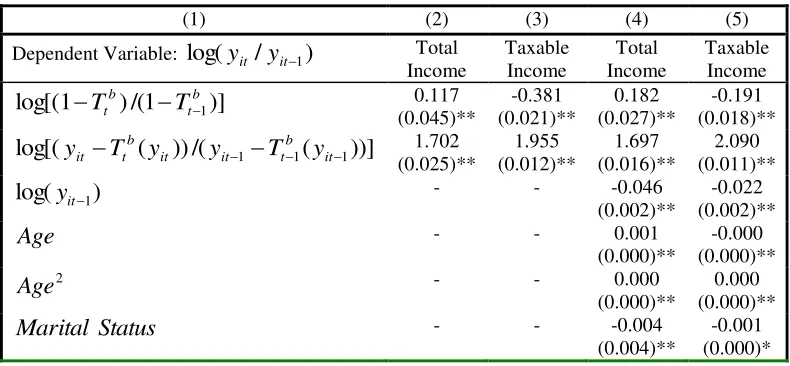
Table 5 utilises the methodology outlined in the previous section to estimate the elasticity of tax
rate changes. Two income variables are considered, total income and taxable income, with the
latter being total income adjusted for any changes in allowances. In addition, the results are
reported with and without the control variables. Looking first at the results without the control
variables, the model is able to explain about 55 percent of the fluctuation in total reported income
over the sample period (column 2). The coefficient on the marginal tax variable is positive and
statistically significant suggesting that as tax rates increase total income also rises. This result
could be associated with the impact of tax rates on labour supply decisions: if tax rates encourage
individuals to supply more labour then total income is likely to be positively associated with
marginal tax rates. The coefficient on the tax liability variable is also positive and statistically
significant and suggests that as individuals‟ after-tax income rises they are more likely to report
[image:16.612.109.504.538.721.2]higher levels of income.
Table 5: Basic Taxable Income Elasticity Estimates
(1) (2) (3) (4) (5)
Dependent Variable: log(yit /yit1) Total Income Taxable Income Total Income Taxable Income )] 1 /( ) 1
log[( Ttb Ttb1 0.117
(0.045)** -0.381 (0.021)** 0.182 (0.027)** -0.191 (0.018)** ))] ( /( )) (
log[( 1 b1 it1
t it it b t
it T y y T y
y 1.702 (0.025)** 1.955 (0.012)** 1.697 (0.016)** 2.090 (0.011)** )
log(yit1 - - -0.046
(0.002)**
-0.022 (0.002)**
Age - - 0.001
(0.000)**
-0.000 (0.000)**
2
Age - - 0.000
(0.000)**
0.000 (0.000)** Status
Marital - - -0.004
(0.004)**
Adjusted R-squared 0.549 0.900 0.622 0.904 s.e. of regression 0.054 0.025 0.042 0.023
Notes: ** and * indicates significance at the 5 percent and 10 percent level of significance, respectively.
The exclusion of important life-cycle and household effects could potentially lead to some bias in
the reported coefficient estimates in column 2. As a result, the regression model was augmented
with controls for initial income, age and marital status. The inclusion of these variables in the
regression model resulted in the elasticity of total income to changes in marginal tax rates rising
from 0.117 to 0.182: for every 1 percent increase in marginal tax rates, total income usually
increases by about 0.2 percent. In contrast, the coefficient on the tax liability variable falls
slightly to 1.697. The response of tax payers to changes in tax liability is therefore highly elastic
and could be due to the incentive effects of tax rates on tax evasion and tax avoidance.
Individuals that were previously evading taxes may be encouraged to file if their tax liability is
likely to be relatively low, while tax avoiders may not find it worthwhile to engage in complex
financial transactions to reduce their tax liability.
It is also of interest to policymakers to have an estimate of the impact that changes in marginal
tax rates have on taxable income, total reported income less any allowances and deductions. The
relationship between taxable income and marginal tax rates could provide evidence of whether or
not higher tax rates encourage filers to find vehicles to reduce their tax liability. Column 4 and 5
of Table 5 reports the taxable income elasticities. The regression results reported in the two
columns suggest that the empirical model is able to explain about 90 percent of the fluctuation in
reported taxable income in Barbados. The estimates of the elasticity of taxable income to
rates, reported taxable income decreases by about 0.4 percent. This finding therefore agrees with
a priori reasoning that higher marginal tax rates might encourage individuals to find ways of
investing their assets in ways that would reduce their taxable income and therefore their tax
liability. The elasticity estimate of 0.4 is also on par with recent estimates for the US derived by
Gruber and Saez (2002). The tax liability coefficient also reinforces this result, with a rise in
after-tax income leading to a rise in reported taxable income. When the model is augmented with
control variables to account for life-cycle and household effects, the coefficient on the tax
liability variable rises slightly. However, the elasticity of taxable income to changes in marginal
tax rate falls to about 0.2 and on par with that obtained by Saez (2003).
5.2 Income Levels
Higher income individuals more respond in different ways to tax rate changes relative to lower
income persons. Higher income individuals may be better placed to invest in assets that would
reduce their tax liability. In contrast, since lower income persons are unlikely to utilise such
instruments, they may respond to tax rate increases by reducing their labour supply. To examine
the differences in responses to marginal tax rate changes on low and high income individuals, the
lower quartile and the upper quartile of individuals were extracted from the database. Equation
(1) was then re-estimated for each of these two groups.
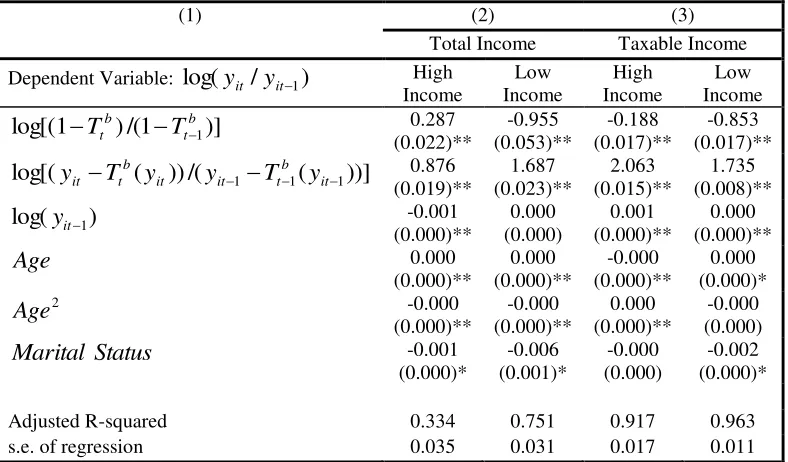
The regression results for the two groups of tax payers are provided in Table 6. Column 2 of the
table indicates that lower income individuals tend to report reduced levels of total income after an
significant disincentive effect on the amount of hours worked by lower income individuals in
Barbados. The coefficient estimate suggest that there is one-to-one relationship between changes
in tax rate and total income: for every 1 percent rise in the marginal tax rate, total reported
income of lower income tax payers tends to fall by 1 percent.
There is also a significant difference in the response of changes in total income to changes in
after-tax income for high- and low-income individuals. For lower income taxpayers, a 1 percent
rise in after-tax income elicits a greater than proportionate change in total reported income, while
for higher income filers a 1 percent rise in the after-tax income leads to a less than 1 percent
[image:19.612.111.505.402.633.2]change in total reported income.
Table 6: Taxable Income Elasticity Estimates (Income Differences)
(1) (2) (3)
Total Income Taxable Income Dependent Variable: log(yit /yit1) High
Income Low Income High Income Low Income )] 1 /( ) 1
log[( Ttb Ttb1 0.287
(0.022)** -0.955 (0.053)** -0.188 (0.017)** -0.853 (0.017)** ))] ( /( )) (
log[(yit Ttb yit yit1Ttb1 yit1 0.876 (0.019)** 1.687 (0.023)** 2.063 (0.015)** 1.735 (0.008)** )
log(yit1 -0.001
(0.000)** 0.000 (0.000) 0.001 (0.000)** 0.000 (0.000)** Age 0.000 (0.000)** 0.000 (0.000)** -0.000 (0.000)** 0.000 (0.000)* 2 Age -0.000 (0.000)** -0.000 (0.000)** 0.000 (0.000)** -0.000 (0.000) Status Marital -0.001 (0.000)* -0.006 (0.001)* -0.000 (0.000) -0.002 (0.000)*
Adjusted R-squared 0.334 0.751 0.917 0.963 s.e. of regression 0.035 0.031 0.017 0.011
Table 6 also attempts to measure the differences in the reported taxable income of low- and
high-income taxpayers to changes in the marginal tax rate. The elasticity of taxable high-income to changes
in the marginal tax rate was approximately 4.5 times larger than that for high income individuals:
for every 1 percent rise in the marginal tax rate, taxable income decreases by 0.8 percent,
compared to 0.2 percent for high income tax payers. This result could be driven by the strong
labour supply response of low income taxpayers reported early that offsets the advantages high
income individuals may have in terms of tax planning.
5.3 Gender
Aaberge et al. (1999) and Smith et al. (2003) both suggest that the labour supply responses of
females may differ from that for males. For women, children can have a major impact on their
labour supply decisions. Tax rate changes impact on these decisions by influencing the
opportunity costs staying out of the labour force. Prohibitively high marginal tax rates reduces
the opportunity cost of staying out of or leaving the labour force, while relatively lower marginal
tax rates raises the opportunity cost and might therefore encourage more women to enter the
labour force. If marginal tax rates have a relatively greater impact on the opportunity cost of
staying out of the labour force for women relative to men, then the elasticity of income to
changes in marginal taxes should be larger for females.
Table 7 provides the elasticities disaggregated by for different genders. The elasticity estimates
provided in column 2 are in general agreement with a priori expectations: the coefficient on
therefore tend to be more responsive to tax rate changes than males, supplying relatively more
labour when the tax rate increases and reducing their working hours as the tax rate decreases. In
terms of income responses to changes in after-tax income, there is relatively little difference in
the responses of the two groups.
In terms of the impact of marginal tax rate changes on taxable income, the result was quite
similar to that obtained earlier for total income. Females on average tend to report a significantly
larger fall in taxable income as a result of a rise in the marginal tax rate. The elasticity of taxable
[image:21.612.111.502.375.601.2]income to changes in marginal tax rates was about one quarter larger than that for males.
Table 7: Taxable Income Elasticity Estimates (Gender Differences)
(1) (2) (3)
Total Income Taxable Income Dependent Variable: log(yit /yit1) Males Females Males Females
)] 1
/( ) 1
log[( b1
t b
t T
T
0.146 (0.042)** 0.284 (0.032)** -0.191 (0.021)** -0.238 (0.018)** ))] ( /( )) (
log[(yit Ttb yit yit1Ttb1 yit1 1.786 (0.026)** 1.626 (0.018)** 2.115 (0.013)** 2.023 (0.010)** )
log(yit1 -0.000
(0.000)* -0.001 (0.000)** 0.000 (0.000) 0.000 (0.000)** Age 0.001 (0.000)** 0.000 (0.000)** -0.000 (0.000)** -0.000 (0.000)** 2 Age -0.000 (0.000)** -0.000 (0.000)** 0.000 (0.000)** 0.000 (0.000)** Status Marital -0.004 (0.001)** -0.001 (0.001)* 0.001 (0.000)** -0.001 (0.000)*
Adjusted R-squared 0.625 0.618 0.917 0.887 s.e. of regression 0.035 0.026 0.017 0.016
6. Conclusions
Over the last five years, fiscal authorities in Barbados have made significant changes to the
income tax structure in Barbados. The 2002-2006 tax reform effort was probably one of the most
noteworthy of the all the tax reform efforts were undertaken in the country. During the period,
the standard deduction rose by 50 percent and both the basic and marginal tax rates fell by 5
percentage points. These changes in the deductions as well as tax rates primarily benefited
middle- to high-income individuals, with their marginal tax rates fall by about 3 percent,
compared to no change for low-income individuals.
Changes in marginal tax rates can have an impact on the labour supply decisions of economic
agents, as well as their efforts to either avoid or evade taxes. Previous research on the elasticity
of taxable income to changes in marginal tax rates suggest that a reasonable estimate lies between
1 and 0.2 percent. These results, however, were derived using data for the US and therefore are
only of academic interest to Barbadian policymakers as these estimates can not be employed to
forecast the effects of future tax reform efforts. To provide estimates of the taxable income
elasticity for Barbados, an annual database of individual taxpayers is obtained for the period 2003
to 2006. In each year a random sample of 3,000 tax payers is observed.
Based on panel regression techniques, the study finds that for every 1 percent rise in marginal tax
rates in Barbados total income of tax payers usually increases by about 0.2 percent. This result
seems to suggest that economic agents in Barbados, on average, tend to respond to higher tax
rates by increasing their labour supply. In relation to taxable income, in contrast, higher marginal
in marginal tax rates leads to a 0.2 percent reduction in taxable income. The disincentive effect is
even larger for low-income individuals and females.
The findings reported in this study can not only be employed to forecast the effects of future
changes in tax rates, but can also inform the overall process of conceptualising tax reform. The
study suggest that rather than having higher rates of tax, fiscal authorities should attempt to have
a relative broad tax base with relatively low rates of marginal taxes. Policymakers must also be
cognisant of the impact that tax rate changes can have on the supply of labour and by extension
growth and productivity. While higher tax rates may lead to a marginal gain in tax revenues,
these gains may come at the cost of lower hours worked, overtime and decision of individuals of
References
Aaberge, R., Colombino, U. and Strøm, S. (1999) “Labour Supply in Italy: An Empirical
Analysis of Joint Household Decisions with Taxes and Quantity Constraints,” Journal of
Applied Econometrics 14(4): 403-422.
Auten, G. and Carroll, R. (1999) “The Effect of Income Taxes on Household Income,” Review of
Economics and Statistics 81(4): 681-693.
Bleaney, M., Gemmell, N. and Kneller, R. (2001) “Testing the Endogenous Growth Model:
Public Expenditure, Taxation, and Growth over the Long Run,” Canadian Journal of
Economics, 34(1): 36-57.
Gills, M. (1989) Tax Reform in Developing Countries (Fiscal Reform in the Developing World).
Duke University Press, Durham, NC.
Goolsbee, A. (2000) “What Happens When You Tax the Rich? Evidence from Executive
Compensation,” Journal of Political Economy 108(2): 352-378.
Gruber, J. and Saez, E. (2002) “The Elasticity of Taxable Income: Evidence and Implications,”
Journal of Public Economics 84(): 1-32.
Hayek, F.A. (1960) The Constitution of Liberty. University of Chicago Press, Chicago.
Helms, L.J. (1985) “The Effect of State and Local Taxes on Economic Growth: A Time Series –
Cross Section Approach,” Review of Economics and Statistics, 67(4): 574-582.
Hines, J.R. (1996) “Altered States: Taxes and the Location of Foreign Direct Investment in
America,” American Economic Review, 86(5): 1076-1094.
Howard, M. (2006) The Economic Development of Barbados. University of the West Indies
Feldstein, M. (1995) “The Effect of Marginal Tax Rates on Taxable Income: A Panel Study of
the 1986 Tax Reform Act,” Journal of Political Economy 103(3): 551-572.
Gruber, J. and Saez, E. (2000) “The Elasticity of Taxable Income: Evidence and Implications,”
Journal of Public Economics 84(1): 1-32.
Karras, G. (1999) “Taxes and Growth: Testing the Neoclassical and Endogenous Growth
Models,” Contemporary Economic Policy, 17(2): 177-188.
Lindsey, L. (1987) “Individual Taxpayer Response to Tax Cuts: 1982-1984, with Implications for
the Revenue Maximising Tax Rate,” Journal of Public Economic 33: 173-206.
Long, J.E. (1999) “The Impact of Marginal Tax Rates on Taxable Income: Evidence from State
Income Tax Differentials,” 65(4): 855-869.
Mascoll, C. (1991) “Trends in Representative Tax Rates of Representative Individuals in
Barbados during the 1980s,” Central bank of Barbados’ Economic Review 18: xxx-xxx.
Saez, E. (2003) “The Effect of Marginal Tax Rates on Income: A Panel Study of „Bracket
Creep‟,” Journal of Public Economics 87(): 1231-1258.
Smith, N., Dex, S., Vlasblom, J.D. and Callan, T. (2003) “The Effects of Taxation on Married