BIROn - Birkbeck Institutional Research Online
Szkop, Krzysztof and Nobeli, Irene (2017) Untranslated parts of genes
interpreted: making heads or tails of high-throughput transcriptomic data via
computational methods. BioEssays 39 (12), ISSN 0265-9247.
Downloaded from:
Usage Guidelines:
Please refer to usage guidelines at or alternatively
Making heads or tails of the untranslated parts of genes:
computational
methods
applied
to
high-throughput
transcriptomic data
Krzysztof J. Szkop1 and Irene Nobeli1,$
1. Institute of Structural and Molecular Biology, Department of Biological Sciences, Birkbeck, Malet Street, London WC1E 7HX, UK.
$ Corresponding author email: [email protected]
Subtitle
Computational methods to discover and quantify isoforms with alternative untranslated regions
Keywords
Alternative poly-adenylation; alternative transcription start site; untranslated region; RNA-seq
Abbreviations
APA,alternative poly-adenylation; PCS, poly-adenylation and cleavage site; RNA-seq, RNA sequencing; TSS, transcription start site; UTR, untranslated region.
Summary
and suggest that computational methods applied to standard high-throughput technologies are a useful alternative to the expertise-demanding 5’ and 3’ sequencing. We present a number of computational approaches for the discovery and quantification of alternative transcription start and poly-adenylation events, focusing on technical challenges and arguing for the need to include better normalization of the data and more appropriate statistical models of the expected variation in the signal.
Introduction
The development of high-throughput technologies for transcriptome profiling has allowed us unprecedented access to the ensemble of RNA transcripts in and out of the cell. Evidence from a growing number of studies suggests that both the extent of the RNA repertoire and its complexity have been vastly underestimated[1]. Nearly a decade after the introduction of next-generation sequencing technologies for surveying the transcriptome, it is still possible to find novel splicing junctions that were originally overlooked because of low expression of the corresponding transcripts[2]. Although the term “gene” [3] has served geneticists well as the unit of heredity, a complete understanding of the workings of a cell at the molecular level dictates a shift from a gene-level to a transcript (or “isoform”)-level analysis.
conditions that allow cryptic sites to become sufficiently utilized resulting in novel transcription products.
The lack of comprehensive annotation is a barrier to analyzing transcriptomic data but could be overcome by methods that deduce the transcript structure directly from the data. Although tempting, this approach presents several challenges. Reconstructing the transcriptome from a pool of sequenced transcript fragments and quantifying the relative expression of isoforms is only straightforward in the simplest scenario of one gene producing a single transcript (see relevant reviews by [18-21] for a more thorough coverage of the challenges associated with transcriptome reconstruction and isoform quantification). In addition to the problems shared with methods that attempt to quantify alternative splicing events, methods for probing the ends of transcripts are plagued by technical issues linked to biases in next-generation sequencing technologies, as discussed below. Sequencing of whole transcripts, as promised by the more recent third-generation sequencing technologies (nanopores and the single molecule real-time technology (SMRT) platforms), would potentially eliminate these issues. Early successes in this direction [22-25] are very promising, but there is disagreement in the literature about the error rate associated with nanopore sequencing[26-28]. Clearly, these technologies are still under active development and many of the technical challenges, such as variability of the time intervals used to identify each base, are unresolved [29]. The challenges associated with sequencing cDNA with nanopores are also hampering direct RNA sequencing with this technology, and in addition, there is less evidence in this case that coverage of the transcriptome is to a satisfactory degree. One recent non-peer reviewed study[30] suggests promising results but also makes it clear that the timeframe required for nanopores to deliver on their promises remains uncertain.
second option, with a brief description of experimental methods aimed at capturing the transcript ends of a gene given in Box 2. The latter methods are obviously necessary for benchmarking computational approaches. In summary, there are a variety of methods that have been developed for probing both TSS and PCS at nucleotide resolution. Many have been used already to provide us with great insights on the differential use of transcript ends in different tissues, stages of development or disease. However, we believe that the availability of these specialized methods to the wider research community remains a challenge. The majority of these methods are still only accessible to research groups that have the necessary expertise, funds and laboratory set ups to carry out the often complex and laborious protocols involved. Until these targeted methods become more widely accessible, bioinformatics approaches will constitute a much-needed alternative solution. In this spirit, we review below computational approaches for discovering and quantifying the use of alternative TSS and PCS from standard transcriptomic data.
Computational prediction of alternative TSS and PCS from standard
transcriptomic data
Some of the earliest estimates of the use of alternative TSS/PCS have their origin in studies that were focused on alternative splicing and, in the absence of microarray and next-generation sequencing data, relied on Expressed Sequence Tag (EST) contigs and pioneering spliced aligners to identify splicing events. Although these studies did not explicitly set out to identify alternative TSS and PCS, they did discover large numbers of alternative splicing events in the untranslated regions ([47-49]) and often gave information on the predicted starts and ends of transcripts based on ESTs. It was the advent of high-throughput transcriptomic technologies though that fuelled an interest in exploring transcripts in detail, including the diversity of untranslated regions. Below, we concentrate on bioinformatics methods developed for and applied to the more recent transcriptomic data from microarray and RNA-seq experiments.
Quantifying the use of alternative TSS and PCS from microarray data is limited by probe design and signal variability
probes across the 3’UTR to satisfactorily cover alternative-length transcript tails (Fig. 2A). As a consequence, there have been only few attempts to quantify alternative poly-adenylation site selection using these arrays and, to our knowledge, the only study that proposed a method for mapping both ends of a transcript from microarray data utilized a high-density tiling array covering the whole genomic sequence of Saccharomyces cerevisiae[50].
All methods developed to find alternative PCS using microarray data rely on the fact that microarray chips use “probe sets” rather than individual probes to quantify the expression of a gene. Most microarray analysis protocols group probes together, if they correspond to sequences derived from the same gene/transcript/exon, thus summarizing probe values to the appropriate feature level. However, if the individual probes cover both the part of the transcript before and after a poly-adenylation site, then it is possible to extract information about the relative use of the “short” and “long” tailed transcripts in different conditions by calculating the ratio of expression for the probes up- and down-stream of that site. When applied to 3’UTR events, these methods benefit from the fact that UTRs often lack introns (less than ~10% of all annotated introns are located outside the protein-coding region[51]) and hence alternative splicing is less likely to interfere with the APA signal. Similarly, limiting the search to the last exon or employing microarrays with probes heavily biased towards the 3’UTR further focuses the method on events due to alternative poly-adenylation. Although theoretically straightforward and computationally easy to implement, comparing levels of individual probes is hindered by the variability in probe signal whose origins are technical rather than biological. Our recent experience working with several published datasets agrees with earlier studies [52, 53] suggesting that the expression levels of individual probes vary widely due to biases such as the probe location within the transcript or the similarity of the sequence probe to sequences originating from other non-target genes.
probe-specific variations and normalizing for gene-level intensities. This approach relies on prior knowledge of the PCS (Sandberg et al used EST-supported poly(A) sites), as does the more recent APAdetect method[55] which relies on poly(A) sites from the PolyA_DB database[56]. In contrast, the Rmodel
method[57], implemented as a package in R, allows identification of novel events by comparing individual probe expression ratios in two conditions along the gene body and identifying the optimum segmentation point using a modified t -test. More recently, Li et al[58] replaced the modified t-test in Rmodel with a Bayesian analysis following the method of Erdman & Emerson[59] implemented in the R package bcp[60]. In their approach, a list of tandem 3’UTRs is first constructed from the coordinates of known transcripts with identical 3’ UTR start sites but different poly-adenylation sites. Then, the change point is identified as the probe with the highest posterior change probability. Finally, the fold change between the expression levels of the common and extended regions is calculated, filtering out insignificant or unreliably measured changes.
Although the methods described above are promising, their performance is highly dependent on the microarray design, as well as the quality of the signal at the individual probe level. To improve performance, methods usually employ some form of filtering to exclude “outlier” probes whose intensities lie on the extremes of the distribution defined by the intensities of probes belonging to a given set. However, in the case of a small number of probes (<10), a distribution would be difficult to define with any confidence, making the identification of outliers a practice of debatable value. Additionally, “size” filters can be applied to exclude transcripts that do not have enough probes covering the area of interest. In practice, however, these filters may be set at unrealistically small cut-offs (APAdetect[55], for example, eliminates transcripts with a single distal or proximal probe) meaning that as few as two probes may be considered acceptable, although it is clear that the statistical value of a comparison of intensities between control and condition samples in this case would be questionable.
samples originating from distinct conditions. The recent introduction of the Affymetrix Human Transcriptome Array 2.0 is a promising step in the right direction with increased coverage of both the 5’ and 3’ UTR of a substantial part of protein-coding isoforms. Although, the platform remains largely unexplored in this aspect, it appears that it has the potential to be used for this type of analysis. However, it should be kept in mind that even probes in this array cover on average ~70% of the 5’ human UTRs but less than 40% of the 3’ and (Fig. 2B), limiting its applicability to a subset of annotated genes.
RNA-seq can reveal alternative TSS and PCS events but accounting for technical biases is not trivial
derived from ribosome depletion, the 3’ end is not protected and read coverage is generally lower at both 5’ and 3’ ends[62]. Despite these challenges, the reasonable coverage of 3’ ends by RNA-seq reads in combination with the promise of potential discovery of novel sites, has prompted the development of a variety of methods for the analysis of alternative PCS using next-generation sequencing data. It should be obvious here that for all computational methods that rely on changes in the expression signal, rather than sequence or structure motifs, the two ends of the transcript are indistinguishable; a method defined for one end would generally be applicable to both ends, with only minor modifications.
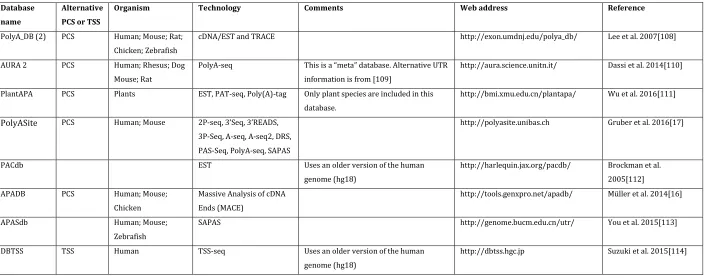
Current computational tools fall into either of two major categories: Those that rely on existing annotations of TSS/PCS and aim only to quantify the different-length isoforms and those able to predict the position of the transcript ends from the distribution of RNA-seq reads. Tools from the first category are clearly more limited in their applicability as databases are currently focused on a limited number of tissues and organisms, and as highlighted earlier, it is debatable that any single one used in isolation comprehensively covers all potential alternative events (Table 1 summarises web-accessible databases with information on alternative PCS and TSS).
portion of the gene that belongs to the long isoform only (‘POST’), or the portion that is common to the short and long isoforms (‘PRE’). The ratio of short to long isoform expression is then estimated, taking into account the length of each isoform. The statistical significance of the difference between PRE and POST counts in two samples (e.g. treatment versus control) is assessed using a Fisher test. This approach, like others that attempt to estimate the actual isoform expression, assumes that reads are uniformly distributed along the length of the transcript, an assumption that is unlikely to be true in any real RNA-seq dataset.
Methods that rely on transcript reconstruction are computationally expensive and must solve the problem of assigning reads to overlapping isoforms
same exons. In these cases, the short isoform is embedded in the long and reads originating from the part of the transcript common to both isoforms cannot be assigned to short or long in a straightforward manner. Hence, methods that rely on reconstruction of transcripts based on their exon composition will almost certainly fail to identify alternative PCS or correctly deduce their relative use across samples.
reads have at least 6 As at the end, a percentage consistent with that obtained for other datasets we have examined in the past. A more thorough analysis by Kim et al.[73] found just over 10% of 130 million unmapped reads had at least two untemplated As in their 3’end, and following removal of these As only ~0.1% of the original reads could be uniquely mapped to the genome. The reads that mapped successfully provided poly-adenylation cleavage site information for just ~2000 protein-coding genes, suggesting that reads with untemplated As are of limited use in the analysis of APA events. In our opinion, the fact that fairly complex de novo reconstruction protocols are actually limited by the relatively trivial step of identifying poly(A) stretches at the end of reads makes them less attractive for analyzing the 3’ end of transcripts. In addition, this approach is clearly not suitable for the 5’ end, where no equivalent sequence signals the beginning of the transcript.
Detection of read density fluctuations in RNA-seq data allows the discovery of novel events but is prone to high false positive rates
the expected read counts may be a more suitable alternative, especially if they allow the error distribution to account for overdispersion. In addition, such models can naturally accommodate the presence of covariates, as implemented in the Generalised Linear Models included in the differential expression software solutions offered by DESeq2[82] and EdgeR[83].
More sophisticated methods for detecting and quantifying alternative poly-adenylation (as well as alternative TSS selection) are likely to be inspired by methods concentrating on the identification of alternative splicing events from RNA-seq data. The recently proposed change-point model that discovers splicing events in the 5’ and 3’ end of transcripts[84] is a promising step towards a more statistically robust method at finding read-density fluctuations in transcriptomic data. It uses negative binomial distributions with different parameters to describe read coverage in the common and extended regions of two isoforms separated by a splicing event. Additionally, it utilises annotation information or splice junction reads to assign different weights to each position, thus affecting the prior probability of each being a change-point. It is easy to see how a poly-adenylation sequence signal could be used in a similar manner when searching for isoforms that share the same splicing events but differ in their UTR lengths. Finally, the method employs an empirical Bayes estimator that allows pooling information across genes and results in powerful and accurate predictions of the change-points in the data.
As annotation of TSS and PCS becomes more complete and computational methods for the detection of alternative UTRs from high-throughput transcriptomic data mature, it is likely that initiatives will be set up to facilitate the study of the 5’ and 3’ UTRs using a combination of databases and software. In this spirit, the recently established expressRNA site (http://www.expressrna.org/) offers an integration of computational tools for the analysis of APA events. This and other future initiatives promise a more detailed, and ultimately more accurate, picture of the transcriptome.
The undisputed functional role of untranslated regions in eukaryotic regulation of gene expression dictates an emphasis on the development of isoform-centric approaches to data analysis. Until sequencing methods directed at both untranslated regions become widely accessible, it is important to focus on the easier to implement and more cost-effective computational approaches that can be applied to data from standard transcriptomic experiments. Methods aimed at identifying the TSS and PCS from the expression signals are of particular interest, as it remains debatable whether current annotations can be used reliably in the case of biological samples originating from conditions that have not been studied before. Importantly, although many existing methods were developed to study only one end of the transcripts, many have the potential to be applied to both transcript ends, allowing for a complete analysis of the transcriptome, given enough coverage.
Conflict of interest
The authors declare they have no conflict of interest in the production of this manuscript.
References
1. Mercer TR, Gerhardt DJ, Dinger ME, Crawford J, et al. 2012. Targeted RNA sequencing reveals the deep complexity of the human
transcriptome. Nat. Biotechnol.30: 99–104.
2. Nellore A, Jaffe AE, Fortin J-P, Alquicira-Hernández J, et al. 2016. Human splicing diversity and the extent of unannotated splice junctions across human RNA-seq samples on the Sequence Read Archive. Genome Biol.17: 266.
3. Johannsen W. 1913. Elemente der exakten Erblichkeitslehre. Jena: Fischer.
4. Winter J, Kunath M, Roepcke S, Krause S, et al. 2007. Alternative polyadenylation signals and promoters act in concert to control tissue-specific expression of the Opitz Syndrome gene MID1. BMC Mol. Biol.8: 105.
5. Mignone F, Gissi C, Liuni S, Pesole G. 2002. Untranslated regions of mRNAs. Genome Biol.3: REVIEWS0004.
6. Barrett LW, Fletcher S, Wilton SD. 2012. Regulation of eukaryotic gene expression by the untranslated gene regions and other non-coding elements. Cell. Mol. Life Sci.69: 3613–34.
7. Hsin-Sung Yeh JY. 2016. Alternative Polyadenylation of mRNAs: 3′-Untranslated Region Matters in Gene Expression. Molecules and Cells39: 281–5.
8. Miura P, Sanfilippo P, Shenker S, Lai EC. 2014. Alternative polyadenylation in the nervous system: to what lengths will 3' UTR extensions take us? Bioessays36: 766–77.
9. Lianoglou S, Garg V, Yang JL, Leslie CS, et al. 2013. Ubiquitously transcribed genes use alternative polyadenylation to achieve tissue-specific expression. Genes Dev.27: 2380–96.
10. MacDonald CC, McMahon KW. 2010. Tissue-specific mechanisms of alternative polyadenylation: testis, brain, and beyond. Wiley Interdiscip Rev RNA1: 494–501.
untranslated regions of mRNAs by alternative polyadenylation during mouse embryonic development. Proc. Natl. Acad. Sci. U.S.A.106: 7028– 33.
12. Shepard PJ, Choi E-A, Lu J, Flanagan LA, et al. 2011. Complex and dynamic landscape of RNA polyadenylation revealed by PAS-Seq. RNA
17: 761–72.
13. Park JY, Li W, Zheng D, Zhai P, et al. 2011. Comparative analysis of mRNA isoform expression in cardiac hypertrophy and development reveals multiple post-transcriptional regulatory modules. PLoS ONE6: e22391.
14. Fu Y, Sun Y, Li Y, Li J, et al. 2011. Differential genome-wide profiling of tandem 3' UTRs among human breast cancer and normal cells by high-throughput sequencing. Genome Res.21: 741–7.
15. Curinha A, Oliveira Braz S, Pereira-Castro I, Cruz A, et al. 2014.
Implications of polyadenylation in health and disease. Nucleus5: 508–19.
16. Müller S, Rycak L, Afonso-Grunz F, Winter P, et al. 2014. APADB: a database for alternative polyadenylation and microRNA regulation events. Database (Oxford)2014: bau076–6.
17. Gruber AJ, Schmidt R, Gruber AR, Martin G, et al. 2016. A
comprehensive analysis of 3' end sequencing data sets reveals novel polyadenylation signals and the repressive role of heterogeneous ribonucleoprotein C on cleavage and polyadenylation. Genome Res.26: 1145–59.
18. Steijger T, Abril JF, Engström PG, Kokocinski F, et al. 2013. Assessment of transcript reconstruction methods for RNA-seq. Nat. Methods10: 1177–84.
19. Angelini C, De Canditiis D, De Feis I. 2014. Computational approaches for isoform detection and estimation: good and bad news. BMC
Bioinformatics15: 135.
20. Kanitz A, Gypas F, Gruber AJ, Gruber AR, et al. 2015. Comparative assessment of methods for the computational inference of transcript isoform abundance from RNA-seq data. Genome Biol.16: 150.
21. Hayer KE, Pizarro A, Lahens NF, Hogenesch JB, et al. 2015. Benchmark analysis of algorithms for determining and quantifying full-length mRNA splice forms from RNA-seq data. Bioinformatics31: 3938–45.
22. Sharon D, Tilgner H, Grubert F, Snyder M. 2013. A single-molecule long-read survey of the human transcriptome. Nat. Biotechnol.31: 1009– 14.
connectivity in complex mRNAs by nanopore sequencing. Genome Biol.
16: 204.
24. Hoenen T, Groseth A, Rosenke K, Fischer RJ, et al. 2016. Nanopore Sequencing as a Rapidly Deployable Ebola Outbreak Tool. Emerging Infect. Dis.22: 331–4.
25. Quick J, Loman NJ, Duraffour S, Simpson JT, et al. 2016. Real-time, portable genome sequencing for Ebola surveillance. Nature530: 228–32.
26. Laver T, Harrison J, O'Neill PA, Moore K, et al. 2015. Assessing the performance of the Oxford Nanopore Technologies MinION. Biomol Detect Quantif3: 1–8.
27. Jain M, Fiddes IT, Miga KH, Olsen HE, et al. 2015. Improved data analysis for the MinION nanopore sequencer. Nat. Methods12: 351–6.
28. Loman NJ, Quick J, Simpson JT. 2015. A complete bacterial genome assembled de novo using only nanopore sequencing data. Nat. Methods
12: 733–5.
29. Deamer D, Akeson M, Branton D. 2016. Three decades of nanopore sequencing. Nat. Biotechnol.34: 518–24.
30. Garalde DR, Snell EA, Jachimowicz D, Heron AJ, et al. 2016. Highly parallel direct RNA sequencing on an array of nanopores. bioRxiv : 068809.
31. Salamov AA, Solovyev VV. 1997. Recognition of 3'-processing sites of human mRNA precursors. Comput. Appl. Biosci.13: 23–8.
32. Tabaska JE, Zhang MQ. 1999. Detection of polyadenylation signals in human DNA sequences. Gene231: 77–86.
33. Graber JH, McAllister GD, Smith TF. 2002. Probabilistic prediction of Saccharomyces cerevisiae mRNA 3'-processing sites. Nucleic Acids Res.
30: 1851–8.
34. Legendre M, Gautheret D. 2003. Sequence determinants in human polyadenylation site selection. BMC Genomics4: 7.
35. Cheng Y, Miura RM, Tian B. 2006. Prediction of mRNA polyadenylation sites by support vector machine. Bioinformatics22: 2320–5.
36. Ohler U, Niemann H, Liao Gc, Rubin GM. 2001. Joint modeling of DNA sequence and physical properties to improve eukaryotic promoter recognition. Bioinformatics17 Suppl 1: S199–206.
38. Havukkala I, Vanderlooy S. 2007. On the reliable identification of plant sequences containing a polyadenylation site. J. Comput. Biol.14: 1229– 45.
39. Ahmed F, Kumar M, Raghava GPS. 2009. Prediction of polyadenylation signals in human DNA sequences using nucleotide frequencies. In Silico Biol. (Gedrukt)9: 135–48.
40. Akhtar MN, Bukhari SA, Fazal Z, Qamar R, et al. 2010. POLYAR, a new computer program for prediction of poly(A) sites in human sequences.
BMC Genomics11: 646.
41. Kalkatawi M, Rangkuti F, Schramm M, Jankovic BR, et al. 2012.
Dragon PolyA Spotter: predictor of poly(A) motifs within human genomic DNA sequences. Bioinformatics28: 127–9.
42. Xie B, Jankovic BR, Bajic VB, Song L, et al. 2013. Poly(A) motif prediction using spectral latent features from human DNA sequences.
Bioinformatics29: i316–25.
43. Cui H, Wang J. 2013. Machine Learning-Based Approaches Identify a Key Physicochemical Property for Accurately Predicting
Polyadenlylation Signals in Genomic Sequences. In Intelligent Computing Theories and Technology. Springer Berlin Heidelberg. p 277–85.
44. Lee T-Y, Chang W-C, Hsu JB-K, Chang T-H, et al. 2012. GPMiner: an integrated system for mining combinatorial cis-regulatory elements in mammalian gene group. BMC Genomics13 Suppl 1: S3.
45. Tzanis G, Kavakiotis I, Vlahavas I. 2011. PolyA-iEP: A data mining method for the effective prediction of polyadenylation sites. Expert Systems with Applications38: 12398–408.
46. Tian B, Graber JH. 2012. Signals for pre-mRNA cleavage and polyadenylation. Wiley Interdiscip Rev RNA3: 385–96.
47. Mironov AA, Fickett JW, Gelfand MS. 1999. Frequent alternative splicing of human genes. Genome Res.9: 1288–93.
48. Brett D, Hanke J, Lehmann G, Haase S, et al. 2000. EST comparison indicates 38% of human mRNAs contain possible alternative splice forms. FEBS Lett.474: 83–6.
49. Modrek B, Resch A, Grasso C, Lee C. 2001. Genome-wide detection of alternative splicing in expressed sequences of human genes. Nucleic Acids Res.29: 2850–9.
50. Huber W, Toedling J, Steinmetz LM. 2006. Transcript mapping with high-density oligonucleotide tiling arrays. Bioinformatics22: 1963–70.
why we should stop ignoring them. Bioessays34: 1025–34.
52. Li C, Wong WH. 2001. Model-based analysis of oligonucleotide arrays: Expression index computation and outlier detection. PNAS98: 31–6.
53. Cambon AC, Khalyfa A, Cooper NGF, Thompson CM. 2007. Analysis of probe level patterns in Affymetrix microarray data. BMC Bioinformatics
8: 146.
54. Sandberg R, Neilson JR, Sarma A, Sharp PA, et al. 2008. Proliferating Cells Express mRNAs with Shortened 3' Untranslated Regions and Fewer MicroRNA Target Sites. Science320: 1643–7.
55. Akman HB, Oyken M, Tuncer T, Can T, et al. 2015. 3' UTR Shortening and EGF signaling: Implications for breast cancer. Hum. Mol. Genet.24: ddv391–6920.
56. Zhang H, Hu J, Recce M, Tian B. 2005. PolyA_DB: a database for mammalian mRNA polyadenylation. Nucleic Acids Res.33: D116–20.
57. Salisbury J, Hutchison KW, Wigglesworth K, Eppig JJ, et al. 2009. Probe-level analysis of expression microarrays characterizes isoform-specific degradation during mouse oocyte maturation. PLoS ONE4: e7479.
58. Li L, Wang D, Xue M, Mi X, et al. 2014. 3'UTR shortening identifies high-risk cancers with targeted dysregulation of the ceRNA network. Scientific Reports4: 5406.
59. Erdman C, Emerson JW. 2008. A fast Bayesian change point analysis for the segmentation of microarray data. Bioinformatics24: 2143–8.
60. Erdman C, Emerson JW. 2007. bcp: an R package for performing a Bayesian analysis of change point problems. J. Stat. Soft.
61. Wang Z, Gerstein M, Snyder M. 2009. RNA-Seq: a revolutionary tool for transcriptomics. Nat. Rev. Genet.10: 57–63.
62. Sigurgeirsson B, Emanuelsson O, Lundeberg J. 2014. Sequencing degraded RNA addressed by 3' tag counting. PLoS ONE9: e91851.
63. Katz Y, Wang ET, Airoldi EM, Burge CB. 2010. Analysis and design of RNA sequencing experiments for identifying isoform regulation. Nat. Methods7: 1009–15.
64. Wang ET, Sandberg R, Luo S, Khrebtukova I, et al. 2008. Alternative isoform regulation in human tissue transcriptomes. Nature456: 470–6.
66. Le Pera L, Mazzapioda M, Tramontano A. 2015. 3USS: a web server for detecting alternative 3'UTRs from RNA-seq experiments. Bioinformatics
31: 1845–7.
67. Birol I, Raymond A, Chiu R, Nip KM, et al. 2015. Kleat: cleavage site analysis of transcriptomes. Pac Symp Biocomput : 347–58.
68. Haas BJ, Delcher AL, Mount SM, Wortman JR, et al. 2003. Improving the Arabidopsis genome annotation using maximal transcript alignment assemblies. Nucleic Acids Res.31: 5654–66.
69. Pickrell JK, Marioni JC, Pai AA, Degner JF, et al. 2010. Understanding mechanisms underlying human gene expression variation with RNA sequencing. Nature464: 768–72.
70. Smibert P, Miura P, Westholm JO, Shenker S, et al. 2012. Global patterns of tissue-specific alternative polyadenylation in Drosophila. Cell Rep1: 277–89.
71. Bonfert T, Friedel CC. 2017. Prediction of Poly(A) Sites by Poly(A) Read Mapping. PLoS ONE12: e0170914.
72. Bayerlová M, Klemm F, Kramer F, Pukrop T, et al. 2015. Newly Constructed Network Models of Different WNT Signaling Cascades Applied to Breast Cancer Expression Data. PLoS ONE10: e0144014.
73. Kim M, You B-H, Nam J-W. 2015. Global estimation of the 3'
untranslated region landscape using RNA sequencing. Methods83: 111– 7.
74. Nagalakshmi U, Wang Z, Waern K, Shou C, et al. 2008. The transcriptional landscape of the yeast genome defined by RNA sequencing. Science320: 1344–9.
75. Wu Z, Wang X, Zhang X. 2011. Using non-uniform read distribution models to improve isoform expression inference in RNA-Seq.
Bioinformatics27: 502–8.
76. Roberts A, Trapnell C, Donaghey J, Rinn JL, et al. 2011. Improving RNA-Seq expression estimates by correcting for fragment bias. Genome Biol.12: R22.
77. Lu J, Bushel PR. 2013. Dynamic expression of 3' UTRs revealed by Poisson hidden Markov modeling of RNA-Seq: implications in gene expression profiling. Gene527: 616–23.
78. Wang W, Wei Z, Li H. 2014. A change-point model for identifying 3'UTR switching by next-generation RNA sequencing. Bioinformatics30: 2162– 70.
alternative 3' UTR annotation using multiple change-point inference.
RNA21: 14–27.
80. Xia Z, Donehower LA, Cooper TA, Neilson JR, et al. 2014. Dynamic analyses of alternative polyadenylation from RNA-seq reveal a 3'-UTR landscape across seven tumour types. Nat Commun5: 5274.
81. Tan Y-D, Deng J, Neilson JR. 2015. RAX2: a genome-wide detection method of condition-associated transcription variation. Nucleic Acids Res.
43: e96–6.
82. Love MI, Huber W, Anders S. 2014. Moderated estimation of fold change and dispersion for RNA-seq data with DESeq2. Genome Biol.15: 550.
83. Robinson MD, McCarthy DJ, Smyth GK. 2010. edgeR: a Bioconductor package for differential expression analysis of digital gene expression data. Bioinformatics26: 139–40.
84. Zhang J, Wei Z. 2016. An empirical Bayes change-point model for identifying 3“ and 5” alternative splicing by next-generation RNA sequencing. Bioinformatics32: 1823–31.
85. Mayr C, Bartel DP. 2009. Widespread shortening of 3'UTRs by
alternative cleavage and polyadenylation activates oncogenes in cancer cells. Cell138: 673–84.
86. Rojas-Duran MF, Gilbert WV. 2012. Alternative transcription start site selection leads to large differences in translation activity in yeast. RNA
18: 2299–305.
87. Berkovits BD, Mayr C. 2015. Alternative 3' UTRs act as scaffolds to regulate membrane protein localization. Nature522: 363–7.
88. Dieudonné F-X, O'Connor PBF, Gubler-Jaquier P, Yasrebi H, et al. 2015. The effect of heterogeneous Transcription Start Sites (TSS) on the translatome: implications for the mammalian cellular phenotype. BMC Genomics16: 986.
89. Hollerer I, Curk T, Haase B, Benes V, et al. 2016. The differential expression of alternatively polyadenylated transcripts is a common stress-induced response mechanism that modulates mammalian mRNA expression in a quantitative and qualitative fashion. RNA22: 1441–53.
90. Valen E, Pascarella G, Chalk A, Maeda N, et al. 2009. Genome-wide detection and analysis of hippocampus core promoters using DeepCAGE.
Genome Res.19: 255–65.
92. Plessy C, Bertin N, Takahashi H, Simone R, et al. 2010. Linking
promoters to functional transcripts in small samples with nanoCAGE and CAGEscan. Nat. Methods7: 528–34.
93. Tang DTP, Plessy C, Salimullah M, Suzuki AM, et al. 2013. Suppression of artifacts and barcode bias in high-throughput transcriptome analyses utilizing template switching. Nucleic Acids Res.41: e44–4.
94. Hestand MS, Klingenhoff A, Scherf M, Ariyurek Y, et al. 2010. Tissue-specific transcript annotation and expression profiling with
complementary next-generation sequencing technologies. Nucleic Acids Res.38: e165–5.
95. Velculescu VE, Zhang L, Vogelstein B, Kinzler KW. 1995. Serial analysis of gene expression. Science270: 484–7.
96. Derti A, Garrett-Engele P, Macisaac KD, Stevens RC, et al. 2012. A quantitative atlas of polyadenylation in five mammals. Genome Res.22: 1173–83.
97. Wang L, Dowell RD, Yi R. 2013. Genome-wide maps of polyadenylation reveal dynamic mRNA 3'-end formation in mammalian cell lineages. RNA
19: 413–25.
98. Zawada AM, Rogacev KS, Müller S, Rotter B, et al. 2014. Massive analysis of cDNA Ends (MACE) and miRNA expression profiling identifies proatherogenic pathways in chronic kidney disease. Epigenetics9: 161– 72.
99. Jan CH, Friedman RC, Ruby JG, Bartel DP. 2011. Formation, regulation and evolution of Caenorhabditis elegans 3'UTRs. Nature469: 97–101.
100. Martin G, Gruber AR, Keller W, Zavolan M. 2012. Genome-wide Analysis of Pre-mRNA 3′ End Processing Reveals a Decisive Role of Human Cleavage Factor I in the Regulation of 3′ UTR Length. Cell Rep1: 753–63.
101. Wilkening S, Pelechano V, Järvelin AI, Tekkedil MM, et al. 2013. An efficient method for genome-wide polyadenylation site mapping and RNA quantification. Nucleic Acids Res.41: e65–5.
102. Harrison PF, Powell DR, Clancy JL, Preiss T, et al. 2015. PAT-seq: a method to study the integration of 3'-UTR dynamics with gene
expression in the eukaryotic transcriptome. RNA21: 1502–10.
103. Hafner M, Renwick N, Brown M, Mihailović A, et al. 2011. RNA-ligase-dependent biases in miRNA representation in deep-sequenced small RNA cDNA libraries. RNA17: 1697–712.
enrichment or fragmentation. Nucleic Acids Res.
105. Ozsolak F, Milos PM. 2011. Single-molecule direct RNA sequencing without cDNA synthesis. Wiley Interdiscip Rev RNA2: 565–70.
106. Pelechano V, Wei W, Steinmetz LM. 2013. Extensive transcriptional heterogeneity revealed by isoform profiling. Nature497: 127–31.
107. Ruan X, Ruan Y. 2012. Genome wide full-length transcript analysis using 5“ and 3” paired-end-tag next generation sequencing (RNA-PET).
Methods Mol. Biol.809: 535–62.
108. Lee JY, Yeh I, Park JY, Tian B. 2007. PolyA_DB 2: mRNA
polyadenylation sites in vertebrate genes. Nucleic Acids Res.35: D165–8.
109. Derti A, Garrett-Engele P, Macisaac KD, Stevens RC, et al. 2012. A quantitative atlas of polyadenylation in five mammals. Genome Res.22: 1173–83.
110. Dassi E, Re A, Leo S, Tebaldi T, et al. 2014. AURA 2. Translation2: e27738.
111. Wu X, Zhang Y, Li QQ. 2016. PlantAPA: A Portal for Visualization and Analysis of Alternative Polyadenylation in Plants. Front Plant Sci7: 889.
112. Brockman JM, Singh P, Liu D, Quinlan S, et al. 2005. PACdb: PolyA Cleavage Site and 3'-UTR Database. Bioinformatics21: 3691–3.
113. You L, Wu J, Feng Y, Fu Y, et al. 2015. APASdb: a database describing alternative poly(A) sites and selection of heterogeneous cleavage sites downstream of poly(A) signals. Nucleic Acids Res.43: D59–67.
Box 1.
Selected studies highlighting the role of alternative transcription start and alternative poly-adenylation sites in gene expression
Alternative promoters regulate the choice of poly-adenylation sites in the X-linked MID1 gene [4]
The MID1 3’ UTR comprises four polyadenylation sites and the selection of these sites is linked to promoter usage, as confirmed by RT-PCR experiments utilizing primers covering different exons in the 5’ UTR. This suggests that factors
interacting with both ends of the gene may be simultaneously regulating the two UTR lengths.
Cancer cells evade miRNA repression by shortening the 3’ UTR of transcripts [85] In some cancer cell lines shortening of the 3’ UTR leads to isoforms that are more highly expressed, primarily through the evasion of miRNA-mediated repression.
The efficiency of translation depends on the length of the 5’ UTR [86]
Short and long isoforms of 9 yeast genes show different translation efficiencies depending on the 5’ UTR length, with two of the genes tested showing > 100-fold difference in translation activity.
3’ UTRs control the fate of a gene product post-translationally [87]
In human cell lines, the 3’ UTR of the CD47 transcript recruits a protein complex and transports it to the site of translation, where it subsequently interacts with the newly synthesized protein to allow its translocation to the plasma membrane.
Selective recruitment of transcript variants to polysomes based on their 5’ UTRs allows rapid cell response with no changes to the transcriptional programme [88] A study of the transcriptome and translatome (transcripts associated with polysomes) in both tumour and normal breast cell lines points to cell-specific heterogeneity in transcript leaders (5’ UTRs) as well as differential recruitment of transcript variants by ribosomes in disease states.
Stress induces alternative poly-adenylation and regulates gene expression in mammalian cells [89]
Box 2.
An overview of experimental methods for probing alternative TSS and PCS
A relatively limited number of methods have been developed to capture the 5' end of transcripts at nucleotide resolution. Initial efforts based on a 5’ version of Serial Analysis of Gene Expression (SAGE)[Hashimoto et al. 2004)] or the capturing of the 7-methylguanosine cap (Cap Analysis of Gene Expression or CAGE [Shiraki et al. 2003; Carninci et al. 2005; Kodzius et al. 2006) have been superseded by versions that rely on next-generation sequencing (DeepCAGE[90] and HeliScopeCAGE[91]. HeliScopeCAGE is of particular interest as it is built on single molecule sequencing technology, avoiding the clonal amplification step that potentially leads to quantification bias, as well as several other error-prone steps such as second strand synthesis, ligation and digestion. Nano-cap analysis of gene expression (nanoCAGE)[92] uses the template switching method (Zhu et al. 2001) for reverse transcription, reducing the amount of starting RNA material needed but, importantly, not at the cost of coverage. However, template switching can introduce artifacts (cDNAs that are artificially shorter than the corresponding RNAs) owing to a process known as strand invasion[93]. Moreover, as with all CAGE-based methods, nanoCAGE may produce tags covering the whole transcript (a phenomenon known as “exon painting”[94]), rendering the calling of TSS challenging. Hence, caution is advised in the interpretation of intra-genic clusters of CAGE reads as alternative TSS.
junction, followed by click-chemistry to allow the ligation of special Illumina adaptors prior to PCR amplification. Another promising alternative approach is Direct RNA Sequencing (DRS) [105]. Similarly to HeliScope-CAGE, DRS has the major advantage of avoiding the reverse transcription–PCR step during library construction by sequencing directly captured poly-adenylated RNAs on oligo(dT)-coated slides. The DRS method requires very small amounts of RNA and has been shown to quantitatively reflect the amount of transcript isoform present in the RNA sample [105]. This promising technology is yet to be widely implemented, possibly due to higher error rates compared with other methods.
Table 1.
List of databases with information on alternative transcription start sites (TSS) and alternative poly-adenylation and cleavage sites (PCS)
Database name
Alternative PCS or TSS
Organism Technology Comments Web address Reference
PolyA_DB (2) PCS Human; Mouse; Rat; Chicken; Zebrafish
cDNA/EST and TRACE http://exon.umdnj.edu/polya_db/ Lee et al. 2007[108]
AURA 2 PCS Human; Rhesus; Dog
Mouse; Rat
PolyA-seq This is a “meta” database. Alternative UTR information is from [109]
http://aura.science.unitn.it/ Dassi et al. 2014[110]
PlantAPA PCS Plants EST, PAT-seq, Poly(A)-tag Only plant species are included in this database.
http://bmi.xmu.edu.cn/plantapa/ Wu et al. 2016[111]
PolyASite PCS Human; Mouse 2P-seq, 3’Seq, 3’READS,
3P-Seq, A-seq, A-seq2, DRS, PAS-Seq, PolyA-seq, SAPAS
http://polyasite.unibas.ch Gruber et al. 2016[17]
PACdb EST Uses an older version of the human
genome (hg18)
http://harlequin.jax.org/pacdb/ Brockman et al. 2005[112]
APADB PCS Human; Mouse;
Chicken
Massive Analysis of cDNA Ends (MACE)
http://tools.genxpro.net/apadb/ Müller et al. 2014[16]
APASdb Human; Mouse;
Zebrafish
SAPAS http://genome.bucm.edu.cn/utr/ You et al. 2015[113]
DBTSS TSS Human TSS-seq Uses an older version of the human
genome (hg18)
Figure Captions
Figure 1.
Schematic representation of alternative transcription start site and alternative poly-adenylation events of interest to this review.
The presence of two alternative TSS and two alternative PCS creates four possible transcripts from the same genomic locus (top). TSS1 creates transcripts with longer 5’ UTRs compared with TSS2, whereas PCS1 creates transcripts with shorter 3’UTRs compared with PCS2. The use of alternative TSS/PCS regulates the inclusion or exclusion of functional elements such as upstream open reading frames (uORFs) in the 5’ UTR or miRNA and protein-binding sites in the 3’ UTR. The coding regions (light grey boxes and grey lines) may or may not be different between the transcripts, depending on the action of alternative splicing. In this review we are only concerned with differences in the untranslated regions (blue and yellow).
Figure 2.
The distribution of microarray probes along the length of the transcript limits their usability for genome-wide studies of alternative TSS and PCS.
A & B:
The mapped position of microarray probes for three generations of Affymetrix chips are shown as coloured rectangles along the 5’ (A) and 3’ UTR (B) of two transcripts (brown, pink and blue for Human Genome 133 Plus, Human Exon 1.0 ST and Human Transcriptome Array 2.0 respectively). Annotated TSS and PCS sites are shown as brown vertical lines along the body of the UTR. Even in the simplest case of a single TSS site (A), it is obvious that only the recently developed Human Transcriptome Array contains enough probes to give satisfactory coverage of both alternative 5’ UTRs. In the more complex case of multiple known sites shown in (B), even the extended coverage provided by HTA 2.0 is not sufficient for unambiguous discovery and quantification of alternative poly-adenylation events for this transcript.
C & D:
Figure 3.
Discovering alternative poly-adenylation events from read density fluctuations in RNA-seq data.
Reads from an RNA-seq experiment[72] are mapped to the reference genome and the density of the reads is displayed as a Sashimi plot, depicting coverage along the gene body (only the 3’ end of the transcripts are shown for genes