REVIEW
Understanding development and stem cells using single
cell-based analyses of gene expression
Pavithra Kumar, Yuqi Tan and Patrick Cahan*
ABSTRACT
In recent years, genome-wide profiling approaches have begun to uncover the molecular programs that drive developmental processes. In particular, technical advances that enable genome-wide profiling of thousands of individual cells have provided the tantalizing prospect of cataloging cell type diversity and developmental dynamics in a quantitative and comprehensive manner. Here, we review how single-cell RNA sequencing has provided key insights into mammalian developmental and stem cell biology, emphasizing the analytical approaches that are specific to studying gene expression in single cells.
KEY WORDS: RNA-Seq, Computational biology, Gene regulatory networks, Pseudotime, Single cell, Stem cells
Introduction
To characterize the diversity of cell types in multicellular organisms, to investigate the mechanisms that give rise to this diversity in development and how they go awry in disease, and to understand how dynamic intercellular interactions contribute to these processes, we need technologies that allow us to make genome-wide measurements of many single cells. Over the past 16 years, a number of genome-wide profiling techniques (e.g. RNA sequencing and chromatin immunoprecipitation sequencing or ChIP-Seq; see Glossary, Box 1) have been developed and used to study global changes in, for example, gene expression, chromatin occupancy by transcription factors and epigenetic marking. However, in general, these approaches require more starting material than is available in an individual cell, limiting their application to cell populations. Thus, while such studies have provided important advances, it is becoming clear that the profiling of individual cells would be highly advantageous. There are many reasons for this. First, especially in developmental contexts, the rarity of some cell types means that large numbers of animals need to be used in order to acquire sufficient cells for profiling. For example, profiling the transcriptome of hematopoietic stem cells (HSCs) across seven distinct stages of development required the manual dissection of greater than 2500 mouse embryos, a painstaking feat accomplished over the course of 3 years (McKinney-Freeman et al., 2012). Second, even highly robust and functionally verified isolation strategies do not reach 100% purity. For example, at best, only one in two CD150+ CD48-Sca-1+Lineage-c-kit+ bone marrow cells can reconstitute the hematopoietic system of irradiated mice (Kiel et al., 2005). This impurity is problematic because it generates molecular signatures
that are weighted averages of the constituent cell types rather than an accurate reflection of an individual cell. Third, although single cell profiling can help to define cell types with higher resolution, it can also be used to discover previously unappreciated cell types in heterogeneous populations and complex tissues. For example, the single cell ‘profiling’ (using Southern hybridization) of cDNA from nine genes in 15 single pyramidal neurons of the rat hippocampus led to the discovery of two neuronal subtypes distinguished by their K+to Ca2+ channel gene expression ratios (Eberwine et al., 1992). Fourth, and finally, it is becoming evident that single-cell profiling will allow us to address a wide range of questions and hypotheses concerning the co-occurrence of molecular events in individual cells. This exploration need not be limited to gene expression. For example, the simultaneous interrogation of DNA copy number variation (CNV) and gene expression in single cells (Dey et al., 2015; Macaulay et al., 2015) could be used to uncover the extent to which CNVs contribute to functional heterogeneity in the developing nervous system (McConnell et al., 2013), and to determine the extent to which this is mediated by alterations in gene expression. Likewise, the integration of DNA methylation state with transcription will reveal the extent to which this epigenetic modification contributes to ‘stochastic’ expression (Angermueller et al., 2016). More generally, the incorporation of other data on a per cell basis will compound the amount of knowledge that can be gleaned from single-cell molecular profiling.
In the relatively brief time since the first description of the mRNA content of single cells (Tang et al., 2009), a staggering array of single-cell genome-wide profiling techniques and applications have been reported (Fig. 1). The surfeit of methods to quantify RNA in single cells, including Smart-Seq (Ramskold et al., 2012), CEL-Seq (Hashimshony et al., 2012) and Quartz-Seq (Sasagawa et al., 2013), reflects the relative ease with which mRNA can be captured, amplified and sequenced in order to provide a molecular readout of cell state. In addition to single-cell gene expression, methods to assess DNA variation (Navin et al., 2011), chromatin organization (Nagano et al., 2016), chromatin accessibility (Cusanovich et al., 2015; Buenrostro et al., 2015), DNA-protein interactions (Rotem et al., 2015) and DNA methylation (Smallwood et al., 2014) have been developed for single cells.
Here, we review single-cell genome-wide studies of mammalian development and stem cells, focusing on single-cell RNA sequencing (scRNA-Seq; see Box 2), its applications and the insights that have been gleaned from this technique. We do not discuss the tantalizing progress being made in single-cell proteomics (Bandura et al., 2009) orin situ RNA-Seq (Ke et al., 2013; Lee et al., 2014; Lovatt et al., 2014). We also refer the reader to several other reviews that provide a more in-depth discussion of the technical and molecular details of single-cell methods (Etzrodt et al., 2014; Kolodziejczyk et al., 2015a; Macaulay and Voet, 2014; Wang and Navin, 2015).
Department of Biomedical Engineering, Institute for Cell Engineering, Johns Hopkins University School of Medicine, Baltimore, MD 21205, USA.
*Author for correspondence ( [email protected])
P.C., 0000-0003-3652-2540
DEVEL
O
The basics of scRNA-Seq analysis
The technique of scRNA-Seq involves isolating and lysing single cells, producing cDNA in such a way that material from a cell is uniquely marked or barcoded, and generating next-generation sequencing libraries that are subjected to high-throughput sequencing (see Box 2). The ultimate output of this process is a series of sequence reads that are attributed to single cells with the barcode, aligned to a reference genome or transcriptome, and transformed into expression estimates. After sequencing, libraries are subjected to quality control to remove low-quality samples (e.g. material from incompletely lysed cells), and normalized expression estimates are then used as input for an ever-increasing battery of algorithms tailored for scRNA-Seq. We briefly describe the approaches currently used to analyze scRNA-Seq data (Fig. 2). We refer the reader to other reviews that discuss the many pre-processing and quality-control steps that are required to produce ‘clean’, informative single-cell data (Bacher and Kendziorski, 2016; Stegle et al., 2015), and that describe methods to detect and account for uninteresting confounding effects, such as the stage of cell cycle (Buettner et al., 2015; Vallejos et al., 2015), and to analyze and account for technical noise and the so-called ‘drop out’ (see Glossary, Box 1) effect
(Brennecke et al., 2013; Grün et al., 2014; Kharchenko et al., 2014; Pierson and Yau, 2015).
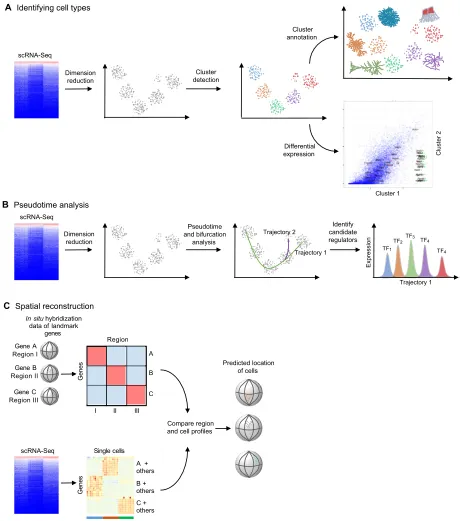
scRNA-Seq can be used to determine the various cell types within a population or tissue, including rare cell types. Commonly used approaches to identify sub-structure in scRNA-Seq data and to identify distinct cell types include principal component analysis (PCA; see Glossary, Box 1) and t-distributed stochastic neighbor embedding (t-SNE; see Glossary, Box 1), both of which aim to reduce the number of variables required to represent the total variation in the data (Maaten and Hinton, 2008). After running the data through these dimensionality reduction techniques, the results are visualized and subsequently used as input for secondary algorithms, such as K-means clustering (see Glossary, Box 1) and Gaussian mixture modeling (see Glossary, Box 1), to identify the number of clusters and to assign cells to clusters, sometimes in a probabilistic fashion (Fig. 2A). Owing to the low sensitivity of scRNA-Seq, it has been challenging to use these approaches‘as is’ to identify rare sub-populations and distinguish them from technical outliers. However, an analytical pipeline called RACE ID was recently developed to address this problem (Grün et al., 2015). RACE ID first estimates the number of clusters (cell types or states) using k-means. Second, it statistically models the expression of each gene within each cluster and uses these models to identify outlier cells, which are defined as those with highly unlikely expression of two or more genes. Finally, it assigns outliers to new clusters, defining these as new cell types or states, that are visualized using t-SNE. Although this approach has several parameters that require tweaking, it has been used successfully for identifying rare Paneth progenitor cells in intestinal organoids (Grün et al., 2015). Other similar approaches have also been described, including GiniClust (Jiang et al., 2016), and predictions generated with these methods can be tested by searching for genes encoding cell-surface markers that distinguish the new cell clusters, prospective isolation by fluorescence-activated cell sorting (FACS) and subsequent functional assessment.
In addition to cell type heterogeneity, cells within a population can exhibit temporal heterogeneity. They may, for example, differ primarily with regard to the stage (e.g. of a developmental process) at which they are sampled. Another simple variable is the stage of the cell cycle but the concept is extendable to developmental trajectories, or even to stages of disease progression. Several approaches have recently been developed to reconstruct major trajectories from single-cell molecular profiling data and to place cells along these trajectories (Fig. 2B). The first of these to be developed were Wanderlust and Monocle (Bendall et al., 2014; Trapnell et al., 2014). Monocle relies on the minimal spanning tree (MST; see Glossary, Box 1) algorithm to find trajectories in data, which are interpreted as a temporal progression or‘pseudotime’(see Glossary, Box 1). Cells can then be placed along pseudotime based on their distance from the major trajectories defined by the MST, and the data can be analyzed using standard approaches for temporal data. Such an approach is typically used to identify regulators of developmental progression or bifurcation points. By contrast, Wanderlust (which was implemented to order single cell mass-cytometry data) creates an ensemble of nearest neighbor graph and determines an average path based on the trajectories defined as the shortest path starting from a defined starting point. A multitude of new algorithms have been described more recently to achieve a similar aim. These include Wishbone (Setty et al., 2016), Sincell (Juliá et al., 2015), time variant clustering (Huang et al., 2014), SCUBA (Marco et al., 2014), Waterfall (Shin et al., 2015), probabilistic Boolean Box 1. Glossary
Bayesian network:A probabilistic graph in which each node represents a random variable and each edge represents a conditional dependence between two random variables (or nodes).
Chromatin immunoprecipitation sequencing or ChIP-Seq:A method to determine the genomic regions with which a protein interacts.
Drop-out:A false negative in scRNA-Seq data. In other words, when a gene is expressed in a cell but is not detected by scRNA-Seq.
Gaussian mixture model:A class of probabilistic models that represent clusters of data points using Gaussian densities.
Gene regulatory network (GRN): The complete set of regulatory relationships between genes and gene products.
K-means clustering:An algorithm that assigns entities (e.g. samples or cells) to K distinct groups, where K is an integer specified by the user. K-means seeks to find the set of group assignments that minimize the distances within all of groups.
Minimal spanning tree (MST):An algorithm to connect vertices of a weighted-edge graph, such that the resulting graph has the minimal total edge weight.
Principal component analysis (PCA):A linear projection of data from high to low dimensions constrained by maximizing the variance between components. Good at preserving large distances between points (cells) in the original space.
Pseudotime:An artificial ordering of cells based upon a statistically inferred trajectory often interpreted as time. Such an approach is useful when sampling from a population or populations in which single cells are at distinct stages of a process.
Simpson’s paradox: The loss or reversal of statistical associations between variables, as determined in more than one group, when those groups are combined.
Synthetic RNA spike-ins: Poly-adenylated mRNA synthesized and provided at known copy number used to estimate absolute abundance of target mRNA, and to estimate and correct for technical noise in scRNA-Seq. Commonly used spike-in sets are designed to have no similarity to the transcriptomes of commonly studied species but to have similar sequence composition and lengths.
t-distributed stochastic neighbor embedding (t-SNE):a projection of high dimensional data into lower dimensions by preserving probabilistically determined pairwise distances between points. Good at preserving smaller distances between points (cells) in the original space.
Transcriptional noise:Random fluctuations in the transcription of a single gene, quantified as the standard deviation divided by the mean.
DEVEL
O
networks (Chen et al., 2015), diffusion maps (Haghverdi et al., 2015), TSCAN (Ji and Ji, 2016), SLICER (Welch et al., 2016) and SCOUP (Matsumoto and Kiryu, 2016). These various types of pseudotime analyses allow the identification of regulators of temporal processes and of transient events that are obscured by bulk-derived data. Models generated from these types of analyses can be tested by live-cell tracking, by modulating the expression of candidate transcriptional regulators or by perturbing the identified signaling pathways.
Similar to the concept of placing cells along a temporal axis, several algorithms have been developed to place cells into spatial contexts. Such spatial reconstruction methods (Satija et al., 2015; Achim et al., 2015) use prior information about localized marker gene expression to place single cells from scRNA-Seq into a spatial representation of an anatomical context (Fig. 2C). When temporal and spatial axes coincide, Sinova (a method similar in concept to Monocle) can be used to place cells spatially without prior knowledge of marker gene expression (Li et al., 2016c).
Finally, there is much excitement around the prospect of using scRNA-Seq to reconstruct gene regulatory networks (GRNs; see Glossary, Box 1) that more faithfully predict transcriptional state and dynamics than those produced from the profiling of bulk populations. In theory, GRNs constructed from single-cell data should be better because they will not be confounded by population substructure, which can lead to Simpson’s Paradox (Trapnell, 2015) (see Glossary, Box 1), and because gene-to-gene correlations (from which GRNs are reverse engineered) are elicited by stochastic variation rather than non-physiological overexpression or knockdown. (Bian and Cahan, 2016). However, the low sensitivity of scRNA-Seq is problematic for detecting correlations, especially for genes that are transcribed at very low rates. Thus, although GRNs have been reconstructed from single-cell quantitative PCR (qPCR) data using Bayesian networks (see Glossary, Box 1) (Moignard et al., 2015), and formal methods have been devised in this context (Ocone et al., 2015), no large-scale GRN reconstruction from scRNA-Seq data has been described to date.
‘Embryomics’: using scRNA-Seq to understand embryogenesis
As we have summarized above, a host of approaches and techniques have been developed in recent years to study gene expression in single cells and to then analyze this data so as to provide meaningful datasets. Importantly, such methods have been used successfully to gain insights into various aspects of embryogenesis and early development (summarized in Table 1). Below, we highlight just some of these advances.
Lineage segregation in the pre-implantation embryo
Before it implants, the mammalian embryo consists of three lineages: the epiblast (EPI), which gives rise to three germ layers; the trophectoderm (TE), which mediates implantation; and the primitive endoderm (PE), which provides nutrition to the developing embryo (Rossant et al., 2009). A first hint of the power of single cell techniques was provided by a single-cell qPCR study that uncovered transcriptional differences between these early embryonic lineages in mice (Guo et al., 2010). In this study,∼450 single cells at seven developmental stages (from the zygote to 64-cell blastocyst) were manually isolated and the expression of 48 genes representing, for example, developmental signaling pathways (e.g.Bmp4) or transcription factors known to regulate pluripotency (e.g.Utf1) and gastrulation (e.g.Gata2) were analyzed. Using the expression of markers characteristic of cells constituting the blastocyst, Guo et al. were able to group the cells from the 64 cell embryos as EPI, TE, or PE and identify genes that mark fate decisions. For example, Sox2 expression marked the first fate decision– the choice to form inner or outer cells of the morula. Notably, it was shown that lineage specification also involves a reduction in the expression of some TFs in cells of opposing lineages, as well as lineage-specific increases in some TFs. For example, Gata6 expression is reduced in EPI progenitors, whereas factors such as Klf2 are reduced in TE progenitors.
Given that the above study was based on the targeted analysis of just a few genes using qPCR, the identification of novel genes that 0
20 40 60
2010 2012 2014 2016
Year
Number of cells sequenced (
⫻
1000)
Arabidopsis C. elegans Human
Mouse Rat
Zebrafish
Macosko (2015) Klein (2015)
0 0.25 0.5 0.75 1
2009 2010 2011 2012 2013 2014
Tang (2009) Tang (2010)
Islam (2011)Ramskold (2012) Hashimshony (2012)
Picelli (2013) Yan (2013) Xue (2013)
(
[image:3.612.49.440.55.326.2](
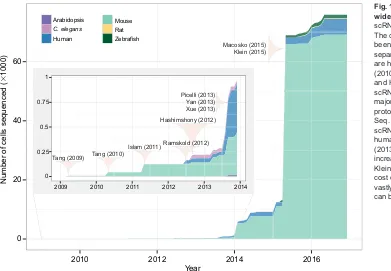
Fig. 1. The growth of single cell genome-wide profiling techniques.A surge in scRNA-Seq applications can be observed. The cumulative number of cells that have been subjected to scRNA-Seq is shown, separated by species. Landmark studies are highlighted. Tang et al. (2009), Tang (2010b), Islam (2011), Ramskold (2012) and Hashimshony (2012) are the first five scRNA-Seq studies. They introduced the major varieties of scRNA-Seq: Tang protocol, STRT-Seq, CEL-Seq and Smart-Seq. Yan (2013) and Xue (2013) leverage scRNA-Seq to explore and the dynamics of human zygotic genome activation. Picelli (2013) introduces Smart-Seq2 with increased sensitivity. Macosko (2015) and Klein (2015) introduce high-throughput low-cost droplet-based methods that have vastly increased the number of cells that can be sequenced.
DEVEL
O
play key roles in these developmental stages was not possible. However, the first scRNA-Seq study began to address this issue by characterizing the complete transcriptomes of individual blastomeres from four-cell stage murine embryos and from mature oocytes (Tang et al., 2010a). In addition to acting as a proof of principle, this study documented that a single cell expresses
multiple isoforms of the same gene – information that is indeterminable from bulk samples.
The most recent and comprehensive transcriptional portrait of human pre-implantation embryos, using 1529 individual cells from 88 pre-implantation embryos, substantiated many observations of the earlier molecular characterizations (Petropoulos et al., 2016). Box 2. Single-cell RNA sequencing: how does it work?
Cell isolation and lysis
Reverse
transcription Amplification
Library preparation and sequencing scRNA-Seq
method
PCR
IVT-PCR TS and UMI
Library prep and Seq PolyA tailing and
SSS and UMI Smart-Seq
inDrop
Tang
Quartz-Seq Drop-Seq
SCRB-Seq
STRT-Seq
Droplets
Tubes
MARS-Seq CEL-Seq
Microfluidics
TS
PolyA tailing and SSS Cells: 50,401
Genes: 6177 Studies: 1
Cells: 5212 Genes: NA Studies: 1
Cells: 513 Genes: 6832 Studies: 40
Cells: 107 Genes: 10,874 Studies: 8
Cells: 851 Genes: 3400 Studies: 1
Cells: 47 Genes: NA Studies: 1
Cells: 85 Genes: 5867 Studies: 2
Cells: 1467 Genes: 8822 Studies: 5
Cells: 2042 Genes: 533 Studies: 3
Some of the most widely used protocols for scRNA-Seq are listed; shown in boxes are the number of studies in which the approach has been used, the average number of single cells subjected to scRNA-Seq and the average number of genes reported as detected. Although all techniques follow a similar outline, they vary in their methods. The first step in scRNA-Seq is the efficient capture and lysis of single cells. This can be achieved via manual isolation of cells using FACS or micropipetting into tubes containing lysis solution (tubes), via commercial microfluidics-based platforms such as Fluidigm’s C1 (microfluidics), or by capturing cells into nanoliter droplets that contain lysis buffer (droplets). Once cells are lysed, the mRNA population is bound by primers containing a polyT region that allows them to bind to the polyA tail of mRNA. These primers can also have other unique features such as unique molecular identifiers (UMIs), cell barcodes or sequences that serve as PCR adapters. The captured mRNA is subsequently converted to cDNA using a reverse transcriptase to generate the first cDNA strand. Historical techniques then use polyA tailing of the 3′end of the newly synthesized strand followed by second-strand synthesis (SSS) to produce double-second-stranded DNA (ds-cDNA). However, recently, template switching (TS) is carried out prior to generation of the second strand, using a custom oligo called the template switch oligo (TSO) that binds the 3′end of the newly synthesized cDNA and serves as a primer for the generation of the second strand, thus resulting in identical sequences on both ends of the ds-cDNA. This ensures efficient amplification of the full-length ds-cDNA. PolyA tailing and TS can be carried out both with or without UMIs. After successful second-strand synthesis, most techniques use PCR-based amplification to amplify the ds-cDNA obtained from a single cell, in order to generate enough starting material for sequencing. However, techniques such as MARS-Seq, CEL-Seq and inDrop performin vitrotranscription (IVT) followed by another round of cDNA synthesis, before PCR amplification. After this point, all techniques converge, such that the amplified ds-cDNA is used as starting material to generate a collection of short, adapter-ligated fragments called a library, that is fed into a sequencer of choice to generate sequencing reads. NA, not applicable.
DEVEL
O
Identify candidate regulators
TF1
TF2
TF3
TF4
TF4
Trajectory 1
Expression
Trajectory 2
Trajectory 1 Pseudotime
and bifurcation analysis Dimension
reduction
Cluster detection
Cluster annotation
Differential expression
Cluster 1
Cluster 2
In situ hybridization
data of landmark genes
Predicted location of cells
Single cells scRNA-Seq
Region
I II III
A
B
C Gene A
Region I
Gene B Region II
Gene C Region III
A + others
B + others
C + others
Genes
Genes
A Identifying cell types
B Pseudotime analysis
C Spatial reconstruction
scRNA-Seq scRNA-Seq
Compare region and cell profiles Dimension
[image:5.612.75.535.56.577.2]reduction
Fig. 2. Typical approaches for analyzing scRNA-Seq datasets.Several types of analyses are popular for analyzing scRNA-Seq datasets. (A) When trying to identify cell types, dimension reduction techniques such as independent component analysis, principal component analysis, t-distributed stochastic neighbor embedding, ZIFA (Pierson and Yau, 2015) or weighted gene co-expression network analysis (Langfelder and Horvath, 2008) are first used to project high-dimensional data into a smaller number of dimensions to ease visual evaluation and interpretation. Clusters of similar cells can be identified using generally applicable methods, such as Gaussian mixture modeling (Fraley and Raftery, 2002) or K-means clustering, or methods devised specifically for single cell data, such as StemID (Grün et al., 2016), SCUBA, SNN-Cliq (Xu and Su, 2015), Destiny (Angerer et al., 2015) or BackSpin (Zeisel et al., 2015). Clusters can then be annotated based on domain-specific knowledge of the expression of a few genes, or automatically based on gene set enrichment. Finally, specific genes that are differentially expressed between clusters can be identified using scRNA-Seq-specific methods such as SCDE (Kharchenko et al., 2014) and MAST (Finak et al., 2015). (B) Most pseudotime analyses (which place each cell on a statistically derived axis that represents progression along a process, such as developmental time) start by performing dimension reduction. They then determine trajectories through the reduced dimensionality data; some algorithms identify bifurcation points and generate a distinct trajectory. The trajectories can then be used to order single cells along the process and to identify candidate regulators of stage transitions, for example, by finding stage-specific transcription factors (TF1-TF5). (C) One of the major drawbacks of scRNA-Seq is the loss of spatial context information when cells are dissociated and/or isolated. Spatial reconstruction methods attempt to ameliorate this issue by leveraging prior knowledge of landmark gene expression. Typically, localized expression of select genes is generated fromin situhybridization. Spatial reconstruction algorithms then compare scRNA-Seq profiles to discretizedin situhybridization profiles, and cells are placedin silicoin the anatomical region with a matching profile. Machine-learning approaches can be used to estimate the expression of landmark genes to overcome the noisy nature of scRNA-Ssq data.
DEVEL
O
Indeed, similar to the findings based on qPCR analyses, it was shown that lineage-specific markers exhibit promiscuous co-expression prior to lineage maturation between E3 and E5. For example, co-expression of TE- (GATA2andGATA3), PE- (GATA4andPDGFRA) and EPI-(SOX2andTDGF21) indicative genes was observed before the three distinct groups of cells were labeled at late E5.
Human zygotic genome activation
The dynamics of human zygotic genome activation (ZGA, also referred to as embryonic genome activation or EGA) have remained elusive for many years because it is difficult to obtain the numbers of precisely timed human embryos that would be required for traditional, bulk molecular profiling (Braude et al., 1988; Dobson
[image:6.612.49.562.71.556.2]et al., 2004). This, however, has changed with the development of single-cell-based approaches. Indeed, to more finely map human ZGA, scRNA-Seq was carried out on 33 cells isolated from human pre-implantation embryos, ranging from the zygote to the 8-cell stage, all of which had been derived by intra-cytoplasmic sperm injection from a single sperm donor (Xue et al., 2013). Using this approach, maternal and paternal transcripts in single cells could be distinguished based on paternal-specific single-nucleotide polymorphisms (SNPs), and it was found that the expression of paternal alleles occurs as early as the 2-cell stage, followed by major ZGA in the 4- to 8-cell stages. These findings were corroborated in a scRNA-Seq-based analysis of 124 human embryonic cells, including zygotes and cells from the 2-cell, 4-cell, 8-cell, morula
Table 1. Single-cell RNA-Seq-based studies of early mammalian development
Study Cell type(s) Primary Species Cells
Number
of genes Method Summary
Tang et al. (2009)
Early embryo Yes Mouse 7 11,920 Tang The first scRNA-Seq study; characterized blastomere expression state
Tang et al. (2010b)
Early embryo, mESC, ICM outgrowth
Yes Mouse 34 10,815 Tang Discovered a metabolic switch from ICM cells to ESCs
Islam et al. (2011)
mESC, MEF No Mouse 85 4250
STRT-Seq
STRT-Seq is described and can pinpoint the exact location of the 5′end of transcripts
Ramskold et al. (2012)
Cancer cell lines, oocyte, CTC, melanocytes, hESC
Yes Mouse, Human
38 10,000 Smart-Seq
Identified candidate biomarkers of circulating tumor cells Hashimshony
et al. (2012)
Embryo, MEF, mESC Yes C. elegans, mouse
52 5500 CEL-Seq
CEL-Seq is described, representing advances in processivity and cost effectiveness
Pan et al. (2013) K562, dorsal root ganglia Yes Human, mouse
3 4706 Custom Optimizes two protocols for sequencing low-abundance material
Sasagawa et al. (2013)
mESC, ESC-derived primitive endoderm
No Mouse 47 NA
Quartz-Seq
Describes Quartz-Seq
Yan et al. (2013) Oocyte, zygote, 2-cell, 4-cell, 8-cell, morula, late blast, hESC
Yes Human 124 11,006 Tang A comprehensive transcriptomic profiling of human pre-implantation embryos and ESCs
Xue et al. (2013) Oocyte, pronucleus, zygote, 2-cell, 4-cell, 8-cell
Yes Human, mouse
37 10,231 Tang Discovers that paternal-specific single nucleotide polymorphisms can be detected as early as the 2-cell stage Islam et al.
(2013)
ESC No Mouse 41 7595
STRT-Seq
Introduction of UMIs to enable mRNA to ameliorate the issue of PCR duplications during amplification
Deng et al. (2014)
Zygote, 2-cell, 4-cell, 8-cell, 16-cell, early blast, mid blast, late blast, M-II oocyte, fibroblasts, liver
Yes Mouse 298 NA Smart-Seq
Global analysis of allelic expression on mouse pre-implantation embryos; revealed that random monoallelic expression results from stochastic allelic transcription
Grün et al. (2014)
ESC No Mouse 118 6235
CEL-Seq
Proposed a noise model to correct for sampling noise and global cell-to-cell variation in sequencing efficiency Kumar et al.
(2014)
ESC No Mouse 415 NA
Smart-Seq
Showed that transcriptional heterogeneity is regulated and associated with expression of lineage specifiers; loss of mature miRNA pushes ESCs to a low-noise state
Satija et al. (2015)
Embryo Yes Zebrafish 851 3400
SCRB-seq
Description of Seurat to computationally reconstruct the spatial organization of zebrafish embryos
Klein et al. (2015)
ESC No Mouse 5212 NA inDrop High-throughput droplet-microfluidic approach applied to RNA-Seq thousands of single cells
Cacchiarelli et al. (2015)
Fibroblasts, PSC No Human 52 NA Smart-Seq
Suggested that reprogramming reflects aspects of development in reverse Kim et al. (2015) ESC No Mouse 54 7385
Smart-Seq
Described a generative statistical model to quantify technical noise using spike-ins
CEL-Seq, cell expression by linear amplification and sequencing; CTCs, circulating tumor cells; ESC, embryonic stem cell; hESC, human embryonic stem cell; MEF, mouse embryonic fibroblast; mESC, mouse embryonic stem cell; ICM, inner cell mass; scRNA-Seq, single-cell RNA sequencing; STRT-Seq, single-cell tagged reverse transcription sequencing; NA, not applicable; PSC, pluripotent stem cell; UMIs, unique molecular identifiers.
DEVEL
O
and late blastocyst stages (Yan et al., 2013). Based on the sheer number of genes that are differentially expressed between the 4-cell and the 8-cell stage, and because the genes upregulated are enriched in ribosome and RNA metabolism functions, it was concluded that the major phase of ZGA occurs at this stage. This is in contrast to ZGA dynamics in the mouse, where the major phase of ZGA was found by scRNA-Seq to occur between the zygote and late 2-cell stage (Blakeley et al., 2015). In spite of this difference in the timing of ZGA, a high degree of conservation between the human and mouse pre-implantation development genetic programs was observed (Xue et al., 2013). By performing network and gene enrichment analysis, it was shown that the genetic networks coinciding with the three waves of ZGA/EGA in human and mouse embryos share analogous cellular functions. For example, networks activated in the early ZGA wave are enriched in protein transport and GTPase signaling genes (at the 1- to 4-cell stage in human, the 1- to 2-cell stage in mouse), networks activated in the major ZGA wave are highly enriched in RNA processing and ribosome biogenesis genes (at the 8-cell stage in human, and the 2- to 4-cell stage in mouse), and networks activated in the final wave are enriched in translation and mitochondrial genes (at the 16-cell stage in human, and the 8- to 16-cell stage in mouse). This suggests that the regulation of these conserved genetic programs is decoupled (to some extent) from the number of cell cycles post-fertilization, raising the issue of how the waves of ZGA/EGA are timed.
Blastomere asymmetry
Another elusive facet of early human embryogenesis is the timing of the first symmetry-breaking event–the moment at which seemingly equivalent blastomeres start to exhibit differences. Using scRNA-Seq, it was demonstrated that the transcriptional profile of the zygote was distinct when compared with that of other cleavage-stage embryos (Xue et al., 2013), an observation that was further substantiated in 2015 by a computational meta-analysis of scRNA-Seq data (Shi et al., 2015). Comparing scRNA-scRNA-Seq data with a theoretical prediction of a biased distribution of transcripts suggested that the asymmetric distribution of transcripts occurs at the point immediately after the first embryonic cleavage. This biased distribution of transcripts follows a binomial pattern, which means that when the RNA copy number is low, the transcript will be less evenly distributed to daughter cells after the first cleavage. In the subsequent 2- to 16-cell stages, asymmetrically distributed transcripts diverge into either being minimized through negative-feedback loops or enhanced through positive-feedback loops, suggesting that transcriptional noise (see Glossary, Box 1) is initially important but then has progressively minimal impact during lineage specification.
Allele-specific gene expression
Although allelic exclusion has been linked to diverse biological functions, including T-cell receptor expression and antigen recognition in B cells (Brady et al., 2010), its genome-wide prevalence has been unclear. However, in 2014, this issue was addressed by determining allele-specific expression in 269 single cells isolated from pre-implantation stage mouse embryos (Deng et al., 2014; Ramskold et al., 2012). By crossing mice of different backgrounds (CAST and C57), allele-specific expression could be quantified on a per cell basis with scRNA-Seq by using SNPs to distinguish alleles. Using this approach, it was estimated that the extent of monoallelic expression is surprisingly high (54% of genes), a figure that subsequently has been revised to 17.8% after accounting for technical noise (Kim et al., 2015). More recently, by observing SNPs in male pre-implantation human embryos, it was
shown that X-chromosome genes exhibit lingering bi-allelic expression, which is absent at later stages (Petropoulos et al., 2016).
Using scRNA-Seq to gain insights into the biology of stem cells
The scRNA-Seq studies discussed above focused primarily on gene expression in early embryos, but it soon became clear that such an approach could also be used to further understand the biology of different types of stem cells. Indeed, and as we highlight briefly below, scRNA-Seq studies carried out in just the past few years have begun to answer some key questions in the stem cell field.
The relationship between stem cell states
Embryonic stem cells (ESCs) are derived by explant culture of day 4.5 (murine) or day 8 (human) embryos; however, the precise relationship between ESCs and the cells from which they originatein vivo has remained ill-defined (Nichols and Smith, 2011). To address this issue, scRNA-Seq has been used to elucidate the precise changes that accompany the transition of human inner cell mass cells to human ESCs (Tang et al., 2010a). This study revealed a switch in the levels of genes encoding metabolic factors, as well as increases in the levels of genes encoding epigenetic repressors, although it should be noted that the study was limited in the number of cells profiled. Similarly, scRNA-Seq has leverage to identify transcriptional changes that occur during the reprogramming of cells to induced pluripotent stem cells (iPSCs). A pioneering single-cell qPCR study discovered that the reprogramming process is divided into an early, rate-limiting stochastic phase followed by a deterministic phase (Buganim et al., 2012). Subsequent studies that have applied scRNA-Seq to reprogramming have refined this model, finding that reprogramming follows development‘in reverse’(Cacchiarelli et al., 2015).
Transcriptional heterogeneity and pluripotency
Related to how ESCs are derived is the question‘how is this artificial state is maintained in culture?’. The role of transcriptional heterogeneity in pluripotency has been a subject of debate since fluctuations in the levels of Nanog and other pluripotency factors in mouse ESCs were first reported (Chambers et al., 2007; Niwa et al., 2009; Toyooka et al., 2008). One hypothesis is that transcriptional heterogeneity in lineage regulators or signaling components affords stem cells reversible opportunities to exit the pluripotent state if conditions are permissive, resulting in a meta-stable state (reviewed by MacArthur et al., 2009; Cahan and Daley, 2013). This hypothesis has been explored by applying scRNA-Seq to 183 mouse ESCs cultured in traditional conditions (LIF and serum on feeders) (Kumar et al., 2014). The authors indeed found that the expression of some pluripotency regulators (e.g. Essrb) is bimodal. Most interesting was the discovery of genes that are sporadically expressed, i.e. that are expressed at a high level in a few cells but not detected in the rest. Both Polycomb targeted genes, which define lineage regulators, and components of developmental signaling pathways are enriched in these sporadically expressed gene sets. Furthermore, the expression of Polycomb target genes as a whole correlates with the expression of variably (both positively and negatively) expressed pluripotency factors, implying the presence of genetic circuits that regulate transitions among distinct pluripotent states, thereby offering access to stochastically selected lineage fate choices. The above study also examined whether transcriptional heterogeneity is affected by culturing in the presence of GSK and ERK inhibitors (‘2i’), which had been reported to reduce heterogeneous expression of some pluripotency factors, and in mouse ESCs lacking mature microRNAs, which fail to differentiate. Indeed, it was found that
DEVEL
O
the expression of pluripotency-associated genes is substantially less heterogeneous in mouse ESCs cultured in 2i than in either mouse ESCs cultured in serum or mouse ESCs lacking mature microRNAs. This result was subsequently corroborated by a study that used scRNA-Seq of 250 mouse ESCs in serum and LIF, 295 in standard 2i and 159 in alternative ground state conditions (Kolodziejczyk et al., 2015b). Although there was no difference in global transcriptional heterogeneity between conditions, gene sets that included pluripotency factors were more heterogeneous if cells had been cultured in serum and LIF than in either of the ground state conditions. Taken together, these results suggest a model whereby mouse ESCs are afforded the opportunity to access lineage specification programs through stochastic expression of pluripotency factors, which is perhaps facilitated by lower H3K27me3 at these lineage regulators. However, the extent to which this model is applicable to early fate decisions in transiently pluripotent cells of the blastocyst has not been addressed.
Defining and refining cell identity using scRNA-Seq molecular profiles
A number of recent studies have also applied scRNA-Seq to study post-implantation development and beyond, focusing primarily on defining the cellular composition of diverse tissues and populations at different developmental time points. These investigations range from defining the molecular profiles of hematopoietic stem cells (HSCs) from mouse embryos (Zhou et al., 2016) and the transcriptional landscape of heart development (DeLaughter et al., 2016; Li et al., 2016a), to comparing cell type diversity in the embryonic midbrain between human and mouse (La Manno et al., 2016) and obtaining initial cellular censuses of the murine spleen (Jaitin et al., 2014), cortex and hippocampus (Zeisel et al., 2015). We list many of these studies in Table 2 but note that more studies are being published every month. Here, we focus our discussion on human radial glial (RG) cell diversity in the developing neocortex, which has been the subject of several distinct studies.
RG cells, which give rise to most of the neurons of the neocortex and, at subsequent stages of development, to astrocytes (Kriegstein and Alvarez-Buylla, 2009), reside in the ventricular and outer subventricular zone of the neocortex. RG cells from these regions (termed vRG and oRG cells, respectively) have distinct functional and morphological characteristics, but the molecular profiles that determine these traits have remained elusive, as have their relationship to each other and to intermediate progenitor cells (IPCs), owing to the inability to prospectively isolate pure and relatively unharmed vRG and oRG cells. This challenge was overcome by a pair of studies, the first of which was a proof-of-principle analysis demonstrating the feasibility of single-cell profiling of single human neocortex-derived primary cells (Pollen et al., 2014). In this study, the authors applied scRNA-Seq to 24 cells from the developing (gestational week 16-21) human neocortex and were able to find expression signatures that distinguish RG cells from newborn neurons. They presented data suggesting that even low-coverage sequencing (∼50,000 reads per cell) can be sufficient for gross cell type classification. By profiling 393 human cortical germinal zone cells using scRNA-Seq, the same group later distinguished oRG from vRG cells. They found that oRG cells are enriched for genes related to cellular migratory behavior and extracellular matrix, such asHOPXandTNC, whereas vRG express CRYAB, PDGFD,TAGLN2, FBXO32 and PALLD (Pollen et al., 2015). They also described a transcriptional state that characterized putative intermediate progenitors, but found that the distinct nature of this state was not readily compatible with the
model of continuous transition from RG to IPC to neuron that had been proposed based on FACS-isolated bulk RNA-Seq and scRNA-Seq of fewer cells (Johnson et al., 2015). A separate study (Thomsen et al., 2015) reported a novel method for sequencing RNA from fixed and stained single cells (‘fixed and recovered single cell RNA’ or FRISCR) and applied this to corroborate the distinct vRG and oRG signatures. Regrettably, none of these studies applied temporal reconstruction to their data, which might have provided new data-driven hints to the temporal relationships between RG cells, IPCs, neuroblasts and neurons.
Pseudotime: understanding lineage progression using scRNA-Seq
Inferring temporal trajectories from‘snap-shots’of single cells has already proven to be so attractive that it has created a virtual cottage industry of computationalists dedicated to devising and improving new methods. One of the most powerful outcomes of these methods is the identification of signaling pathways and genetic circuits that contribute to cell state transitions, which thereby generates specific and testable hypotheses. Some notable and recent examples of applying pseudotime analytics to diverse developmental contexts include the specification of human mesoderm (Loh et al., 2016) and endoderm (Chu et al., 2016) derivatives from pluripotent stem cells, and the specification of tissue-resident macrophages from erythroid-myeloid progenitors (Mass et al., 2016). Here, we discuss the application of temporal inference, or pseudotime, methods to explore the progression of quiescent neural stem cells (NSCs) to neurons.
In adult murine brains, NSCs can be found in the subventricular zone (SVZ) and the subgranular zone (SGZ) of the dentate gyrus, although there is functional and phenotypic heterogeneity within NSC pools from either region, i.e. individual NSCs differ in their proliferative tendency and their expression of selected NSC-marker genes. This issue of heterogeneity was recently examined by applying scRNA-Seq to NSCs and their progeny isolated from the dentate gyrus (at one time point), as marked by Nestin-CFP (Shin et al., 2015). Six different states were identified and the pseudotime algorithm Waterfall was used to place cells from five of these states onto a continuous progression from quiescent NSCs to intermediate progenitor cells. Enrichment analysis across these states uncovered a gradual decrease in expression of Acyl-CoA synthetases and components of the glycolytic metabolism machinery, and a concomitant upregulation of ribosomal and spliceosome genes, and genes involved in oxidative phosphorylation. Based on these findings, it was proposed that the sequential reduction of signaling pathway genes reflects the importance of the niche role served by NSCs of both maintaining the NSC state and allowing it to respond rapidly to perturbations therein.
In a different study, scRNA-Seq was applied to prospectively isolated populations of NSCs and neuroblasts from the SVZ (Llorens-Bobadilla et al., 2015). Dimension reduction analysis clearly identified three distinct populations corresponding to oligodendrocytes, NSCs and neuroblasts. Unsupervised hierarchical clustering of the cells revealed four distinct NSC states. By ordering these cells using Monocle, the authors were able to attribute each NSC state to a developmental time point spanning from a dormant stage to a primed quiescent stage, to an early activated stage and finally to a dividing stage. Similar to the metabolic and ribosomal dynamics of NSC differentiation in the SGZ, SVZ NSCs also express relatively higher levels of glycolytic and fatty acid metabolism genes in the quiescent stages and lower levels of ribosomal genes. However, unlike the situation with SGZ NSCs, it was found that subsets of SVZ NSC transcription factors reflective of distinct neuronal sub-types
DEVEL
O
Table 2. Single-cell RNA-Seq analyses of differentiated cell types
Study Cell type(s) Primary Species Cells Genes Method Summary
Brennecke et al. (2013)
Root quiescent center cells, root epidermis and murine immune
Yes Arabidopsis, Human
104 NA Tang Method to model gene-specific biological and technical transcriptional noise Picelli et al.
(2013)
HEK293T, DG-75, C2C12, MEF No Human 252 10,000 Smart-Seq
Smart-Seq2 protocol introduced; resulted in increased cDNA length and yield
Wu et al. (2013) HCT116 No Human 109 4750 Smart-Seq
Evaluation of sensitivity and accuracy of various single-cell RNA-Seq methods
Grindberg et al. (2013)
Dentate gyrus neurons, NPC nucleus, NPC cell
Yes Mouse 8 NA Tang Demonstration of nuclear isolation followed by scRNA-Seq in tissues where intact cell isolation is difficult Marinov et al.
(2014)
Lymphoblastoid cell line No Human 15 NA Smart-Seq
Absolute quantification of RNA molecules per gene using spike-in-based quantification
Jaitin et al. (2014)
Spleen Yes Mouse 4590 553
MARS-Seq
Automated massively parallel single-cell RNA sequencing forin vivo sampling of multiple cells and FACS-based sorting into wells Trapnell et al.
(2014)
Myoblast Yes Human 279 5273
Smart-Seq
Describes Monocle: one of the first pseudotime algorithms Treutlein et al.
(2014)
Lung epithelia Yes Mouse 198 3500 Smart-Seq
Characterized cell types and developmental hierarchies in the developing lung
Brunskill et al. (2014)
Kidney Yes Mouse 235 NA
Smart-Seq
Created an atlas of gene expression profiles in different stages of kidney development and provided evidence for multi-lineage priming Shalek et al.
(2014)
BMDC Yes Mouse 1775 6313
Smart-Seq
Highlighted the importance of intercellular communication in establishing cell heterogeneity, and showed modes of establishment of complex dynamic responses of multicellular populations Patel et al.
(2014)
Glioblastoma Yes Human 430 NA
Smart-Seq
Revealed cellular heterogeneity in regulatory programs pertinent to the biology and hence treatment of glioblastoma tumors
Pollen et al. (2014)
CML line, hiPSC, keratinocytes, ductal carcinoma,
lymphoblastoid cells, APL cells, fibroblast, neural progenitors, fetal neurons
Yes Human 301 5000 Smart-Seq
Established a strategy to compare heterogeneous cell populations in an unbiased manner using microfluidics-based cell capture followed by low coverage sequencing
Zeisel et al. (2015)
Neocortical and hippocampus neurons
Yes Mouse 3315 15,310 STRT-Seq
Characterized the cell types present in the mouse cortex and
hippocampus, and identified novel cell types and their corresponding marker genes
Macosko et al. (2015)
HEK293T, fibroblasts and retinal cells
Yes Human, mouse
50,401 6177.5 Smart-Seq
Description of Drop-Seq: a microfluidics-based platform that enables capture, lysis and barcoding of thousands of single cells
Llorens-Bobadilla et al. (2015)
Adult radial glial cells, neuroblasts Yes Mouse 130 NA Smart-Seq
Identified lineage-specific neural stem cells in the subventricular zone
Shin et al. (2015) Neural progenitors Yes Mouse 168 NA Smart-Seq
Characterized adult hippocampal quiescent neural stem cells; described Waterfall, another pseudotime algorithm Pollen et al.
(2015)
Cortical germinal zone cells Yes Human 393 NA Smart-Seq
Revealed that radial glia located in the outer subventricular zone support brain expansion by increasing proliferative potential at the niche during cortical development
Continued
DEVEL
O
Table 2. Continued
Study Cell type(s) Primary Species Cells Genes Method Summary
Thomsen et al. (2015)
Radial gial, intermediate progenitor cells
Yes Human 255 NA Smart-Seq
Developed FRISCR (fixed and recovered intact single-cell RNA), which can profile transcriptomes of individual cells
Hanchate et al. (2015)
Olfactory sensory neurons Yes Mouse 85 NA Smart-Seq
Discovered that, unlike mature olfactory neurons [which express only one of the 1000 odorant receptors (Olfrs)], immature neurons can express multiple Olfrs Camp et al.
(2015)
iPSC and ESC-derived cerebral organoid cells
No Human 508 NA
Smart-Seq
Comparison of cerebral organoids and fetal neocortex with regards to cell composition and progenitor-to-neuron lineage relationships Li et al. (2016b) Pancreatic islet cells Yes Human 64 NA
Smart-Seq
Identified TFs specific to islet subtypes
Tasic et al. (2016)
Cortical neurons Yes Mouse 1679 NA Smart-Seq
Constructed a cellular taxonomy of the primary visual cortex in adult mice Angermueller
et al. (2016)
ESC No Mouse 61 5000
G&T-Seq
Developed scM&T-Seq, which allows transcriptome and methylome profiling of single cells Macaulay et al.
(2016)
Hematopoietic progenitors Yes Zebrafish 363 3500 Smart-Seq
Refined the conventional lineage tree of hematopoiesis to thrombocytes Xin et al. (2016) Pancreatic islet cells Yes Mouse 341 NA
Smart-Seq
Assessed the Fluidigm C1 system using islets as the cell source and discovered limitations in the cell capture microfluidic device Zhou et al.
(2016)
Pre-HSC and HSC Yes Mouse 99 5875 Tang Dissected the molecular mechanisms involved in the stepwise generation of hematopoietic stem cells and characterized purified nascent pre-HSCs
Eltahla et al. (2016)
T cells Yes Human 56 NA
Smart-Seq
Proposed a novel method (VDJpuzzle) to study T-cell heterogeneity by linking gene expression profiles; reconstructed TCRαβusing scRNA-Seq of Ag-specific T cells
Gao et al. (2016) Dentate gyrus neurons Yes Mouse 84 NA Smart-Seq
Classified postnatal immature neurons into distinct developmental lineages as they show diverging expression profiles
Liu et al. (2016) Neocortical cells Yes Human 226 NA Smart-Seq
Profiled lncRNA expression in human neocortical cells by performing strand-specific scRNA-Seq during various developmental stages Nelson et al.
(2016)
Placenta cell Yes Mouse 448 15,402 Tang Provided insights into the various cell types present in the maternal-fetal interface
Petropoulos et al. (2016)
Pre-implantation embryonic tissue
Yes Human 1529 8500 Smart-Seq
Provided a comprehensive transcriptional map of human pre-implantation development, revealing lineage and X-chromosome dynamics Nowakowski
et al. (2016)
Cerbral organoid cell No Human 210 NA Smart-Seq
Explored putative Zika virus entry proteins in neural stem cells Li et al. (2016c) Growth plate cells Yes Mouse 217 9000
Smart-Seq
Developed Sinova, a spatial reconstruction method; used the pipeline to analyze growth-plate development with high temporal and spatial resolution
Loh et al. (2016) ESC-derived mesoderm No Human 651 NA Smart-Seq
Provided a stepwise map of developmental pathways that specify diverse mesoderm-derived lineages
Gokce et al. (2016)
Striatum Yes Mouse 1208 NA
Smart-Seq
Constructed the cellular taxonomy of the mouse striatum and revealed the
Continued
DEVEL
O
(e.g. dorsal, ventral, dorsolateral) were correlated, consistent with the notion that both active and quiescent NSCs are predisposed or even committed towards specific lineages.
Insights into the‘Janus’progenitor state
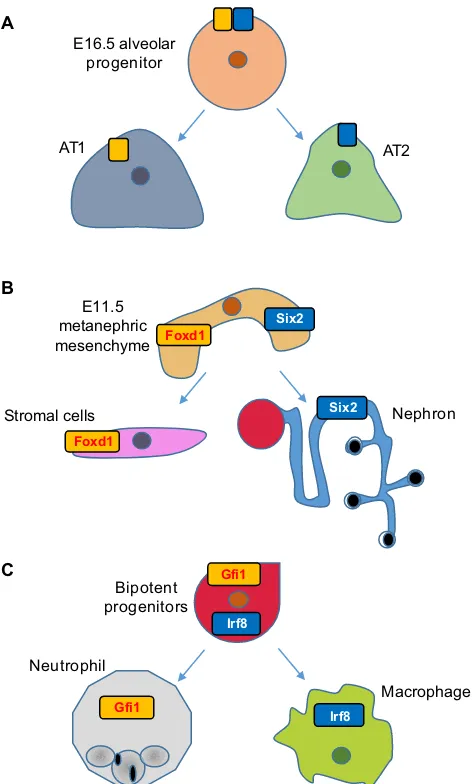
It is possible that, between the∼40 rounds of cell divisions through which the zygote gives rise to all mature cell types, there is a
[image:11.612.47.563.68.610.2]progenitor stage during which the cell type-specific expression programs of related but distinct cell types are simultaneously co-expressed (Fig. 3). Evocative of Janus–the two-faced Roman deity of gateways and transitions – this state would comprise multiple transcriptional programs that, later in development, are uniquely attributable to a single cell type. Such a state was identified when studying the events that regulate the developmental
Table 2. Continued
Study Cell type(s) Primary Species Cells Genes Method Summary
diversity between the various striatal cell types
Mass et al. (2016)
Tissue-resident macrophages Yes Mouse 408 NA MARS-Seq
Analyzed the specification of tissue-resident macrophages and proposed their subsequent differentiation to be an integral part of organogenesis
Chu et al. (2016) Pluripotent stem cell differentiated endoderm derivatives
No Human 1776 NA Smart-Seq
Elucidated novel regulators of mesendoderm transition to definitive endoderm by combining scRNA-Seq and genetic approaches
Tintori et al. (2016)
Early embryo Yes C. elegans 219 8575 Smart-Seq
Provided a resource and a visualization tool for the
transcriptional profiles of each cell until the 16-cell stage of theC. elegansembryo
Gury-BenAri et al. (2016)
Intestinal innate lymphoid cells Yes Mouse 1129 NA MARS-Seq
Identified diversity in innate lymphoid cells of the gut that results from signaling from the local microbiome population
Habib et al. (2016)
Hippocampal neurons Yes Mouse 1367 5100 Smart-Seq
Described a method to sequence individual dividing cells by combined single-nucleus RNA-Seq (sNuc-Seq) with EdU pulse labeling Olsson et al.
(2016)
Multipotent progenitor cells; common myeloid progenitor cells; granulocyte monocyte progenitor cells
Yes Mouse 382 NA Smart-Seq
Combined iterative clustering and guide-gene selection with scRNA-Seq to dissect mixed lineage states of a multipotent progenitor population into macrophage or neutrophil lineage specification Nath et al.
(2016)
ALA neuron Yes C. elegans 9 8133 STRT-Seq
Investigated downstream
mechanisms of a neuro-secretory cell that promotes sleep Yu et al. (2016) Bone marrow cells Yes Mouse 497 8758
Smart-Seq
Identified a molecular marker for a novel innate lymphoid cell precursor that could potentially be
manipulated for use in immunotherapy La Manno et al.
(2016)
Ventral midbrain cell Yes Mouse, Human
3884 NA STRT-Seq
Analyzed the time-course of ventral midbrain development and provided a method to assess the fidelity of iPSC-derived dopaminergic neurons
Kee et al. (2016) Lmx1a neuron Yes Mouse 550 NA Smart-Seq
Revealed a relationship between differentiating dopamine and sub-thalamic nucleus lineages, which could have implications in the treatment of Parkinson’s disease DeLaughter
et al. (2016)
129SV cardiac cells Yes Mouse 1133 NA Smart-Seq
Obtained dynamic spatiotemporal gene expression profiles for distinct cardiomyocyte populations across development
Li et al. (2016a) Murine heart cells Yes Mouse 2233 NA Smart-Seq
Uncovered chamber-specific genes in the embryonic mouse heart
BMDC, bone marrow-derived dendritic cell; CML, chronic myeloid leukemia; FACS, fluorescence-activated cell sorting; FRISCR, fixed and recovered single cell RNA; HSC, hematopoietic stem cell; iPSC, induced pluripotent stem cell; MARS-Seq, massively parallel single-cell RNA sequencing; NA, not applicable; NPC, neural progenitor cell; MEF, mouse embryonic fibroblast; scM&T-Seq, single-cell genome-wide methylome and transcriptome sequencing; STRT-Seq, single-cell tagged reverse transcription sequencing; TFs, transcription factors.
DEVEL
O
transformation of the lung bronchial tree into alveolar air sacs (Treutlein et al., 2014). Analysis of this stage of lung development had previously been impaired by the paucity of cells involved and the absence of markers that could be used to isolate pure populations of progenitors. However, these issues were avoided by applying scRNA-Seq to 198 different cells of the developing murine lung: E14.5 bronchial progenitors, E16.5 cells undergoing sacculation, E18.5 distal lung epithelial cells and mature alveolar type 2 (AT2) cells (Treutlein et al., 2014). The authors used PCA to define distinct cell types within the 80 E18.5 cells to find five major clusters or groups of cells. By examining the expression of genes representative of distinct lung cell types, they could annotate four of these groups of cells as either epithelial, ciliated, AT1 or AT2. Because the fifth group expressed markers of both AT1 and AT2, it
was hypothesized that this population represented a bipotent progenitor of AT1 and AT2 cells. This hypothesis was consistent with single-cell qPCR data of E16.5 alveolar progenitors, which also express markers of both alveolar progenitors, and implies that the AT1/AT2 fate choice entails the active repression of alternative lineages rather than selective activation. Notably, bipotent progenitors were shown by immunofluorescence to co-express AT1 and AT2 marker genes, making it unlikely that they represent expression profiles of doublets, as has been reported in the context of pancreatic islets (Xin et al., 2016) and in species-mixing experiments (Macosko et al., 2015).
The observation of this dual state has raised several provocative questions. First, by what mechanisms are the genetic programs of alternate lineages repressed? Hopx, a transcriptional repressor that has been implicated in maturation in a wide range of lineages, was found to mark AT1 cells in this study, but it is also expressed in bipotent progenitors, so its expression cannot be the initiating cell fate event. In fact, no AT-specific lineage factor appears to be induced. Therefore, it is possible that transcriptional repressors of the alternate lineage were undetectable using scRNA-Seq due to low copy number, or that alternative mechanisms of repression, such as microRNAs, which currently are not profiled in scRNA-Seq, are major contributors to the differentiation of these alveolar lineages. Alternatively, post-transcriptional events could be the major drivers of this fate decision.
Second, how pervasive are dual states in development? As more scRNA-Seq studies are performed, we will gain a better sense of this, but there are already some hints that it is not an idiosyncrasy of the lung. Reminiscent of the bipotent progenitor dual-state is the observation that Foxd1, which marks stromal-committed cells, and Six2, which marks nephron-stromal-committed cells, are co-expressed in single cells of E11.5 metanephric mesenchyme (Brunskill et al., 2014). This observation was made originally using single-cell microarrays and scRNA-Seq, and co-expression was also confirmed at the protein level, albeit at a lower frequency. At the time, this observation was attributed to stochastic expression because, unlike the lung bipotent progenitor cells, the dual-expressing metanephric mesenchyme cells do not otherwise reflect an ensemble of stromal and nephron progenitor profiles. However, it is possible that the co-expressing metanephric mesenchyme cells represent the tail end of a fate-decision process and, therefore, sampling more cells at earlier time points would clarify this issue.
Another example of dual-expressing progenitors was uncovered by the application of scRNA-Seq to 85 developing olfactory sensory neurons (Hanchate et al., 2015). In this approach, Monocle was applied to reconstruct a temporal trajectory of the 85 cells and to assign them to four distinct classes: progenitors, precursors, and immature and mature neurons. The authors found that almost half of the immature neurons expressed more than one receptor, and as the cells matured they exhibited increased expression of a selected receptor and repressed the alternative receptor genes, a finding validated by single-molecule FISH. In general, a better understanding of when dual states are employed, and of the molecular basis by which they are initiated, permitted and resolved, will enable us to speculate on a more fundamental question: what is the purpose of this duality? Does it allow progenitors to perform functions during development that are later distributed to more-specialized cell types? Does it provide greater robustness to environmental perturbations during development? Or is it simply a neutral consequence of how cell type-specific circuitry is encoded and elaborated during development?
AT2 AT1
E16.5 alveolar progenitor A
Nephron Stromal cells
Foxd1
Six2
E11.5 metanephric mesenchyme B
Six2
>?", Macrophage
Neutrophil
Bipotent progenitors
Irf8
Gfi1
Irf8
Gfi1 C
[image:12.612.56.292.55.447.2]Foxd1
Fig. 3. The‘Janus’progenitor state.scRNA-Seq has enabled the identification of embryonic progenitors that simultaneously express genes that were previously suspected of being lineage specific. (A) The PCA analysis of scRNA-Seq profiles of 198 developing murine lung cells has identified a cluster that expresses markers for both AT1 and AT2 cells, corroborating with single-cell qPCR data of E16.5 alveolar progenitors. (B) scRNA-Seq profiles of E11.5 metanephric mesenchyme has identified cells that co-express Foxd1 and Six2, which mark stromal-committing cells and nephron-committing cells, respectively. (C) A binary cell fate decision between the macrophage lineage and the neutrophil lineage was unveiled when bipotent progenitors were shown to co-express Irf8 and Gfi1, which regulate macrophage and neutrophil specification, respectively.
DEVEL
O
Conclusions
As we have summarized here, scRNA-Seq-based approaches are being used increasingly to provide insights into various aspects of developmental and stem cell biology. Such studies have defined the transcriptional programs of the earliest stages of mammalian development, have implicated regulated transcriptional heterogeneity as a contributor to the pluripotent state, and have uncovered an unexpected yet widespread pattern of dual identity in embryonic progenitors. However, there are several substantial obstacles to realizing the full potential of scRNA-Seq when applied to development. First, the isolation of intact, unperturbed single cells from dissociated tissue remains a major challenge. Methods such as FRISCR, in which cells are fixed rapidly, promise to ameliorate some of these issues. Second, what is a biological replicate of a single cell? Several groups have attempted cell splitting to assess technical variability but this has not become widespread in practice, likely due to technical challenges in evenly splitting cells and maintaining a modicum of sensitivity. In general, distinguishing technical noise from true biological noise is an area of very active research, and synthetic RNA spike-ins (see Glossary, Box 1) have so far proven to be the most common approach to deal with this issue (Marinov et al., 2014). Third, most scRNA-Seq methods are polyA-centric, thus limiting our ability to measure non-polyA RNA at a single cell level. Perhaps the most significant barrier is the limited efficiency of reverse transcription, which leads to limited sensitivity. A final substantial challenge in the field will be the development of computational and experimental approaches that enable some level of data integration across studies. As these issues are tackled, and as scRNA-Seq is applied more broadly, we anticipate a time when there will be enough data to develop quantitative definitions of cell type identity throughout development.
Competing interests
The authors declare no competing or financial interests.
Funding
The authors’research is funded by the National Institutes of Health (National
Institute of Diabetes and Digestive and Kidney Diseases) (K01DK096013). Deposited in PMC for release after 12 months.
References
Achim, K., Pettit, J.-B., Saraiva, L. R., Gavriouchkina, D., Larsson, T., Arendt, D.
and Marioni, J. C.(2015). High-throughput spatial mapping of single-cell
RNA-seq data to tissue of origin.Nat. Biotechnol.33, 503-509.
Angerer, P., Haghverdi, L., Büttner, M., Theis, F. J., Marr, C. and Buettner, F.
(2015). Destiny: diffusion maps for large-scale single-cell data in R.Bioinformatics
32, 1241-1243.
Angermueller, C., Clark, S. J., Lee, H. J., Macaulay, I. C., Teng, M. J., Hu, T. X.,
Krueger, F., Smallwood, S. A., Ponting, C. P., Voet, T. et al.(2016). Parallel
single-cell sequencing links transcriptional and epigenetic heterogeneity.Nat.
Methods13, 229-232.
Bacher, R. and Kendziorski, C.(2016). Design and computational analysis of
single-cell RNA-sequencing experiments.Genome Biol.17, 63.
Bandura, D. R., Baranov, V. I., Ornatsky, O. I., Antonov, A., Kinach, R., Lou, X.,
Pavlov, S., Vorobiev, S., Dick, J. E. and Tanner, S. D.(2009). Mass cytometry:
technique for real time single cell multitarget immunoassay based on inductively
coupled plasma time-of-flight mass spectrometry.Anal. Chem.81, 6813-6822.
Bendall, S. C., Davis, K. L., Amir, E.-A. D., Tadmor, M. D., Simonds, E. F., Chen,
T. J., Shenfeld, D. K., Nolan, G. P. and Pe’er, D.(2014). Single-cell trajectory
detection uncovers progression and regulatory coordination in human B cell
development.Cell157, 714-725.
Bian, Q. and Cahan, P.(2016). Computational tools for stem cell biology.Trends
Biotechnol.34, 993-1009.
Blakeley, P., Fogarty, N. M., del Valle, I., Wamaitha, S. E., Hu, T. X., Elder, K.,
Snell, P., Christie, L., Robson, P., Niakan, K. K. et al.(2015). Defining the three
cell lineages of the human blastocyst by single-cell RNA-seq.Development142,
3613-3613.
Brady, B. L., Brady, B. L., Steinel, N. C., Steinel, N. C., Bassing, C. H. and
Bassing, C. H. (2010). Antigen receptor allelic exclusion: an update and
reappraisal.J. Immunol.185, 3801-3808.
Braude, P., Braude, P., Bolton, V., Bolton, V., Moore, S. and Moore, S.(1988).
Human gene expression first occurs between the four- and eight-cell stages of
preimplantation development.Nature332, 459-461.
Brennecke, P., Anders, S., Kim, J. K., Kołodziejczyk, A. A., Zhang, X.,
Proserpio, V., Baying, B., Benes, V., Teichmann, S. A., Marioni, J. C. et al.
(2013). Accounting for technical noise in single-cell RNA-seq experiments.Nat.
Methods10, 1093-1095.
Brunskill, E. W., Park, J.-S., Chung, E., Chen, F., Magella, B. and Potter, S. S.
(2014). Single cell dissection of early kidney development: multilineage priming.
Development141, 3093-3101.
Buenrostro, J. D., Wu, B., Litzenburger, U. M., Ruff, D., Gonzales, M. L.,
Snyder, M. P., Chang, H. Y. and Greenleaf, W. J. (2015). Single-cell
chromatin accessibility reveals principles of regulatory variation.Nature523,
486-490.
Buettner, F., Natarajan, K. N., Casale, F. P., Proserpio, V., Scialdone, A., Theis,
F. J., Teichmann, S. A., Marioni, J. C. and Stegle, O.(2015). Computational
analysis of cell-to-cell heterogeneity in single-cell RNA-sequencing data reveals
hidden subpopulations of cells.Nat. Biotechnol.33, 155-160.
Buganim, Y., Faddah, D. A., Cheng, A. W., Itskovich, E., Markoulaki, S., Ganz,
K., Klemm, S. L., van Oudenaarden, A. and Jaenisch, R.(2012). Single-cell
expression analyses during cellular reprogramming reveal an early stochastic and
a late hierarchic phase.Cell150, 1209-1222.
Cacchiarelli, D., Trapnell, C., Ziller, M. J., Soumillon, M., Cesana, M., Karnik, R.,
Donaghey, J., Smith, Z. D., Ratanasirintrawoot, S., Zhang, X. et al.(2015).
Integrative analyses of human reprogramming reveal dynamic nature of induced
pluripotency.Cell162, 412-424.
Cahan, P. and Daley, G. Q.(2013). Origins and implications of pluripotent stem cell
variability and heterogeneity.Nat. Rev. Mol. Cell Biol.14, 357-368.
Camp, J. G., Badsha, F., Florio, M., Kanton, S., Gerber, T., Wilsch-Bräuninger,
M., Lewitus, E., Sykes, A., Hevers, W., Lancaster, M. et al.(2015). Human
cerebral organoids recapitulate gene expression programs of fetal neocortex
development.Proc. Natl. Acad. Sci. USA112, 15672-15677.
Chambers, I., Silva, J., Colby, D., Nichols, J., Nijmeijer, B., Robertson, M.,
Vrana, J., Jones, K., Grotewold, L. and Smith, A.(2007). Nanog safeguards
pluripotency and mediates germline development.Nature450, 1230-1234.
Chen, H., Guo, J., Mishra, S. K., Robson, P., Niranjan, M. and Zheng, J.(2015).
Single-cell transcriptional analysis to uncover regulatory circuits driving cell fate
decisions in early mouse development.Bioinformatics31, 1060-1066.
Chu, L.-F., Leng, N., Zhang, J., Hou, Z., Mamott, D., Vereide, D. T., Choi, J.,
Kendziorski, C., Stewart, R. and Thomson, J. A.(2016). Single-cell RNA-seq
reveals novel regulators of human embryonic stem cell differentiation to definitive
endoderm.Genome Biol.17, 173.
Cusanovich, D. A., Daza, R., Adey, A., Pliner, H. A., Christiansen, L.,
Gunderson, K. L., Steemers, F. J., Trapnell, C. and Shendure, J.(2015).
Multiplex single-cell profiling of chromatin accessibility by combinatorial cellular
indexing.Science348, 910-914.
DeLaughter, D. M., Bick, A. G., Wakimoto, H., McKean, D., Gorham, J. M.,
Kathiriya, I. S., Hinson, J. T., Homsy, J., Gray, J., Pu, W. et al.(2016).
Single-cell resolution of temporal gene expression during heart development.Dev. Cell
39, 480-490.
Deng, Q., Ramskold, D., Reinius, B. and Sandberg, R.(2014). Single-cell
RNA-seq reveals dynamic, random monoallelic gene expression in mammalian cells.
Science343, 193-196.
Dey, S. S., Kester, L., Spanjaard, B., Bienko, M. and van Oudenaarden, A.
(2015). Integrated genome and transcriptome sequencing of the same cell.Nat.
Biotechnol.33, 285-289.
Dobson, A. T., Dobson, A. T., Raja, R., Abeyta, M. J., Taylor, T., Shen, S., Haqq,
C. and Pera, R. A. R.(2004). The unique transcriptome through day 3 of human
preimplantation development.Hum. Mol. Genet.13, 1461-1470.
Eberwine, J., Yeh, H., Miyashiro, K., Cao, Y., Nair, S., Finnell, R., Zettel, M. and
Coleman, P.(1992). Analysis of gene expression in single live neurons.Proc.
Natl. Acad. Sci. USA89, 3010-3014.
Eltahla, A. A., Rizzetto, S., Pirozyan, M. R., Betz-Stablein, B. D., Venturi, V.,
Kedzierska, K., Lloyd, A. R., Bull, R. A. and Luciani, F.(2016). Linking the T cell
receptor to the single cell transcriptome in antigen-specific human T cells.
Immunol. Cell Biol.94, 604-611.
Etzrodt, M., Endele, M. and Schroeder, T. (2014). Quantitative single-cell
approaches to stem cell research.Cell Stem Cell15, 546-558.
Finak, G., McDavid, A., Yajima, M., Deng, J., Gersuk, V., Shalek, A. K.,
Slichter, C. K., Miller, H. W., McElrath, M. J., Prlic, M. et al.(2015). MAST: a
flexible statistical framework for assessing transcriptional changes and
characterizing heterogeneity in single-cell RNA sequencing data. Genome
Biol.16, 278.
Fraley, C. and Raftery, A. E.(2002). Taylor & Francis Online: model-based
clustering, discriminant analysis, and density estimation. J. Am. Stat. 97,
611-631.
Gao, Y., Wang, F., Eisinger, B. E., Kelnhofer, L. E., Jobe, E. M. and Zhao, X.
(2016). Integrative single-cell transcriptomics reveals molecular networks defining
neuronal maturation during postnatal neurogenesis. Cereb. Cortex 143,
1649-1654.