VIRTUALIZED DYNAMIC RESOURCE ALLOCATION
ALGORITHM FOR THE INTERNET DIFFSERV DOMAINS
AHMED JUMAA LAFTA AL-WASITY
INFORMATICS RESEARCH CENTRE
SCHOOL OF COMPUTING, SCIENCE AND ENGINEERING
UNIVERSITY OF SALFORD
SALFORD, UK
SUBMITTED IN PARTIAL FULFILMENT OF THE
REQUIREMENTS OF THE DEGREE OF DOCTOR OF
I
Abstract
Abstract
The Differentiated Services (DiffServ) architecture has been proposed for providing different levels of service to the Internet Protocol (IP) traffic. Current discussions in the DiffServ networks are focused on managing resources dynamically according to the traffic conditions of the DiffServ router (Per Hop Behaviour). Software Defined Networks (SDN) and Network Function Virtualisation (NFV) technologies have recently emerged in the research agenda to support researchers in managing network domains and to achieve better use of domain resources. This thesis introduces a new scheduling algorithm called “Dynamic Resource Allocation Management - Network Function Virtualization (DRAM-NFV)” to allocate the service classes resources in the proportional delay DiffServ domains. DRAM-NFV algorithm manages the resources among service classes within the edge routers of the DiffServ domains dynamically according to their traffic conditions and manages these resources between the DiffServ domains in the event of congestion based on their traffic conditions at the egress routers of the upstream domain and ingress routers of the downstream domain. The NFV executes the DRAM-NFV algorithm on a virtualized - Network as a Service (NaaS) - cloud infrastructure to manage the SDN controllers for the edge routers of the DiffServ domains through monitoring the traffic conditions in the service classes at the edge routers and reallocating the out-link resources of the edge routers among service classes.
A number of test scenarios were conducted in this research in order to test the performance of the DRAM-NFV algorithm. The performance of DRAM-NFV algorithm is compared with the performance of the DWFQ algorithm by comparing the average End to End Delay for service classes traffic and links utilization. The DWFQ algorithm cannot manage resources between DiffServ domains but can manage the resources locally and dynamically for each DiffServ domain separately.
II
downstream) DiffServ domains dynamically, in test scenario 3- Case Study 2, the average utilization for the highest priority class (SC1) for whole period of simulation at the destination
III
Acknowledgements
AcknowledgementsThe process of undertaking a doctoral study for four consecutive years can be consideredas a journey full of difficult challenges and unique experiences. In October 2013, I remember I spent some months to discover the research topic that I was to focus on, define the research problem and suggest a primitive solution for it. This was especially fraught as the subject of my research is cutting edge and there were few other studies in the field at that time. I can also remember days of disappointment and discouragement and sleepless nights when I was unable to achieve progress in my research and tackle the difficulties that I was facing in the research. At the same time, I felt great satisfaction when some parts of the research were completed and when finding solutions to the difficulties.
I had the great fortune to be guided during this journey by Dr. Adil Al-Yasiri. I hereby express my deep sense of gratitude to him for encouraging me, for his commitment to hold regular meetings every month to follow up the progress in this research, his thoughts, and his advice and recommendations which made this doctoral thesis possible. Throughout his supervision, I learned from his opinions and suggestions on how to process problems in scientific research. His constructive criticisms have contributed immensely to the evolution of my ideas about this research. Also I have benefited from his ideas and advice on developing my academic research skills.
Sincere thanks and gratitude go to my mother, father and my elder brother Dr. Mohammed who all live in Baghdad. They have always encouraged me to travel outside Iraq to complete my studies and they have always provided me with invaluable support. My special appreciation goes to my mother. Although her illness makes her unable to perform her activities normally, she is always praying for me and asking God to facilitate my success and help me in my studies. I am very much thankful to my brother who has taken care of the health of our parents and has taken on many other tasks for the whole duration of my study. I know well, that my family will be happy when I get the doctoral degree.
I would like to express my deep thanks to the Office of the Prime Minister of the Republic of Iraq - the Higher Committee for Educational Development in Iraq (HCED-IRAQ)1, the official sponsor of this scholarship for the obtaining of a doctoral degree in the field of Data Telecommunication and Networks from the University of Salford – Manchester, United Kingdom. Also, I would like to thank so much the Cultural Attaché of the Iraqi Embassy in London, UK and Al-Nahrain University – Baghdad, Iraq for their supports during the Ph.D. study period.
Special thanks go to all my relatives in the United Kingdom.
I am also grateful to many people that offered significant help and advice over the last four years. Finally, I would also like to thank the members of my thesis committee and the Informatics Research Centre, School of Computing, Science and Engineering in the University of Salford for the use of their facilities.
With my kindest wishes….
Ahmed Jumaa Lafta Al-Wasity June 2017
Greater Manchester – UK
1
IV
Table of Contents
Table of ContentsABSTRACT ... I ACKNOWLEDGEMENTS ... III TABLE OF CONTENTS ... IV LIST OF FIGURES ... VI LIST OF TABLES ... IX ABBREVIATIONS ... XI
1 CHAPTER ONE: INTRODUCTION ... 1
1.1 INTRODUCTION: ... 1
1.2 DIFFERENTIATED SERVICES: ... 1
1.3 RESEARCH PROBLEM: ... 4
1.4 SDN AND NFVTECHNOLOGIES: ... 5
1.5 RESEARCH MOTIVATION: ... 6
1.6 RESEARCH AIMS AND OBJECTIVES: ... 7
1.7 RESEARCH QUESTIONS: ... 7
1.8 RESEARCH METHODOLOGY: ... 8
1.9 THESIS OUTLINES: ... 10
2 CHAPTER TWO: PROPORTIONAL DELAY DIFFSERV AND RECENT DEVELOPMENT IN QUALITY OF SERVICE ... 11
2.1 INTRODUCTION: ... 11
2.2 PROPORTIONAL DELAY DIFFSERV (PDD)MODEL: ... 12
2.2.1 Standard Differentiated Service Classes: ... 13
2.2.2 Queue Management Techniques for Differentiated Services: ... 16
2.3 NETWORK VIRTUALISATION,SDN AND NFV: ... 17
2.4 CHAPTER SUMMARY: ... 21
3 CHAPTER THREE: LITERATURE REVIEW RELATING TO PROPORTIONAL DELAY DIFFSERV RESOURCE MANAGEMENT AND THE RECENT USES OF SDN AND NFV 23 3.1 INTRODUCTION: ... 23
3.2 RESOURCES ALLOCATION IN PROPORTIONAL DELAY DIFFSERV DOMAINS: ... 23
3.3 CONTRIBUTIONS OF THE SDN AND NFVTECHNOLOGIES: ... 28
3.4 THE CONTRIBUTION OF THIS RESEARCH: ... 30
3.5 CHAPTER SUMMARY: ... 31
4 CHAPTER FOUR: DRAM-NFV ALGORITHM: PRINCIPLE AND MATHEMATICAL MODEL ... 32
4.1 INTRODUCTION: ... 32
4.2 ALGORITHM PRINCIPLES: ... 32
4.3 OPENFLOW SWITCHES AND SDNCONTROLLER: ... 37
4.4 THE ALGORITHM’S MATHEMATICAL MODEL: ... 43
4.5 CHAPTER SUMMARY: ... 51
5 CHAPTER FIVE: DRAM-NFV ALGORITHM IMPLEMENTATION USING A SIMULATED ENVIRONMENT. ... 52
5.1 INTRODUCTION: ... 52
5.2 THE (NS3)NETWORK SIMULATION PROGRAM: ... 52
5.3 QUEUE MODEL SIMULATION: ... 53
5.3.1 Initialising the Simulation: ... 54
V
5.3.3 Traffic Scheduling: ... 56
5.3.4 Classification of Incoming Packets: ... 57
5.3.5 Calculation of Service Classes’ Scheduling Rates: ... 59
5.3.6 Calculating Service Class Weights: ... 65
5.3.7 Configuring Service Classes Scheduling Rates for the Edge Routers of a DiffServ Domain with Multiple Out-Ports: ... 67
5.3.8 Management of Service Classes Scheduling Rates across Different DiffServ Domains: 68 5.4 OPENFLOW QUEUE MESSAGE LAYER: ... 70
5.5 CHAPTER SUMMARY: ... 71
6 CHAPTER SIX: THE DRAM-NFV ALGORITHM: VALIDATION AND CRITICAL EVALUATION: ... 72
6.1 INTRODUCTION: ... 72
6.2 TRAFFIC MODEL SIMULATION TEST APPLICATIONS: ... 73
6.3 EXPERIMENTAL DESIGN OF THE EVALUATION PROCESS: ... 75
6.3.1 Test Scenario 1: ... 76
6.3.2 Test Scenario 2: ... 77
6.3.3 Test Scenario 3: ... 78
6.4 PERFORMANCE MEASUREMENTS IN RELATION TO THE SIMULATION OF THE DIFFERENTIATED SERVICES DOMAINS: ... 80
6.5 ANALYSIS OF THE SIMULATED PROPORTIONAL DELAY DIFFSERV QUEUE MODEL: ... 81
6.6 TEST SCENARIO 1ANALYSIS: ... 85
6.6.1 Case Study 1- Test Scenario 1 Analysis: ... 86
6.6.2 Case Study 2- Test Scenario 1 Analysis: ... 90
6.6.3 Case Study 3- Test Scenario 1 Analysis: ... 95
6.7 TEST SCENARIO 2ANALYSIS: ... 98
6.7.1 Case Study 1- Test Scenario 2 Analysis: ... 100
6.7.2 Case Study 2- Test Scenario 2 Analysis: ... 102
6.8 TEST SCENARIO 3ANALYSIS: ... 105
6.8.1 Case Study 1- Test Scenario 3 Analysis: ... 107
6.8.2 Case Study 2- Test Scenario 3 Analysis: ... 112
6.8.3 Case Study 3- Test Scenario 3 Analysis: ... 116
6.9 CHAPTER SUMMARY. ... 120
7 CHAPTER SEVEN: CONCLUSIONS AND RECOMMENDATIONS: ... 122
7.1 INTRODUCTION: ... 122
7.2 CONCLUSIONS: ... 122
7.3 REVIEW OF OBJECTIVES: ... 126
7.4 CHAPTER SUMMARY: ... 127
8 REFERENCES: ... 128
9 APPENDIXES: ... 133
A-1RESEARCH PROBLEM EXPERIMENT: ... 133
A-2:USE OF NS3CLASS REFERENCES IN THE SIMULATED QUEUE AND TRAFFIC MODEL: ... 138
A-2.1: In RDWQueue Model: ... 138
A-2.2: In TosApp Model: ... 138
A-3: QUEUE MODEL NS3SIMULATION CODE: ... 139
A-4:TRAFFIC MODEL TEST NS3SIMULATION CODE: ... 199
A-5:TEST SCENARIOS NETWORK TOPOLOGY SIMULATION USING NS3: ... 206
A-5.1: Test Scenario 1, Topology Simulation Diagram and NS3 Code: ... 208
A-5.2: Test Scenario 2, Topology Simulation Diagram and NS3 Code: ... 222
A-5.3: Test Scenario 3, Topology Simulation Diagram and NS3 Code: ... 242
A-6:SIMULATION PARAMETERS DEFINITION CODE ... 269
A-7:END TO END AVERAGE DELAY ANALYSIS CODE ... 273
A-8:OUTPUT FILE ANALYSIS CODE ... 279
VI
List of Figures
List of Figures
FIGURE 1-1,A TYPICAL DIFFSERV DOMAINS ARCHITECTURE. ... 2
FIGURE 1-2,RESEARCH PROBLEM. ... 5
FIGURE 1-3,RESEARCH METHODOLOGY. ... 10
FIGURE 2-1,IPV4 AND IPV6 HEADERS FIELDS. ... 14
FIGURE 2-2,DIFFSERV FIELD IN IP HEADER. ... 15
FIGURE 2-3,DSCP ALLOCATION TABLE. ... 16
FIGURE 2-4,ILLUSTRATION OF A NETWORK VIRTUALIZATION ENVIRONMENT. ... 17
FIGURE 2-5,NAAS BASED FRAMEWORK FOR NETWORK CLOUD CONVERGENCE. ... 19
FIGURE 4-1,PRINCIPLE OF THE DYNAMIC RESOURCE MANAGEMENT ALGORITHM WITHIN AND BETWEEN THE DIFFSERV DOMAINS USING THE CONCEPT OF THE NFV. ... 33
FIGURE 4-2, FLOW CHART OF THE DYNAMIC RESOURCES ALLOCATION MANAGEMENT ALGORITHM WITHIN AND BETWEEN DIFFSERV DOMAINS USING THE CONCEPT OF THE NFV. ... 35
FIGURE 4-3, FLOW CHART OF ILLUSTRATING THE PROCEDURE OF MANAGING RESOURCES BETWEEN DIFFSERV DOMAINS. ... 36
FIGURE 4-4,AN OVERVIEW OF SDN ARCHITECTURE. ... 38
FIGURE 4-5,OPENFLOW 1.2-METER TABLE. ... 40
FIGURE 4-6,OPENFLOW ENABLE SDN CONTROLLER AND FORWARDING DEVICES DIAGRAM. ... 41
FIGURE 4-7,DISTRIBUTED CONTROLLERS’ CONNECTIONS. ... 42
FIGURE 4-8, A REPRESENTATION OF THE SERVICE CLASS QUEUE AT AN UPDATE TIME INTERVAL K. ... 43
FIGURE 4-9,RELATION BETWEEN THE CONGESTION LEVEL AND THE SCHEDULING RATE UPDATE FACTOR. ... 50
FIGURE 5-1,FLOW CHART ILLUSTRATING THE ENQUEUING PROCESS. ... 56
FIGURE 5-2,FLOW CHART ILLUSTRATING THE SCHEDULING (DEQUEUING) PROCESS. ... 58
FIGURE 5-3, FLOW CHART ILLUSTRATING THE PROCESS OF CALCULATING THE AVERAGE QUEUE LENGTH FOR SERVICE CLASS QUEUES. ... 59
FIGURE 5-4, ESTIMATING AN OPTIMUM VALUE FOR THE SCALING FACTOR ∆. ... 60
FIGURE 5-5, FLOW CHART ILLUSTRATING THE PROCESS OF CALCULATING THE PACKET DELAY FOR A SERVICE CLASS. ... 61
FIGURE 5-6,FLOW CHART ILLUSTRATING THE PROCESS OF CALCULATING THE AVERAGE SERVICE CLASS QUEUE DELAY. ... 62
FIGURE 5-7, FLOW CHART ILLUSTRATING THE PROCESS OF CALCULATING THE SCHEDULING RATES FOR A DIFFSERV DOMAIN WHICH HAS THREE SERVICE CLASSES. ... 64
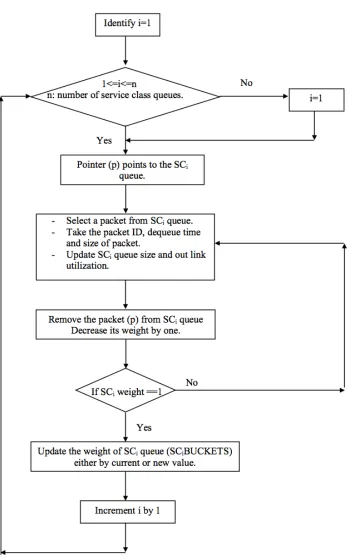
FIGURE 5-8, FLOW CHART ILLUSTRATING THE PROCEDURE FOR CALCULATING THE WEIGHTS OF SERVICE CLASS QUEUES ... 66
FIGURE 5-9, FLOW CHART OF CONFIGURING SERVICE CLASSES SCHEDULING RATES FOR THE EDGE ROUTERS WITH MULTIPLE OUT PORTS FUNCTION. ... 68
FIGURE 5-10, FLOW CHART ILLUSTRATING THE FUNCTION FOR THE MANAGEMENT OF SERVICE CLASSES’ SCHEDULING RATES ACROSS DIFFERENT DIFFSERV DOMAINS. ... 69
FIGURE 5-11,OPENFLOW MESSAGE STRUCTURE. ... 70
FIGURE 5-12,OPENFLOW QUEUE STATE QUERY MESSAGES. ... 70
FIGURE 6-1, TEST SCENARIO 1. ... 77
FIGURE 6-2,TEST SCENAIRO2. ... 78
FIGURE 6-3,TEST SCENAIRO3. ... 79
FIGURE 6-4,AVERAGE SERVICE CLASS QUEUE DELAYS AT THE INGRESS ROUTER OF THE DOWNSTREAM DIFFSERV DOMAIN ... 83
FIGURE 6-5,AVERAGE SERVICE CLASS QUEUE DELAYS AT THE EGRESS ROUTER OF AN UPSTREAM DIFFSERV DOMAIN ... 84
FIGURE 6-6,SC1 CONGESTION LEVEL - CASE STUDY 1, TEST SCENARIO 1 ... 87
FIGURE 6-7,SC2 CONGESTION LEVEL - CASE STUDY 1, TEST SCENARIO 1 ... 87
FIGURE 6-8,SC3 CONGESTION LEVEL - CASE STUDY 1, TEST SCENARIO 1 ... 87
FIGURE 6-9,SC1 UTILIZATION AT DOMAINS LINK - CASE STUDY 1, TEST SCENARIO 1. ... 88
FIGURE 6-10,SC2 UTILIZATION AT DOMAINS LINK - CASE STUDY 1, TEST SCENARIO 1. ... 89
FIGURE 6-11,SC3 UTILIZATION AT DOMAINS LINK - CASE STUDY 1, TEST SCENARIO 1. ... 89
VII
FIGURE 6-13,SC2 CONGESTION LEVELS IN RELATION TO THE DWFQ AND DRAM-NFV ALGORITHMS - CASE
STUDY 2, TEST SCENARIO 1. ... 91
FIGURE 6-14,SC3 CONGESTION LEVELS IN RELATION TO THE DWFQ AND DRAM-NFV ALGORITHMS - CASE STUDY 2, TEST SCENARIO 1. ... 92
FIGURE 6-15,SC1 AVERAGE QUEUE DELAY - CASE STUDY 2, TEST SCENARIO 1. ... 93
FIGURE 6-16,SC2 AVERAGE QUEUE DELAY - CASE STUDY 2, TEST SCENARIO 1 ... 93
FIGURE 6-17,SC3 AVERAGE QUEUE DELAY - CASE STUDY 2, TEST SCENARIO 1 ... 93
FIGURE 6-18,SC1 CONGESTION LEVEL - CASE STUDY 3, TEST SCENARIO 1 ... 95
FIGURE 6-19,SC2 CONGESTION LEVEL - CASE STUDY 3, TEST SCENARIO 1 ... 95
FIGURE 6-20,SC3 CONGESTION LEVEL - CASE STUDY 3, TEST SCENARIO 1 ... 96
FIGURE 6-21,SC1 MAXIMUM CONGESTION LEVEL USING THE DWFQ AND DRAM-NFV ALGORITHMS – CASE STUDY 1, TEST SCENARIO 2 ... 100
FIGURE 6-22,SC2 MAXIMUM CONGESTION LEVEL USING THE DWFQ AND DRAM-NFV ALGORITHMS - CASE STUDY 1, TEST SCENARIO 2 ... 100
FIGURE 6-23,SC3 MAXIMUM CONGESTION LEVEL USING THE DWFQ AND DRAM-NFV ALGORITHMS - CASE STUDY 1, TEST SCENARIO 2 ... 101
FIGURE 6-24,SC1 MAXIMUM CONGESTION LEVEL USING THE DWFQ AND DRAM-NFV ALGORITHMS – CASE STUDY 2, TEST SCENARIO 2 ... 102
FIGURE 6-25,SC2 MAXIMUM CONGESTION LEVEL USING THE DWFQ AND DRAM-NFV ALGORITHMS – CASE STUDY 2, TEST SCENARIO 2. ... 103
FIGURE 6-26,SC3 MAXIMUM CONGESTION LEVEL USING THE DWFQ AND DRAM-NFV ALGORITHMS – CASE STUDY 2, TEST SCENARIO 2. ... 103
FIGURE 6-27SC1 MAXIMUM CONGESTION LEVELS USING THE DWFQ AND DRAM-NFV ALGORITHMS - CASE STUDY 1, TEST SCENARIO 3. ... 107
FIGURE 6-28,SC2 MAXIMUM CONGESTION LEVELS USING THE DWFQ AND DRAM-NFV ALGORITHMS – CASE STUDY 1, TEST SCENARIO 3. ... 107
FIGURE 6-29,SC3 MAXIMUM CONGESTION LEVELS USING THE DWFQ AND DRAM-NFV ALGORITHMS - CASE STUDY 1, TEST SCENARIO 3. ... 108
FIGURE 6-30,SC1 MAXIMUM CONGESTION LEVEL WHEN USING A MIX OF THE DWFQ AND DRAM-NFV ALGORITHMS TO MANAGE THE UPSTREAM DOMAINS - CASE STUDY 1, TEST SCENARIO 3. ... 110
FIGURE 6-31,SC2 MAXIMUM CONGESTION LEVELS WHEN USING DWFQ AND DRAM-NFV ALGORITHMS TO MANAGE BOTH UPSTREAM DOMAINS - CASE STUDY 1, TEST SCENARIO 3. ... 111
FIGURE 6-32,SC3 MAXIMUM CONGESTION LEVEL USING DWFQ AND DRAM-NFV ALGORITHMS WITH MANAGING BOTH UPSTREAM DOMAINS -STUDY CASE 1, TEST SCENARIO 3. ... 111
FIGURE 6-33,SC1 MAXIMUM CONGESTION LEVEL USING THE DWFQ AND DRAM-NFV ALGORITHMS - CASE STUDY 2, TEST SCENARIO 3. ... 113
FIGURE 6-34,SC2 MAXIMUM CONGESTION LEVEL USING THE DWFQ AND DRAM-NFV ALGORITHMS - CASE STUDY 2, TEST SCENARIO 3. ... 113
FIGURE 6-35,SC3 MAXIMUM CONGESTION LEVEL USING THE DWFQ AND DRAM-NFV ALGORITHMS - CASE STUDY 2, TEST SCENARIO 3. ... 114
FIGURE 6-36,SC1 MAXIMUM CONGESTION LEVELS FOR BOTH THE DWFQ AND THE DRAM-NFV ALGORITHMS -CASE STUDY 3, TEST SCENARIO 3. ... 117
FIGURE 6-37,SC2 MAXIMUM CONGESTION LEVELS FOR BOTH THE DWFQ AND THE DRAM-NFV ALGORITHMS -CASE STUDY 3, TEST SCENARIO 3. ... 117
FIGURE 6-38,SC3 MAXIMUM CONGESTION LEVELS FOR BOTH THE DWFQ AND THE DRAM-NFV ALGORITHMS -CASE STUDY 3, TEST SCENARIO 3. ... 118
FIGURE 9-1,RESEARCH PROBLEM SIMULATION SCENARIO. ... 134
FIGURE 9-2,EXPLANATION OF RESEARCH PROBLEM -SC1 UTILIZATION AT THE LINK THAT CONNECTS THE UPSTREAM AND DOWNSTREAM DIFFSERV DOMAINS. ... 135
FIGURE 9-3,EXPLANATION OF RESEARCH PROBLEM -SC2 UTILIZATION AT THE LINK THAT CONNECTS THE UPSTREAM AND DOWNSTREAM DIFFSERV DOMAINS. ... 135
FIGURE 9-4,EXPLANATION OF RESEARCH PROBLEM-SC3 UTILIZATION AT THE LINK THAT CONNECTS THE UPSTREAM AND DOWNSTREAM DIFFSERV DOMAINS. ... 136
FIGURE 9-5,EXPLANATION OF RESEARCH PROBLEM -SC1 CONGESTION LEVEL AT THE INGRESS ROUTER OF THE DOWNSTREAM DOMAIN. ... 136
FIGURE 9-6,EXPLANATION OF RESEARCH PROBLEM-SC2 CONGESTION LEVEL AT THE INGRESS ROUTER OF THE DOWNSTREAM DOMAIN. ... 137
FIGURE 9-7,EXPLANATION OF RESEARCH PROBLEM -SC3 CONGESTION LEVEL AT THE INGRESS ROUTER OF THE DOWNSTREAM DOMAIN. ... 137
VIII
IX
List of Tables
List of Tables
TABLE 4-1,THE QOS-RELATED FEATURES AND CHANGES IMPLEMENTED IN THE DIFFERENT VERSIONS OF
OPENFLOW SPECIFICATION. ... 40
TABLE 4-2,SOME OF SDN CONTROLLER PROJECTS WITH REGARDS TO THEIR QOS SUPPORT. ... 42
TABLE 5-1, STATES FOR CALCULATING SERVICE CLASSES SCHEDULING RATES. ... 63
TABLE 5-2,STATES RELATED TO CALCULATING SERVICE CLASSES WEIGHTS. ... 65
TABLE 6-1, CHARACTERISTICS OF THE SIMULATED TRAFFIC APPLICATIONS PROFILES. ... 74
TABLE 6-2, CONFIGURATION OF THE SIMULATED WRED ... 83
TABLE 6-3, SERVICE CLASSES’ AVERAGE QUEUE DELAY RATIOS AND THEIR DELAY DIFFERENTIATED PARAMETER RATIOS FOR WHOLE PERIOD OF SIMULATION – AT THE INGRESS ROUTER OF A DOWNSTREAM DIFFSERV DOMAIN. ... 84
TABLE 6-4,CONFIGURATION PARAMETERS OF TEST SCENARIO 1. ... 85
TABLE 6-5,AVERAGE PERCENTAGE UTILIZATION FOR THE SERVICE CLASSES AT THE LINK THAT CONNECTS DIFFSERV DOMAINS -TEST SCENARIO 1, CASE STUDY 1. ... 88
TABLE 6-6,AVERAGE PERCENTAGE UTILIZATION FOR THE SERVICE CLASSES AT THE DESTINATION LINK -TEST SCENARIO 1, CASE STUDY 1. ... 89
TABLE 6-7,AVERAGE END-TO-END DELAY, TEST SCENARIO 1- CASE STUDY 1. ... 90
TABLE 6-8,AVERAGE PERCENTAGE UTILIZATION FOR THE SERVICE CLASSES AT THE LINK THAT CONNECTS DIFFSERV DOMAINS -TEST SCENARIO 1, CASE STUDY 2. ... 94
TABLE 6-9,AVERAGE END-TO-END DELAY, TEST SCENARIO 1- CASE STUDY 2. ... 94
TABLE 6-10,AVERAGE PERCENTAGE UTILIZATION FOR THE SERVICE CLASSES AT THE LINK THAT CONNECTS DIFFSERV DOMAINS -TEST SCENARIO 1, CASE STUDY 3. ... 96
TABLE 6-11,AVERAGE PERCENTAGE UTILIZATION FOR THE SERVICE CLASSES AT THE DESTINATION LINK -TEST SCENARIO 1, CASE STUDY 3. ... 97
TABLE 6-12,AVERAGE END-TO-END DELAY, TEST SCENARIO 1- CASE STUDY 3. ... 97
TABLE 6-13,CONFIGURATION PARAMETERS OF TEST SCENARIO 2. ... 99
TABLE 6-14,AVERAGE PERCENTAGE UTILIZATION FOR THE SERVICE CLASSES AT THE LINK THAT CONNECTS DIFFSERV DOMAINS -TEST SCENARIO 2, CASE STUDY 1. ... 101
TABLE 6-15,AVERAGE END-TO-END DELAY, TEST SCENARIO 2- CASE STUDY 1. ... 102
TABLE 6-16, AVERAGE PERCENTAGE UTILIZATION FOR THE SERVICE CLASSES AT THE LINK THAT CONNECTS DIFFSERV DOMAINS -TEST SCENARIO 2, CASE STUDY 2. ... 104
TABLE 6-17,AVERAGE PERCENTAGE UTILIZATION FOR THE SERVICE CLASSES AT THE DESTINATION LINK -TEST SCENARIO 2, CASE STUDY 2. ... 104
TABLE 6-18,AVERAGE END-TO-END DELAY, TEST SCENARIO 2- CASE STUDY 2. ... 104
TABLE 6-19,CONFIGURATION PARAMETERS OF TEST SCENARIO 3. ... 106
TABLE 6-20,AVERAGE PERCENTAGE UTILIZATION FOR THE SERVICE CLASSES AT THE LINK THAT CONNECTS THE UPSTREAM (DOMAIN 1) AND DOWNSTREAM DIFFSERV DOMAINS -TEST SCENARIO 3, CASE STUDY 1. ... 109
TABLE 6-21,AVERAGE PERCENTAGE UTILIZATION FOR THE SERVICE CLASSES AT THE DESTINATION LINK WHEN MANGING THE UPSTREAM DOMAIN (DOMAIN 1) ONLY -TEST SCENARIO 3, CASE STUDY 1. ... 109
TABLE 6-22,AVERAGE END-TO-END DELAY WHEN MANGING THE UPSTREAM DOMAIN (DOMAIN 1) ONLY, TEST SCENARIO 3- CASE STUDY 1. ... 110
TABLE 6-23,SERVICE CLASSES UTILIZATIONS WHEN MANAGING BOTH THE UPSTREAM DOMAINS OUT LINKS - CASE STUDY 1, TEST SCENARIO 3. ... 111
TABLE 6-24, SERVICE CLASSES UTILIZATIONS AT THE DESTINATION LINK WHEN MANAGING BOTH THE UPSTREAM DOMAINS OUT LINKS AND WHEN MANAGING ONLY A SINGLE UPSTREAM DOMAIN OUT LINK - CASE STUDY 1, TEST SCENARIO 3. ... 112
TABLE 6-25, SERVICE CLASSES AVERAGE END TO END DELAYS WHEN MANAGING BOTH THE UPSTREAM DOMAINS OUT LINKS AND WHEN MANAGING ONLY A SINGLE UPSTREAM DOMAIN OUT LINK - CASE STUDY 1, TEST SCENARIO 3. ... 112
TABLE 6-26,AVERAGE PERCENTAGE UTILIZATION FOR THE SERVICE CLASSES AT THE LINK THAT CONNECTS THE UPSTREAM (DOMAIN 1) AND DOWNSTREAM DIFFSERV DOMAINS -TEST SCENARIO 3, CASE STUDY 2. ... 115
TABLE 6-27,AVERAGE PERCENTAGE UTILIZATION FOR THE SERVICE CLASSES AT THE LINKS THAT CONNECT THE UPSTREAM AND DOWNSTREAM DIFFSERV DOMAINS -TEST SCENARIO 3, CASE STUDY 2. ... 115
X
TABLE 6-29,AVERAGE END-TO-END DELAY WHEN MANGING THE UPSTREAM DOMAIN (DOMAIN 1) ONLY, TEST SCENARIO 3- CASE STUDY 2. ... 116
TABLE 6-30,AVERAGE PERCENTAGE UTILIZATION FOR THE SERVICE CLASSES AT THE LINK THAT CONNECTS THE UPSTREAM (DOMAIN 1) AND DOWNSTREAM DIFFSERV DOMAINS -TEST SCENARIO 3, CASE STUDY 3. ... 118 TABLE 6-31,AVERAGE PERCENTAGE UTILIZATION FOR THE SERVICE CLASSES AT THE LINKS THAT CONNECT THE
UPSTREAM AND DOWNSTREAM DIFFSERV DOMAINS -TEST SCENARIO 3, CASE STUDY 3. ... 119
TABLE 6-32,AVERAGE PERCENTAGE UTILIZATION FOR THE SERVICE CLASSES AT THE DESTINATION LINK WHEN MANGING THE UPSTREAM DOMAIN (DOMAIN 1) ONLY -TEST SCENARIO 3, CASE STUDY 3. ... 119 TABLE 6-33,AVERAGE END-TO-END DELAY WHEN MANGING THE UPSTREAM DOMAIN (DOMAIN 1) ONLY, TEST
SCENARIO 3- CASE STUDY 3. ... 120
TABLE 9-1,EXPLANATION OF RESEARCH PROBLEM - SERVICE CLASSES CONFIGURATION PARAMETERS. ... 133
TABLE 9-2,CONFIGURATION PARAMETERS OF THE RESEARCH PROBLEM EXPERIMENT. ... 134 TABLE 9-3,NS3 CLASS REFERENCES WHICH ARE USED TO BUILD THE RDWQUEUE MODEL AND THEIR PURPOSES.
XI
Abbreviations
AbbreviationsA-CPI Application-Controller Plane Interface
AF Assured Forwarding
APIs Application Program Interfaces
BE Best Effort
BPR Backlog Proportional Rate
BW Bandwidth
C-DPI Controller-Data Plane Interfaces
CAPEX Capital Expenditure
CBQ Class Based Queuing
CPU Control Processing Unit
DBWS Dynamic Benefit Weight Scheduling
DDP Delay Differentiated Parameters
DiffServ Differentiated Services
DRAM-NFV Dynamic Resource Allocation Management -Network Function
Virtualization
DSCP Differentiated Service Code Point
DWFQ Dynamic Weighted Fair Queuing
EF Expedited Forwarding
ETSI European Telecommunications Standards Institute.
FIFO First Input First Out
FTP File Transfer Protocol
GCD Greatest Common Divisor
GPS Generalized Process Sharing
H-PFQ Hierarchical Packet Fair Queuing
HaaS Hardware as a Service
HPD Hybrid Proportional Delay
I-CPI Intermediate-Controller Plane Interface
IaaS Infrastructure as a Service
IETF Internet Engineering Task Force
IP Internet Protocol
MPLS Multi-Protocol Label Switch
NaaS Network as a Service
NFs Network Functions
NFV Network Function Virtualisation
NOS Network Operating System
NS2 Network Simulator - version 2
NS3 Network Simulator – version 3
OPEX Operating Expenses
PaaS Platform as a Service
PAD Proportional Average Delay
PDD Proportional Delay Differentiation
PHB Per-Hop Behaviour
PQCM Proportional Queue Control Mechanism
QoS Quality of Service
XII
RED Random Early Detection
RIO Random Early Detection with In/Out bit
SaaS Software as a Service
SC Service Class
SDN Software Defined Network
TCP Transmission Control Protocol
UDP Unit Datagram Protocol
VLAN Virtual Local Area Network
VMs Virtual Machines
VoIP Voice over Internet Protocol
WFQ Weighted Fair Queuing
WRED Weighted Random Early Discarding
1
Chapter One
Introduction
1 Chapter One: Introduction
1.1
Introduction:
Quality of Service (QoS) is the ability of a network to provide different types of services to various identified network traffics over different underlying technologies. Bandwidth, delay, delay variation (jitter) and packet loss rate are the parameters used to measure and specify QoS (Shaikh et al. 2002). The maximum bit rate that can be sustained between two end points of a network is defined as the bandwidth of the network link. Delay is the elapsed time incurred when a packet is passed from a sender through a network domain to its destination (end-to-end delay). Jitter is the variation in end-to-end, transient delays. Finally, the packet loss rate is defined as the ratio of dropped packets to the total number of packets (Kurose & Ross 2013). The importance of Quality of Service (QoS) technologies has increased rapidly with the rapid development of multimedia applications over the Internet – such as distance learning, Video traffic, voice over Internet protocols, and so on. DiffServ is a QoS model, (Giordano et al. 2003). This model has been proposed and standardized to address the QoS requirements of real time applications (Blake et al. 1998). DiffServ provides differentiation services for aggregates of network traffic at routing decision points (Kusmierek et al. 2002).
Packet scheduling is one of the functions performed by a router and it is an important process carried out by DiffServ networks in order to allocate resources to service classes (Tanenbaum & Wetherall 2011). NFV and SDN are cutting-edge technologies in networking which co-operate in order to deploy network functions with less hardware dependence and as a software deployed on a virtualised infrastructure (Cloud) (Chiosi et al. 2012). The SDN and NFV technologies bring specific benefits with regards to efficient resource usage and faster operations management.
1.2
Differentiated Services:
2
Differentiated Services are beneficial in packet networks (Dovrolis 2000) because not all applications have the same QoS requirements. For example, viable Video traffic sessions necessitate lower delays and fewer losses than file transfers via FTP. With differentiation services, more demanding applications (or users) are provided with better performance than others.
The Internet Engineering Task Force (IETF) had the DiffServ architecture developed in the late nineties (Blake et al. 1998) (Nichols et al. 1998). The concept of DiffServ is that individual flows (microflows) with similar QoS requirements can be aggregated into larger traffic sets called (macroflows) or service classes. DiffServ uses a manageable, scalable and easily deployable architecture for differentiation services across IP networks. The network bandwidths in DiffServ are allocated to macroflows rather than to individual flows. All the packets in a macroflow experience the same forwarding behaviour in the routers. Each macroflow uses a specific service class queue or per-hop behaviour (PHB).
DiffServ can be provided by a set of routers forming an administrative domain called a DiffServ domain. The administrator defines a set of service classes each with corresponding forwarding rules. The classes may differ in terms of their requirements for delay, jitter, and the probability of packets being discarded in the event of congestion (Tanenbaum & Wetherall 2011). Different administrative DiffServ domains are interconnected to constitute the Internet (Reichmeyer & Networks 1998). Each DiffServ domain has core routers which are connected together in order to forward packets. The administrative DiffServ domains and end users are interconnected to each other through edge routers which lie at the boundary of the DiffServ domains (Kurose & Ross 2013). Figure 1-1 shows a typical DiffServ architecture as used in the Internet.
3
When packets of a flow enter a DiffServ domain, they are assigned a code which specifies their forwarding priority (service class); this is achieved by means of a marker which is set by the edge router (Blake et al. 1998). This code is termed the packet’s Differentiated Service Code Pint (DSCP). The aggregation of flows is achieved at the edges of a DiffServ network. A flow classification system (Suter et al. 1999) (Srinivasan et al. 1999) is required at the network edges in order to aggregate microflows into macroflows.
The aggregation of microflows into macroflows makes the DiffServ network model scalable and manageable, and with an easily deployable architecture because a state is required only for a few service classes not for each individual flow. In addition, there is a queue for each class instead of a queue for each flow. Consequently, the per queue operations of classification, scheduling, buffer management and policing become noticeably simpler and faster.
The DiffServ architecture does not require a signalling protocol because there are no resource reservations for individual flows. The DiffServ architecture allows both absolute (quantitative) and relative (qualitative) service differentiation.
The absolute service differentiation aims to provide a macroflow with a quantitative performance level (minimum forwarding rate, or maximum loss rate) at certain links or network paths. Minimum Forwarding rate means the minimum number of packets that can be sent at certain link or network in one second while the maximum loss rate means the maximum percentage of packets lost with respect to packets sent to certain links or network. Such an absolute differentiation requires some form of admission control to prevent users from sending traffic at a higher rate than their network contract allows.
4
class queues and the configuration parameters of a DiffServ domain thus this will help us on managing resources between relative DiffServ domains through monitoring the traffic condition in one domain and modifying the configuration parameters of another DiffServ domain.
1.3
Research Problem:
A packet in the Internet travels from source to destination by passing through one or more DiffServ domains. The problem that we have in the current approach of a DiffServ domain is that it is a static, it means that each router or domain allocates its resources locally or separately based on its traffic condition and the domain configuration parameters. Once the domain administrator sets the configuration parameters of a domain, these parameters will not change. The traffic conditions within a DiffServ domain can be changed continuously and randomly therefore there will be a situation that the DiffServ domain favoring certain amount of traffic while other network traffic will be suffered although the priority levels that we have made for service classes in a DiffServ domain so it needs to adjust the parameters at one domain to rebalance the resources at another domain.
5
the increasing or congested traffic and makes the out links’ resources (queues buffer resources), allocated for other classes at the DiffServ routers in Domain 2 (downstream), not well utilized during the congestion period. So the research problem is to “How to manage resources between differentiated Services domains dynamically instead of managing resources statically for each domain in order to achieve better QoS for application traffic”. Appendix A-1 presents an experiment to illustrate the research problem.
Figure 1-2, Research problem.
1.4
SDN and NFV Technologies:
Software Defined Networks (SDN) and Network Function Virtualization (NFV) are considered cutting-edge technologies. SDN is considered a valuable, emerging networking model that ensures that the control layer of a network device is separated from its data layer (Kate Greene 2009). In addition, SDN controllers can connect with one another and with the data layer of SDN forwarding device via Application program Interfaces (APIs) (Kreutz et al. 2015). NFV has recently emerged and offers the implementation of network services as software executed on a virtualisation infrastructure (the Cloud). Consequently, it reduces hardware dependency (Chiosi et al. 2012). This method of implementation leads to efficient resource usage and faster operations management with lower costs because the NFV provides the infrastructure in which the application programs of the SDN controller are executed. Moreover, it (NFV) participates in the deployment of the controller’s applications across multiple networks.
6
operation (traffic condition) within a DiffServ domain can be changed continuously and randomly and therefore there will be a situation that the network favouring certain amount of network traffic. As a consequence, other network traffic will be suffered.
Instead of having a static DiffServ, we can monitor traffic condition in another domain and make changes on managing resources of other domain so we have now calibrating between DiffServ domains in managing resources. This calibration can be done by:
1. Using SDN switches, OpenFlow, for example that we can programmed them automatically and remotely. As a result of using SDN networks, we can monitor and manage the queues and congestion levels in DiffServ domains.
2. Using the concept of NFV in order to extract and implement virtually a certain function in DiffServ which is resource management function. As a result of using NFV, the management process will be deployed and do not become locally. It is still locally if the traffic condition within a DiffServ domain is normal but it becomes across DiffServ when there is unbalanced in traffic condition or congestion within a DiffServ domain.
1.5
Research Motivation:
This SDN and NFV techniques have not been used, as yet, for the implementation of the management of resources across DiffServ networks. Making use of the opportunities presented by NFV and SDN, the management process could take place outside the DiffServ domain itself. It could take place in a virtualized infrastructure while NFV monitors the traffic situation of the downstream domain (the domain that the packets will travel to) and provides the allocating resource scheme to the upstream domain.
The motivation for this current work is to make effective use of the benefits offered by NFV and SDN and to study how these techniques may be used to manage resources within the edge routers of DiffServ domains and among different DiffServ domains. Within the edge routers, the resources are allocated depending on the traffic state in each service class queue and according to the differentiation patterns within the DiffServ domain. Also, the management of resources among DiffServ domains includes the monitoring of the congestion level for each service class queue at the downstream domain. When the service class congestion level exceeds the congestion threshold parameters of a service class queue, the scheduling rate for the equivalent or mapped service class queue at the egress router of the upstream domain is reduced by an optimum value. In this present study, a new scheduling algorithm is proposed, termed
7
(DRAM-NFV). This algorithm has been designed to manage the resources within and across
DiffServ domains. The DRAM-NFV algorithm is based on the Dynamic Weighted Fair Queuing DWFQ algorithm which, as currently implemented/used, is not able to manage the resources across different DiffServ domains. The recently established technologies of the Cloud and Software Defined Networks (SDNs) participate in the deployment of the resources management process ‘virtually’ across DiffServ domains and within the edge routers of DiffServ domains, using the concept of Network Function Virtualization (NFV).
1.6
Research Aims and Objectives:
The aim of this project is to make use of the NFV and SDN technologies in order to manage resource allocation within and among DiffServ domains so that better resource management for service class queues and greater fairness in the distribution of surplus bandwidth during the events of congestion within the DiffServ domains are achieved.
The key objectives of this research are as follows:
1. Explore a Dynamic Resource Allocation Management – Network Function Virtualization DRAM-NFV algorithm which is intended to manage the resources within and among DiffServ domains, making use of the NFV and SDN concepts.
2. Build a mathematical model that represents the DARM-NFV algorithm.
3. Implement a prototype of the DRAM-NFV algorithm and use a simulation environment to run a number of test scenarios for the validation and evaluation the DRAM-NFV algorithm.
4. Identify conditions which enable the DRAM-NFV algorithm to manage resources across DiffServ domains.
1.7
Research Questions:
Throughout the course of this research, the following questions have been addressed: 1. How can the resources across different DiffServ domains be managed?
8
1.8
Research Methodology:
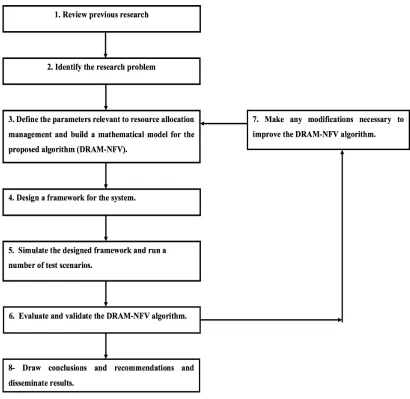
The approach (as shown in Figure 1-3) adopted in this research can be itemised as follows: 1. Review previous research:
Previous relevant works have been reviewed in order to gain a good understanding of the research field and to investigate issues related to DiffServ networks, the Cloud, SDN and NFV. The various DiffServ models and the methods of allocating resources used by the proportional delay relative differentiated service model are presented in this thesis. This review of previous work also includes an identification of the most appropriate infrastructure for implementing the NFV which is the Network as a Service (NaaS) Cloud model. In addition, many areas of research that have emerged recently in the telecommunication and computer networks field which use the cutting-edge techniques of SDN and NFV are examined.
2. Identify the research problem:
The research proper starts by identifying the drawbacks associated with DiffServ networks. The current proportional DiffServ model allocates resources purely depending on the traffic conditions prevalent at each edge DiffServ router and so does not enable the management of resources across different DiffServ domains. Thus, when a packet crosses the boundary between two domains, the forwarding probability of the packet may be changed, inappropriately, because there are not enough available resources, at the next domain, for the service class that the packet belong to.
In identifying the research problem, it was necessary to consider the foundation on which a new resource allocation algorithm, called the DRAM-NFV algorithm, should be developed. Such an algorithm, clearly, must be capable of dealing with the issues identified and improving the performance of a proportional delay DiffServ by managing resources within a DiffServ router and also across different DiffServ domains in the event of congestion.
3. Define the parameters relevant to resource allocation management:
The parameters of the DRAM-NFV algorithm must be defined so that they construct a mathematical model for the algorithm. This mathematical model has to express the behavior of the proportional delay DiffServ model when using the DRAM-NFV algorithm and was used to implement a prototype to test and evaluate the performance of the DRAM-NFV algorithm within the simulation environment ns3.
4. Design a framework for the system.
9
Cloud and SDN technologies participate in supporting the DRAM-NFV algorithm. The Network-as-a-Service NaaS Cloud which allows for the virtualization of computing and networking resources in a Cloud environment is considered as an infrastructure for the DRAM-NFV algorithm. SDN is different from traditional networking models in that the SDN controller is not bundled with the SDN forwarding device and so can be represented as a software setup on the NaaS Cloud model. Deploying and communicating between instances of SDN controllers on the Cloud enables consolidated management of the DiffServ domain routers, increases network efficiency, reduces the cost of equipment, and reduces energy consumption. 5. Simulate the designed framework and run a number of test scenarios.
To achieve the research aim, test scenarios must be implemented and presented within a simulation environment in order to test the performance of the DRAM-NFV algorithm. The scenarios must take into consideration different topologies of DiffServ domains and enable the study of the performance of the DRAM-NFV algorithm when at least some of the DiffServ domains cannot manage their own resources appropriately via the NFV technology.
6. Evaluate and validate the DRAM-NFV algorithm.
The results of implementing the test scenarios via the network simulator, ns3, must be studied to evaluate the performance of the NFV algorithm. The performance of the DRAM-NFV algorithm is to be compared with the performance of the DWFQ algorithm under the same simulation conditions. The DWFQ algorithm cannot manage resources across DiffServ domains – it allocates the resources dynamically and separately within each DiffServ router. 7. Make any modifications necessary to improve the DRAM-NFV algorithm.
If modifications are necessary to improve the performance of the DRAM-NFV algorithm, then this step allows for such modifications (to the algorithm and to its implementation) to take place according to the evaluation of the results which are produced by the experiments carried out in step 6.
8- Draw conclusions and recommendations and disseminate results.
10
Figure 1-3, Research methodology.
1.9
Thesis Outlines:
The remainder of this thesis is arranged as follows:
Ø Chapter 2 outlines the proportional delay DiffServ and recent development on networking QoS.
Ø Chapter 3 consists of the literature review. This places emphasis on resources allocation in proportional delay DiffServ implementations and on recent applications of the SDN and NFV technologies; it also presents the contribution of the present research.
Ø Chapter 4 explains the DRAM-NFV algorithm principle and mathematical model.
Ø Chapter 5 describes the prototype of the DRAM-NFV algorithm which was implemented within a simulation environment (Network Simulator - NS3).
Ø The results, and the validation and evaluation of the DRAM-NFV algorithm are addressed in Chapter 6.
11
Chapter Two
Background on Proportional Delay DiffServ and Recent
Development in Quality of Service
2 Chapter Two: Proportional Delay DiffServ and Recent Development in Quality of Service
2.1
Introduction:
This chapter provides an overview of the Proportional Delay DiffServ (PDD) technology and other recent technologies which have become prevalent and can be used to achieve Quality of Service (QoS), viz: Network Virtualisation, Software Defined Networks (SDNs), and Network Function Virtualisation (NFV).
The DiffServ architecture allows both absolute (quantitative) and relative (qualitative) service differentiation. The absolute service differentiation aims to provide a service class with a quantitative performance level (minimum forwarding rate, or maximum loss rate) at certain links or network paths. On the other hand, the relative differentiation service provides a number of classes with preferential performance. The higher classes will provide better QoS to flows than the lower classes will (Dovrolis & Ramanathan 1999) – in terms of both queuing delays and packet losses. However, the exact QoS for each class is not specified and depends on the traffic conditions and the DiffServ mechanisms that the network deploys.
12
differentiation model. Here, the higher priority classes are serviced first before lower classes. This service scheme provides a consistent differentiation between classes that does not depend on load variations (i.e. higher classes are always better). However, if the higher classes are persistently backlogged, this situation can result in long ‘starvation’ periods for the lower classes if no restriction is placed on the load of the higher classes. In addition, a strict prioritization scheme does not achieve a controllable differentiation between service classes because such a scheme does not allow the network operator to adjust the relative QoS between classes. Finally, proportional delay differentiation is another type of relative differentiation model and this model will be discussed in the next section.
Throughout the successive sections of this chapter, the standard DiffServ classes and queue management techniques will be illustrated. In addition: we will explain how the Cloud and the SDN technologies participate in supporting the NFV technology.
2.2
Proportional Delay DiffServ (PDD) Model:
In general, the Proportional Differentiated model is a relative differentiation model which provides a controllable and predictable differentiation scheme (Dovrolis & Ramanathan 1999). Controllability means that the quality spacing between classes can be adjusted by the network operator based on policy criteria. Predictability means that the differentiation scheme among classes is consistent (i.e. higher classes are always better or at least no worse than lower classes). These properties must be maintained even across short timescales and independent of the variation in class loads.
The proportional differentiation model states that “certain class performance metrics (queuing delay or packet losses) should be proportional to the differentiation parameters the network operator chooses” (Dovrolis 2000). In detail, the scheme can be described as follows. Suppose that #$ %, % + ( is a performance measure for class (i) in time interval %, % + ( , where (>0; it represents the monitoring timescale (the value of ( should be relatively small to achieve differentiation over a short timescale). The model imposes constraints as illustrated in Equation 2-1 for all pairs of classes and for all time intervals %, % + ( in which #$ %, % + (
and #) %, % + ( are defined.
#$ %, % + ( #) %, % + ( =
+$ +)
Equation 2-1
13
Although the actual quality level of each class in the proportional differentiation model will vary with class loads, the quality ratio between classes will remain in place and controllable by the network operator, independent of class loads.
The proportional differentiation model can be applied in the context of queuing delays
(Dovrolis 2000) by setting #$ %, % + ( = / ,
01,123 in Equation 2-1, where 4$ %, % + ( is the
average queuing delay of the class (i) packets that depart in the time interval %, % + ( . If there are no packets, %, % + ( is not defined.
The proportional delay differentiation model states that “for all pairs of classes and for all time intervals %, % + ( in which both 4$ %, % + ( and 4) %, % + ( are defined, then:
4$ %, % + ( 4) %, % + ( =
5$ 5)
Equation 2-2
where the parameters δ in Equation 2-2 are the Delay Differentiation Parameters (DDP), ordered as δ, > δ- > ⋯ > δC, that are configured by the domain administrator. The proportional delay differentiation model is used as the differentiation model for this research.
2.2.1 Standard Differentiated Service Classes:
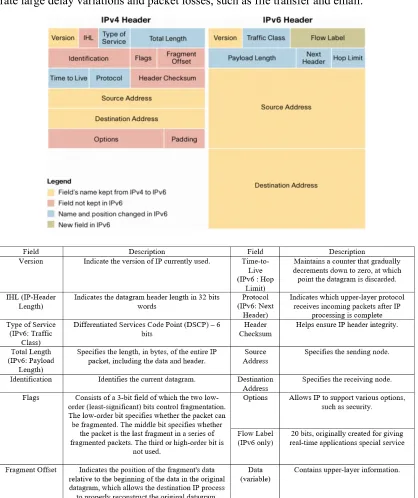
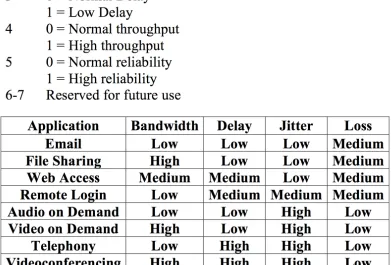
The DiffServ service class is specified in each IP packet via a short label (eight bits) in IPv4 or IPv6 headers (it is called as Type of Service in IPv4 and as Traffic Class in IPv6). Figure 2-1 shows the IPv4 and IPv6 headers fields (Cisco Systems 2006). This mentioned label is also called the (DSCP). In fact, just six bits of the DiffServ field constitute the (DSCP) (Nichols et al. 1998). This value identifies a processing action to be performed by routers on the incoming packet called a per hop behaviour (PHB) (Blake et al. 1998) (Carpenter & Faucheur 2000). Figure 2-2 and Figure 2-3 show the DiffServ field in an IP header and a DSCP allocation table (WANG 2001) respectively.
The (IETF) identified three types of differentiated forwarding service:
- Expedited Forwarding (EF) (Nichols et al. 1999) provides minimal delay, jitter and packet loss and guarantees the required bandwidth. The (EF) service is suitable for delay-sensitive applications such as voice and video. The expedited packet queue is given priority over the regular one via the use of a priority scheduler. Expedited packets see a network as unloaded, even when there is, in fact, a heavy load of regular traffic (Tanenbaum & Wetherall 2011).
14
high-drop-precedence packets are more likely to be dropped than low-drop-precedence packets. These two factors (the traffic classes and the drop precedences) together define 12 service classes. The implementation of an Assured Forwarding service requires an active queue management algorithm capable of solving possible long-term congestion problems.
[image:27.595.103.521.230.728.2]- Best-Effort (BE) forwarding represents the simplest type of service that a network can offer; it does not provide any form of resource assurance to traffic flows (WANG 2001). The network treats all packets equally. When a link is congested, packets are simply pushed out as the queue overflows. A best effort (BE) service is appropriate for some applications that can tolerate large delay variations and packet losses, such as file transfer and email.
15
16
Figure 2-3, DSCP allocation table.
2.2.2 Queue Management Techniques for Differentiated Services:
17
The Weighted Random Early Detection algorithm (WRED) is the same as the RED algorithm, but with multiple drop profiles. In WRED, rather than using a single drop profile for all queues, different drop profiles may be defined for individual queues. In addition, multiple drop profiles may be defined within a single queue (Kun I. Park 2005). WRED is the algorithm used in this research.
2.3
Network Virtualisation, SDN and NFV:
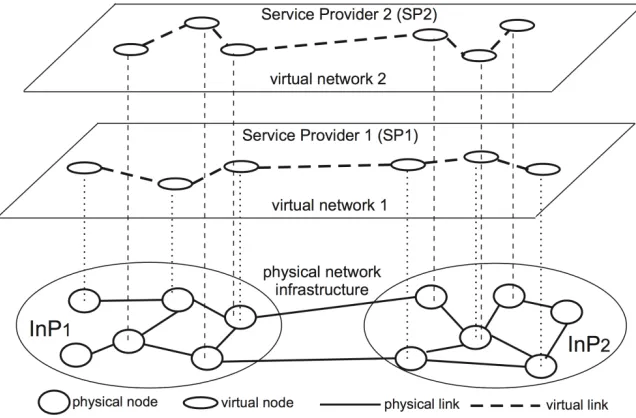
[image:30.595.152.470.421.630.2]Network virtualization in the Internet can be described as a networking technology that creates dedicated Virtual Networks (VNs) over a physical infrastructure (Han et al. 2016). It can also be described as a networking environment which allows one or multiple service providers to form heterogeneous virtual networks that co-exit together but in isolation from each other and to deploy customized end-to-end services on those virtual networks by effectively sharing and utilizing the underlying network resources furnished by the infrastructure providers (Chowdhury & Boutaba 2009). The underlying network resources (the physical network infrastructure) consist of physical links and nodes that are virtualized and made available to virtual networks. Figure 2-4 illustrates a network virtualization environment (Duan et al. 2012). With network virtualization, network services provisioning is decoupled from the data transportation mechanisms.
Figure 2-4, Illustration of a network virtualization environment.
18
abstracted, virtualized, dynamically scalable computing functions and services are delivered on demand to external customers over the Internet (Foster et al. 2008).
There are four main classifications of Cloud services (Dong Xu 2010).
i. Software-as-a-Service (SaaS) is a Cloud based service model whereby applications reside on the Cloud and are offered to end-users. The application’s services can be provided as utilities to its customers.
ii. Platform-as-a-Service (PaaS) is a Cloud based service model used by Cloud computing developers to implement and deploy their applications onto the cloud. iii. Infrastructure-as-a-Service (IaaS) or Hardware as a service (HaaS) is a Cloud based
service model. It provides computing resources in terms of virtual hardware (storage and processing) (Buyya et al. 2013) (Hill et al. 2013) (Ashon & Ilyas 2011). The virtual hardware services can be provided as utilities to its customers.
iv. Network as a Service (NaaS): is a Cloud based service model that offers network connectivity services virtually over the Internet. The network connectivity services can be provided as utilities to its customers (M.P.V. Manthena 2015).
19
Figure 2-5, NaaS based framework for network cloud convergence.
SDN is a networking model that achieves network virtualisation. It offers an opportunity to loosen the limitations inherent in conventional network infrastructures in which the network operators need to configure each individual network device separately in order to implement the desired network policies because the control plane and the data plane are bundled inside the networking devices (Theophilus Benson 2009). SDN was originally defined by a research team at Stanford University (Kate Greene 2009) (McKeown et al. 2008) as “a network architecture where the forwarding state in the data plane is managed by a remote-control plane decoupled from the data plane”. In an SDN context, the forwarding decisions are flow based, rather than destination based. The flow abstraction allows for the unification of the behaviours of different types of network devices, including routers, switches, firewalls and so on (Jamjoom et al. 2014). As a result of this new infrastructure, network switches and routers become simple forwarding devices and the control logic is implemented in a logically centralized controller. Thus, the processes of policy enforcement and network (re)configuration and evolution become much simpler (Kim & Feamster 2013) and a network environment can become capable of dynamically dealing with faults and load changes (Raghavan et al. 2012) (Kim & Feamster 2013).
20
technology. It takes requests from the Management plane (Management Application) via a well-defined (API) and accomplishes consolidated management and monitoring of forwarding devices in data plane via another well-defined (API).
There are two control models which can be used in an SDN (Rao 2014) (Kreutz et al. 2015). These are the centralized controller model, whereby a single entity manages all SDN forwarding devices; and the distributed controller model, which controls a cluster of nodes and the distributed controllers are connected to each other using also a well-defined (APIs) to import/export data. The distributed controller model is more scalable and dependable than the centralized model.
The Management plane in SDN is an array of network services applications run separately and directly on the controller within each SDN domain (McKeown et al. 2008).
The Network Functions or Services (NF) can be divided into control plane functionalities and data plane functionalities. Control plane functionalities are responsible for controlling the network operations: e.g., resources management and controlling network access. Data plane functionalities are responsible for forwarding the traffic (Soares et al. 2014).
The European Telecommunications Standards Institute (ETSI) initiated a new technology called NFV. It exploits the virtualization technique in order to separate network functions from the underlying hardware equipment’s, through software applications running on high-volume servers (Cloud). Virtualized network functions can be instantiated in various locations, datacentres or network nodes (Chiosi et al. 2012) (ETSI). NFV reduces network Capital Expenditure (CAPEX), Operating Expenses (OPEX) and complexity by reducing equipment costs and power consumption.
NFV can be considered a complementary technology to SDN and can be combined with it to achieve greater efficiency (Hawilo et al. 2014) (Chen et al. 2015) (Rao 2014) (Han et al. 2015). High volume servers (Cloud) hold multiple (VMs) on which multiple Network Functions (NFs) run. A virtual machine is a software application which can be used to provide the physical computing and networking resources of a Cloud as virtual resources to the SDN network operating system (controller) which is set up on a virtual machine.Each VM represents an SDN controller and these controllers communicate with one another. Consequently, the virtualized network functions can be deployed with less hardware as the virtual machines can be deployed across the system resulting in an increase in system efficiency and flexibility.
21
Secondly, NFV provides the infrastructure on which the SDN controller applications run and also provides connections among the virtualized network functions through the connection of the SDN controllers.
The selection of which NFs to virtualize depends on: (A) from a technical perspective, whether the selected NF can actually be virtualized or not (e.g., the issues might be the availability of hardware and performance limitations); and (B) from an economic and operational perspective, will the effort of virtualizing the NF bring real value? (Soares et al. 2014).
2.4
Chapter Summary:
The Proportional Delay DiffServ (PDD) model is a relative differentiation service model. It provides a number of service classes with preferential performance such that the higher classes receive a better QoS in terms of both queuing delays and packet losses. The exact QoS for each service class in this model is not specified but depends on the traffic conditions in the DiffServ router (the per hop behaviour).
Network Function Virtualisation (NFV) aims to implement network services or functions via software elements executed on a virtualisation infrastructure. The Network-as-a-Service (NaaS) Cloud based service model constitutes the infrastructure for an NFV. It provides the physical computing and networking resources of a Cloud environment as virtualised services to the network function that requires to be virtualised.
The Software Defined Network (SDN) model is a networking model that provides support for network virtualisation. In SDN, the control layer (Controller) of a forwarding device is separated from the data layer. SDN makes the data layer of physical network devices (forwarding devices) programmable remotely and accomplishes the consolidated management and monitoring of forwarding devices in relation to the requests that are received from the management application of a network function (the Management layer).
22
23
Chapter Three
Literature Review Relating to Proportional Delay DiffServ
Resource Management and the Recent Uses of SDN and
NFV
3 Chapter Three: Literature Review Relating to Proportional Delay DiffServ Resource Management and the Recent Uses of SDN and NFV
3.1
Introduction:
This chapter focuses on the packet scheduling algorithms that can be used to implement the Proportional Delay Differentiated PDD model. The PDD model is achieved by providing a lower delay for the highest priority service class as compared to other classes in long and short timescales, and also by approximating the ratios of average service class delays to the ratios specified by their corresponding differentiated delay parameters. Within the scope of the PDD model, resources can be allocated in a number of ways. They can be allocated based on the normalized average class delay, on the normalized packet delay at the head of the service class queue as in Proportional Average Delay PAD, Waiting Time Priority WTP and Hybrid Proportional Delay HPD scheduling algorithms - or they can be allocated by providing each class with a minimum bandwidth share of the router out-link’s capacity, as in Link Sharing Scheduling algorithms and Backlogged Proportional Rate scheduling algorithms.
Some recent contributions related to the NFV and SDN technologies are also presented in this chapter. In addition, the contribution of this present study is presented in this chapter. This latter contribution centres on the use of NFV and SDN technologies to improve the performance of the Dynamic Weighted Fair Queuing (DWFQ) algorithm in allocating resources within and across different DiffServ domains. The reasons for selecting the DWFQ algorithm as opposed to other scheduling algorithms are explained in the last section of this chapter.
3.2
Resources Allocation in Proportional Delay DiffServ domains:
24
than the performance of lower classes independent of the aggregate load, the class load distribution, and the timescales in which the performance is measured.
dE dF =
δE δF
Equation 3-1
Proportional Average Delay (PAD) scheduling (Dovrolis et al. 2002) maintains the average delay 4$ % for each service class i, normalized by the corresponding DDP (δE), as illustrated in Equation 3-2. A packet is chosen for forwarding at time t from the backlogged class with the maximum normalized average delay.
4$ % = 4$(%)
δE
Equation 3-2
This algorithm aims to equalize the normalized average delays among all classes in long term timescales through reducing the differences among their normalized average delays. (Dovrolis et al. 2002) considered the PAD algorithm to be an excellent scheduler in terms of meeting the constraints of the PDD model when certain conditions are met with regard to selecting the DDPs. (Dovrolis et al. 2002) also examined the behaviour of the PAD scheduling algorithm by comparing the ratios of short term average delays between classes and the ratios of DDPs between classes. He found that this scheduling algorithm does not take into account the waiting times of the backlogged packets, and it occasionally allows higher classes to experience much larger queuing delays than their long-term average and the queuing delays of lower classes. Thus, the PAD algorithm does not achieve the predictability criterion required by the PDD model.
Waiting Time Priority (WTP) scheduling was another scheduling algorithm which was examined by (Dovrolis et al. 2002). In WTP scheduling, a packet is assigned a priority that increases proportionally to the packet’s waiting time. The higher classes in the WTP algorithm have larger priority increase factors and the packet with the highest priority is serviced first in non-pre-emptive order. WTP maintains the waiting time I$(%) of the packet at the head of each service class i, normalized by the corresponding DDP (δE) as illustrated in Equation 3-3.
I$ % = I$(%)
δE
25
Whereas the PAD scheduler chooses for service the class with the maximum normalized average delay, WTP chooses for service the class with the maximum normalized head waiting time: i.e., a packet is sent from that backlogged class with the maximum normalised head waiting time. In this manner, WTP attempts also to minimize the differences between the normalized waiting times of the successively departing packets. (Dovrolis et al. 2002) demonstrated the behaviour of the WTP scheduler. That study found that WTP achieves a proportional delay differentiation between successive packet departures, especially when the delays are sufficiently large. Also, (Dovrolis et al. 2002) tested the performance of WTP in short timescales. It was found that the WTP is an excellent scheduler in terms of providing higher classes with lower delays in short timescales and thus, this scheme provides a predictable delay differentiation. Moreover, it also approximates to the PDD model in heavy load conditions as the utilization tends to 100% and the aggregate backlog of classes increases. For lower load conditions, (Dovrolis et al. 2002) found that the WTP algorithm deviates, technically, from the PDD model.
Hybrid Proportional Delay (HPD) scheduling is another scheduling algorithm which was presented by (Dovrolis et al. 2002). This scheduling algorithm combines the methods of the PAD and WTP algorithms in order to create a scheduler that is approximate to the PDD model, when certain conditions are met in relation to selecting DDPs, and that provides a predictable delay differentiation in short timescales. HPD maintains a delay metric for each service class
i, normalized by the corresponding DDP (δE). The delay metric for each class includes the
normalized average delay 4$ % for a service class I and the normalized head waiting time,
I$ % , for a service class I, as illustrated in Equation 3-4,
ℎ$ % = K4$ % + (1 − K)I$ %
Equation 3-4
where:
ℎ$ % is the normalized hybrid delay for a service class i.
4$ % is the normalized average delay for a service class i.
I$ % is the normalized waiting time of the packet at the head of service class i. g is known as the HPD parameter 0 ≤ K ≤ 1.
26
In contrast to PAD and WTP schedulers, HPD choose for service the class with the maximum normalized hybrid delay: i.e., a packet will be sent from that backlogged class which has the maximum normalised hybrid delay. (Dovrolis et al. 2002)tested the performance of the HPD algorithm and concluded the following.
i. In heavy load conditions, about 90% utilization, all three algorithms, PAD, WTP, and HPD, meet the PDD model criteria: i.e., they keep within the constraints on ratios specified by the PDD model.
ii. In lower load conditions, HPD is closer to the PDD model than WTP but it does not reach the optimal behaviour which is exhibited by PAD.
iii. HPD closely approximates the PDD model independent of class load distribution. The approximate error increases as the utilization decreases and as the delay differentiation between classes becomes more extreme.
iv. HPD does not have the predictability problem that PAD has. This means that the HPD algorithm manages to provide lower delays to higher classes in both short and long term timescales.
Link sharing scheduling algorithms aim to provide each class with a minimum bandwidth share of the link’s capacity. Examples of such schedulers include the Generalized Processor Sharing (GPS) scheduler (Heinanen et al. 1999) (Demers et al. 1989) and its approximations such as Class Based Queuing (CBQ) (Floyd & Jacobson 1995), Weighted Fair Queuing (WFQ) (Demers et al. 1989) and Hierarchical Packet Fair Queuing (H-PFQ) (Bennett & Zhang 1997). GPS defines a packet based scheduler that provides a minimum service rate P$(%) to each backlogged class I at time t, as illustrated in Equation 3-5. Such a scheduler (and the equation) takes into account class weights {I), Q = 1 … . . T}, where N represents the number of service
classes.
P$ % = U I$ I)
)∈W(1)
Equation 3-5
where:
C is the link bandwidth (capacity), and
X(%) is the set of backlogged classes at time t.