International Journal of the Physical Sciences Vol. 6(24), pp. 5688-5698, 16 October, 2011 Available online at http://www.academicjournals.org/IJPS
DOI: 10.5897/IJPS11.971
ISSN 1992 - 1950 ©2011 Academic Journals
Full Length Research Paper
Detection of damage location using mode shape
deviation: Numerical study
Moatasem M. Fayyadh* and H. Abdul Razak
Department of Civil Engineering, Faculty of Engineering, University of Malaya, 50603 Kuala Lumpur, Malaysia.
Accepted 2 September, 2011
This study presents the use of mode shapes for the identification of damage location. The residual values from curve fitting procedure on mode shape vectors with Chebyshev standard rational series were used to detect the damage along the beam length. The results showed that all the mode shapes for the damaged cases deviated from that of the undamaged case, where the deviation was towards the damage location. The results also showed that the residual from curve fitting procedure for all mode shapes have higher values around the damaged element along the beam length which made it a good indicator for damage location.
Key words: Damage location, mode shape deviation, curve fitting residual, reinforced concrete (RC) beam model.
INTRODUCTION
Health monitoring of existing structures take a lot of interest, especially in past years. The interest in the ability to detect the damage at the earliest possible stages, increase as a necessity parallel with the increase of structural failure cases in past years. On the other hand the increase of natural disasters, such as earthquakes and Tsunami waves show more necessity to detect the damage at early stage as soon as possible to prevent the worse scenario. Cracks, one of the main causes of damage, is less important for the case of small loads or static excitation, but on the other hand, also the small cracks take the more important and more effect on the health of structure in the case of large loads and the dynamic excitation. Sometimes, these small cracks with insignificant effect for normal cases cause the failure of important structures like bridge or tall building in the case of dynamic excitation. From here, we discern the important need for detection of the damage at earlier stage. Magnitude and localization of damage are important damage detection procedure. The relationship between physical parameters of the structural element and the dynamic characteristics of these elements give the ability to detect the damage using the change in
*Corresponding author. E-mail: [email protected]. Tel: +60142224029.
sensitivity analysis. Alampalli (2000) presents the effect of damage on mode shape and other modal parameters. This study shows the difficult to locate the damage using mode shape. Maeck (2003) developed a technique to detect, locate and quantify damage in RC structure by vibration monitoring. Direct stiffness calculation was developed as a new technique to assess damage in reinforced concrete (RC) structures and estimate the bending and torsional stiffness along the structure from experimental natural frequencies, mode shapes and its derivatives. Beams were gradually damaged and the changes of the dynamic parameter were monitored from the initial to the failure state. Modal parameters turned out as good indicators. Dutta and Talukdar (2004), use mode shape and its curvature to detect and locate the damage, it shows that the curvature of mode shape is more sensitive than the mode shape to locate the damage.
Abdul Razak and Choi (2002) carried out an experimental investigation to study the effect of corrosion on the modal parameters of RC beams. The trend in the measured natural frequencies was sensitive to the deterioration state of beams. Different criteria based on frequencies or mode shapes were applied to detect damage in RC beams for which a few natural frequencies and mode shapes were obtained by experimental modal analysis. Similarly, local modal stiffness was proposed as a new damage detection method (Ricardo et al., 2008). Catbas et al. (2008) investigated the potential of two damage-sensitive features to detect damage by simulating different damage scenarios. The two features adopted in the study were modal flexibility-based deflection and curvature, both obtained from dynamic parameters. The experimental results showed that both deflection and curvature showed high sensitivity for damage detection and localization. Wang and Qiao (2008) proposed a new damage detection technique based on the irregularity profile of structural mode shape. The results led to the conclusion that the proposed technique required low measurement resolution and that the successful detection of damage on the composite beam proved that the proposed technique was capable of assessing both the location and the size of the crack. Todorovska and Trifunac (2008) explored the change in wave times as a structural health monitoring method, using strong motion data from the Imperial valley earthquake of 1979.
Deraemaeker et al. (2008), investigated problems related to damage detection using output only vibration measurement systems under changing environmental conditions. Montalvão et al. (2009) proposed a damage localization feature called modal damping factor. The study explored a method to reduce the amount of con-ventional sensors with the aim of locating damage for low cost on components that are subject to impact during service. Katsikeros and Labeas (2009) proposed an innovative health monitoring method based on structural
strain measurement; the measurements were then processed by a back-propagation, feed forward and artificial neural network. The proposed method, demonstrated on a cracked aircraft lap-joint structure to evaluate its capability and drawbacks in predicting fatigue damaged states, had good capability to predict accurately the crack position and the length of a lap-joint structure. Overbuy and Todd (2009) evaluated the effects of input and output noise on the estimation of transfer entropy. The study found that input noise lessens the sensitivity of the damage feature by diminishing the ability of the non-parametric density estimation to produce low variance transfer entropy estimation. The study also concluded that output noise had an effect on the feature’s sensitivity. Kim et al. (2010) offered a new proposal for a hybrid health monitoring system, using sequential vibration impedance approaches, to detect damage in pre-stress concrete bridge girders. Kopsaftopoulos and Fassois (2010) applied several vibration-based statistical time series as structural health monitoring methods on lightweight aluminium truss structures. An autoregressive model used the acceleration time histories obtained from two experimental structures (De Lautour and Omenzetter, 2010). The coefficients of the autoregressive model became the damage-sensitive features and acted as input into an artificial neural network. Rodríguez et al. (2010) proposed a method for detecting damage in structures without baseline state information. The study found that it is possible to identify the location and severity of damage based on singular value decom-position. Jassim et al. (2010) found that both modal parameters were affected by the crack regardless of position or size. Lower modes were found to be more sensitive to the change in the support conditions (Fayyadh and Abdul Razak, 2010; Fayyadh et al., 2011a). A new damage detection index based on the combination between the mode shape vectors and their curvature was developed and verified to have higher sensitivity than existing algorithms (Fayyadh and Abdul Razak, 2011a). Modifications to two of the existed damage location algorithms were proposed (Fayyadh and Abdul Razak, 2011b). A weighting average procedure was proposed by Fayyadh and Abdul Razak (2011c) which was used to calculate the weighted average values of damage severity algorithms based on the set of the considered bending modes. A new damage severity algorithm was proposed by Fayyadh et al. (2011b) which based on the combination of both natural frequencies and mode shape and it was proven to be better sensitive than exist damage severity algorithms.
5690 Int. J. Phys. Sci.
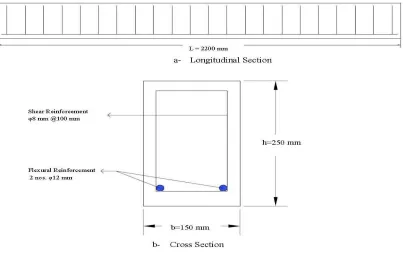
Figure 1. Reinforced concrete beam dimensions and details.
a
b
Figure 2. Finite element modeling of RC beam. (a) Reinforced bar modeling, (b) Beam modeling.
METHODOLOGY
To demonstrate the significance and capability of the mode shape deviation to locate the damage on RC beams, one finite element beam model was built to represent control and damaged simply by supported concrete beams reinforced according to ACI-318-08 (2008). The span length of the beam is 2200 mm with cross sectional dimensions of 150 mm, width by 250 mm depth; reinforced with two of 12 mm diameter steel bars as longitudinal reinforcement and 8 mm with shear stirrups of 100 mm steel bars as shear reinforcement. Figure 1 shows the beam’s reinforcement
and dimensions details.
[image:3.612.123.490.364.576.2]Table 1. Characteristics of the finite element model.
Concrete Reinforcement
Element types
Isotropic solid brick element 20 nodes
Quadratic
Line element 2 nodes
Reinforcement bars
Physical properties Isotropic Reinforcement bar
Cross-sectional area = 226 mm2 (2 bars)
Material properties
Isotropic with Poisson’s ratio = 0.2 Mass density = 2400 kg/m3
E = 26,000 mPa
Embedded reinforcements Young’s Modulus = 200 x 109 N/m2 Yield = Von Mises
Yield value = 420 x 106 N/m2
Supports conditions Hinge in the x and y directions at the left support, and as a roller in the y direction at the right support.
Load Line load at the mid-span of the beam in y direction with initial value of 1 kN
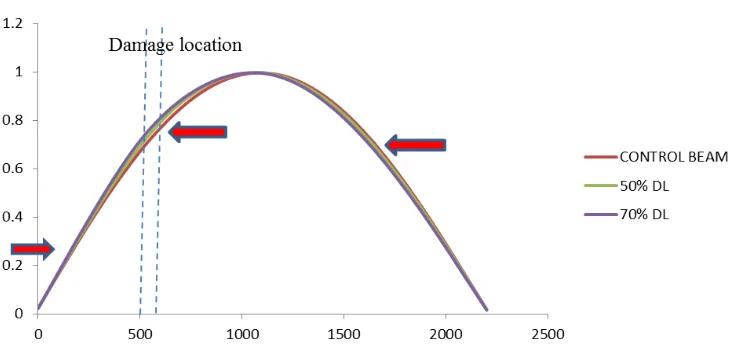
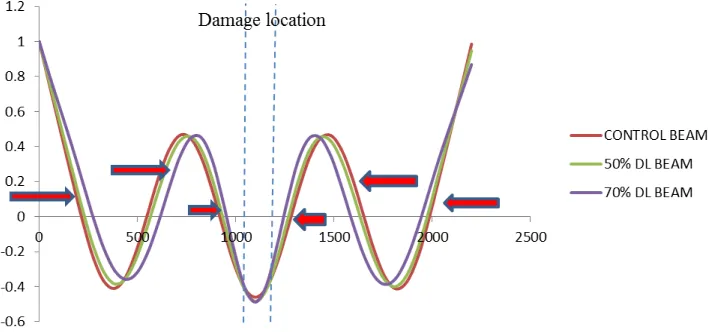
Figure 3. First mode shape at different damage levels for damage located at 550 mm from left support.
and reinforcement details are presented.
The physical and material properties of the concrete were Poisson’s ratio of 0.2, mass density of 2400 kg/m3, Young’s modulus of 26,000 mPa, concrete tensile stress of 3.75 mPa, and concrete compressive strength of 30 mPa. The reinforcement bars were embedded in the brick elements and has a cross-sectional area of 113 mm, Young’s modulus of 200 000 mPa, Von Mises yield value of 420 mPa and steel yield stress of 420 mPa. The support conditions were modeled as a hinge in the x and y directions at the left support and as a roller in the y direction at the right support. The self-weight was computed by taking gravitational acceleration as 9.81 m/s2 in the –
y direction. Table 1 shows the summary of the general characteristics of the finite element models. Initially, an eigen analysis was performed so that modal parameters for the control (undamaged) case were carried out. Next, the beam model was loaded by applying concentrated point loads of 50 and 70% of the failure load in order to induce different degrees of damage located at 0.25 and 0.5 L from the left support. First load cycle comprised of the load applied incrementally in the
following manner: zero to maximum loading of 50%, of the failure load at increments of 1 kN each time and unload from maximum loading to 0 kN with decrements of 1 kN each time. The same procedure was applied to damage level of 70% of the failure load. At each damage level, eigenvalue analysis was again performed to obtain the modal parameters relevant to induced damage level. Finally, the mode shapes for damaged and control cases were plotted and the curve fitting was performed using Chebyshev standard rational series.
RESULTS AND DISCUSSION
[image:4.612.128.496.326.502.2]5692 Int. J. Phys. Sci.
[image:5.612.128.496.303.499.2]Figure 4. First mode shape at different damage levels for damage located at mid-span.
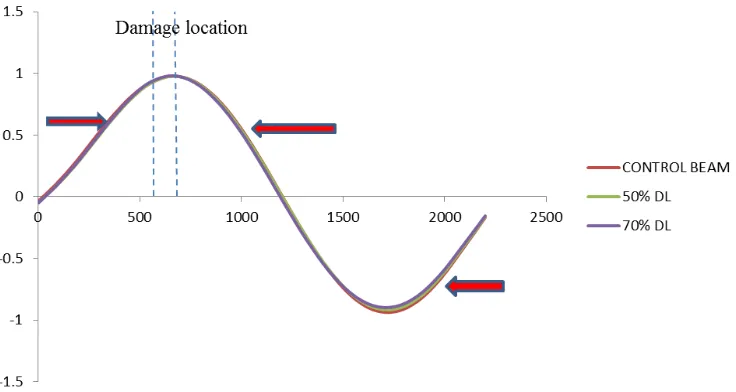
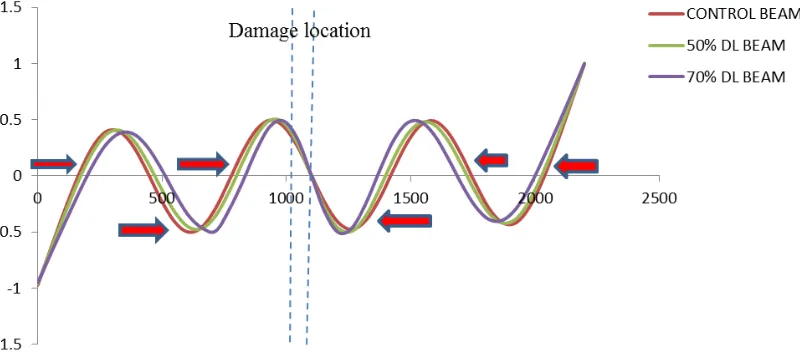
Figure 5. Second mode shape at different damage levels for damage located at 550 mm from left support.
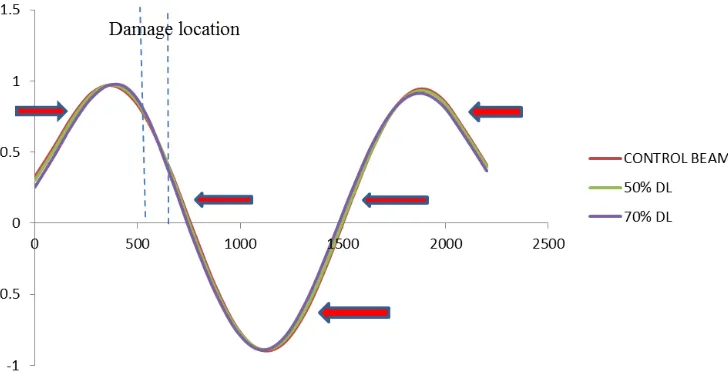
[image:5.612.137.488.555.721.2]Figure 7. Third mode shape at different damage levels for damage located at 550 mm from left support.
Figure 8. Third mode shape at different damage levels for damage located at mid-span.
[image:6.612.143.475.324.496.2] [image:6.612.138.482.551.713.2]5694 Int. J. Phys. Sci.
[image:7.612.98.521.307.500.2]Figure 10. Fourth mode shape at different damage levels for damage located at mid-span.
Figure 11. Fifth mode shape at different damage levels for damage located at 550 mm from left support.
[image:7.612.134.493.554.720.2]Figure 13. Sixth mode shape at different damage levels for damage located at 550 mm from left support.
Figure 14. Sixth mode shape at different damage for damage levels located at mid-span.
mm and 0.5 L = 1100 mm from left support). The results showed good sensitivity and ability of mode shape itself to detect damage location due to deviation of mode shape between damage and control cases. The deviation was directed to the location of damage for both cases of damage location (550 and 1100 mm from left support). The deviation shows the ability of the mode shapes to detect damage location for different damage load value (50b and 70% of failure load). One of the advantages of using the mode shape deviation is that all the modes have the sensitivity to locate the damage.
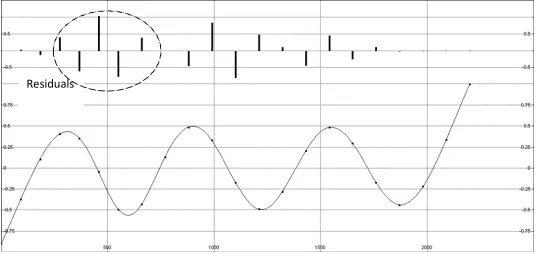
Applying the curve fitting with Chebyshev standard rational series for all modes shape at different damage cases and different damage location showed that the residuals have higher values around the zone of damage and can be use to highlight the damage location. Figures 15 to 18 show some examples on the curve fitting procedure for mode number 6 for two damage cases and
two damage locations.
Conclusions
The following conclusions can be drawn based on the results of the present study.
1. All the considered mode shapes showed good sensitivity to locate the damage regardless of its level or location, where all damaged modes deviated from the undamaged modes toward the damage location.
[image:8.612.110.510.311.487.2]5696 Int. J. Phys. Sci.
[image:9.612.43.574.74.326.2]Residuals
Figure 15. Curve fitting with Chebyshev Standard rational series of the sixth mode at damage level 50% at 550 mm from the left support.
Residuals
Figure 16. Curve fitting with Chebyshev standard rational series of the sixth mode at damaged level 70% at 550 mm from the left support.
ACKNOWLEDGEMENTS
The authors would like to acknowledge the financial assistance provided by University of Malaya through a
[image:9.612.42.579.383.637.2]Residuals
Figure 17. Curve fitting with Chebyshev standard rational series of the sixth mode at damaged level 50% at mid-span.
Residuals
Figure 18. Curve fitting with Chebyshev standard rational series of the sixth mode at damaged level 70% at mid-span.
indirectly, in making this research possible.
REFERENCES
Abdul Razak H, Choi FC (2002). The Effect of Corrosion on the Natural
Frequency and Modal Damping of Reinforced Concrete Beams. Engine. Struct., 23: 1126-1133.
ACI 318-08 (2008). Building Code Requirements for Structural Concern. Alampalli S (2000). Effect of Testing, Analysis, Damage, and
Environment on Modal Parameters. Mech. Syst. Signal Process., 14: 63-74.
[image:10.612.47.574.374.627.2]5698 Int. J. Phys. Sci.
features for structural health monitoring: Laboratory and field demonstrations. Mech. Syst. Signal Process., 22(7): 1650-1669. Cobb RG, Liebst BS (1997). Sensor Placement and Structural Damage
Identification from Minimal Sensor Information. AIAA J., 35(2): 369-374.
De Lautour OR, Omenzetter P (2010). Damage classification and estimation in experimental structures using time series analysis and pattern recognition. Mech. Syst. Signal Process., 24(5): 1556-1569. Deraemaeker A, Reynders E, De Roeck G, Kullaa J (2008).
Vibration-based structural health monitoring using output-only measurements under changing environment. Mech. Syst. Signal Process., 22(1): 34-56.
Dutta A, Talukdar S (2004). Damage Detection in Bridges Using Accurate Modal Parameters. Finite Element Anal. Design, 40: 287 – 304.
Fayyadh MM, Abdul Razak H (2010). The Effect of Support Condition on Dynamic Parameters. The 17th international congress on sound and vibration. Cairo Egypt.
Fayyadh MM, Abdul Razak H (2011a). Stiffness Reduction Index for Detection of Damage Location: Analytical Study. Int. J. Phys. Sci., 6 (9):2194-2204.
Fayyadh MM, Abdul Razak H (2011b). Modified Damage Location Indices in Beam-like Structure: Analytical Study. Scientific Research and Essay. In press.
Fayyadh MM, Abdul Razak H (2011c). Weighting Method for Modal Parameter Based Damage Detection Algorithms. Int. J. Phys. Sci., 6(20): 4816-4825.
Fayyadh MM, Abdul Razak H,Khalil OR (2011a). Differential Effects of Support Conditions on Dynamic Parameters. Procedia Eng., 14(2011): 177–184.
Fayyadh MM, Abdul Razak H, Ismail Z (2011b). Combined modal parameters-based algorithm for damage identification in a beamlike structure: theoretical development and verification. Archive Civil Mech. Eng., 11(3): 587-609.
Fox CHJ (1992). The Location of Defects In Structures: A Comparison of The Use Of Natural Frequency And Mode Shape Data. In Proceeding of the 10th International Modal Analysis Conference, pp. 522–528.
Jassim Z, Fayyadh MM, Mustapha F (2010). Health Monitoring of Cantilever Rod Using Vibration Test “Theoretical and Numerical Study. The 17th international congress on sound and vibration. Cairo Egypt.
Katsikeros CE, Labeas GN (2009). Development and validation of a strain-based Structural Health Monitoring system. Mech. Syst. Signal Process., 23 (2): 372-383.
Kim JT, Park JH, Hong DS, Park WS (2010). Hybrid health monitoring of prestressed concrete girder bridges by sequential vibration-impedance approaches. Engine. Structures, 32(1): 115-128.
Kopsaftopoulos FP, Fassois SD (2010). Vibration based health monitoring for a lightweight truss structure: Experimental assessment of several statistical time series methods. Mech. Syst. Signal Process., 24(7): 1977-1997.
Maeck J (2003). Damage Assessment of Civil Engineering Structures By Vibration Monitoring”, Katholieke University Leuven, Faculteit toegepaste Wetenschappen, Arenbergkastell, B-3001 Heverlee (Belgium), ISBN 90-5682-390-6.
Mayes RL (1992). Error Localization Using Mode Shapes–An Application to a Two Link Robot Arm. In Proceeding of 10th International Modal Analysis Conference, pp. 886–891.
Montalvão D, Ribeiro AMR, Duarte-Silva J (2009). A method for the localization of damage in a CFRP plate using damping. Mech. Syst. Signal Process., 23(6): 1846-1854.
Overbey LA, Todd MD (2009). Effects of noise on transfer entropy estimation for damage detection. Mech. Sys. Signal Process., 23(7): 2178-2191.
Ratcliffe CP (1997). Damage Detection Using A Modified Laplacian Operator On Mode Shape Data. J. Sound Vibrat., 204(3): 505 – 517. Ricardo P, Consuelo H, Juan MO (2008). Identification of Damage in
RC Beams Using Index Based on Local Modal Stiffnes. J. Construct. Build., 22(8): 1656-1667.
Rodríguez R, Escobar JA, Gómez R (2010). Damage detection in instrumented structures without baseline modal parameter. Engine. Struct., 32(6): 1715-1722.
Scott WD, Charles RF, Michael BP (1997). A Summary Review of Vibration Based Damage Identification Methods, Engineering Analysis Group. Los Alamos National Laboratory. Los Alamos, NM. Todorovska MI, Trifunac MD (2008). Earthquake damage detection in
the Imperial County Services Building III: Analysis of wave travel times via impulse response functions. Soil Dyn. Earthquake Eng., 28(5): 387-404.