International Journal of Emerging Technology and Advanced Engineering
Website: www.ijetae.com (ISSN 2250-2459,ISO 9001:2008 Certified Journal, Volume 6, Issue 3, March 2016)
85
Power Quality Enhancement in Power Distribution System by
Using Fuzzy Logic Controlled D-STATCOM
Jitendra Kumarˡ, Dr. S. K. Srivastava²
1
PG Scholar, 2Associate Professor, Department of Electrical Engineering, MMMUT Gorakhpur, India 273010 Abstract-This Paper distinguished the problems related
to distribution system in terms of clean power and their solutions, in the particular of compensation of reactive power. The abnormalities has been modelled and then analyzed. The deviations in the distributions system analyzed by the using D-STATCOM in the real time with the LCL passive filter. Fuzzy logic control scheme is implemented for the control of D-STATCOM so that it can make reactive power and THD under control. A SIMULINK model has been developed for the proposed system. Simulink results for various operating conditions has been obtained and analyzed for the merit of proposed control technique.
Keywords- D-STATCOM, Voltage Sag, FLC, LCL passive filter, THD
I. INTRODUCTION
In the present scenario power quality become major concern with the solid state devices, the performance is very close to the quality of power which is utilized by the utility centre. Utilities have the greater interest to utilize the existing power capacities .Power quality issues manifested to a undesired current or frequency or voltage that leads to the system in failure conditions or makes a misoperation at the consumer end. In today’s industrializations and modernisations of the power sector contains solid state power electronics devices like as IGBTs, MOSFETs and PLCs .All these devices is most affected by the quality of power such as harmonics, voltage swells/sag. Major power quality problems is voltage sags that contributes more than eighty percent of all these power quality issues. Voltage sags is decrease in rms amplitude value at the power frequency for a time period of few seconds. Different fault in the power system creates a voltage sag in the utility system. Fault at the customers end increases large current in the load system, resulted in the starting of motor or enerzitation of transformer. Typically faults like as single phase to ground or multiple phase with ground leads a very high current causes a voltage dip over the system impedance network. Voltage are hazards for the electronics equipment used by industry like as adjustable speed drive, robotics, programmable logic controllers. Different technique have been applied for the reduction or mitigations of voltage sag. Some conventional process are using bank of capacitor, implementation of parallel connected feeders or apply uninterruptible power supplies.
The power quality are not completely mitigated due to high cost of new feeders and controlled compensation of reactive power. A D-STATCOM (distributed static shunt compensator) are used for the mitigation of voltage sag as well as voltage stability, voltage flicker reduction. This paper consists a D-STATCOM with passive LCL filter and connected to 11kv distribution system in parallel or in shunted. The D-STATCOM also improve the power quality like as low power factor and harmonic distortion. In this paper section I represent introduction of test system. Section II describes the power quality issues such as voltage sag/swells. Section III represents modelling and principle of operation for the test system. Fuzzy logic control technique, system implementation and simulation results are discussed in the section IV,V and VI respectively.
II. VOLTAGE SAG AND SWELL
Voltage sag and swell is mainly caused by the faulty conditions short circuit, over load situations and on/off of high capacity motors. Injections of voltage by DVR to maintain and restore sensitive voltage to it’s normal operating value, for achieving zero power or minimum for compensation to the system by selecting an proper amplitude and angle between phase for a period of half of cycle to one minute . Voltage sag can happened at any instant with 10% to 90% of amplitude ranges of voltage. Voltage swells are defined as opposite of voltage sag i.e increment of rms value of voltage or current at frequency of power for a duration of 0.5 cycle to 60 seconds. Magnitude of voltage swells ranges from 1.1 to 1.8 increment value.IEE519-1992 and IEEE1159-1995 standard are shown in fig 1
International Journal of Emerging Technology and Advanced Engineering
Website: www.ijetae.com (ISSN 2250-2459,ISO 9001:2008 Certified Journal, Volume 6, Issue 3, March 2016)
86
Voltage swells are rarely happen phenomenon in distribution system i.e not much important as voltage sag/dip.
III. BASIC STRUCTURE AND OPERATING PRINCIPAL
OF D-STATCOM
The D-STATCOM is voltage source converter based shunt FACTs devices. It have capacity of absorbing or generating reactive power. The reactive source could be controlled. D-STATCOM is connected to the distribution system by coupling transformer to isolate the D-STATCOM from the distribution system. It’s need the device to be implemented as close to the most affecting loads to enhance the compensation in the distribution system. D-STATCOM injects only reactive power and plays major role on the weak ac system. D-STATCOM is composed of voltage source converter, filter and energy storage devices as shown in fig 2.
[image:2.595.349.525.152.256.2]A)Coupling Transformer- It’s used to connect the D-STATCOM to the distribution system. It’s act as a isolation between D-STATCOM circuit and distribution system.
Fig 2- Basic Structure of D-STATCOM
B)VSC(Voltage source Converter)- A voltage converter are composed of switching devices and storage devices, producing a sinusoidal voltage at desired instant of frequency, amplitude and angle of phase. Application of D-STATCOM is injects the compensating current into the distribution system on the basis of unbalance or distortion amount.
Generally IGBTs is choosen as a switching devices.
I out = IL-Is = IL-[(V th- VL)/Z th]
C)DC Link Capacitor- The capacitor act as a storage devices and provide dc link voltage at the standard value
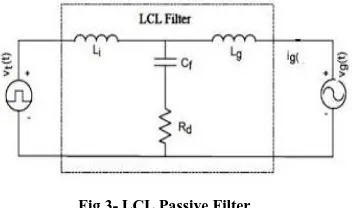
[image:2.595.63.271.390.554.2]D)LCL Passive Filter- The configuration of LCL filter is shown in fig 3.
Fig 3- LCL Passive Filter
Generally high order LCL filter has been used instead of conventional L-filter for improving the current waveform getting from VSI [13]. By using LCL filter obtaining best attenuation as well as cost saving and size and weight reduction. To model this following equations are used.
√
⁄
For efficient LCL passive filter
E) Principal of Operation-
The D-STATCOM are placed for the compensation of reactive power from which they are interconnected. It is producing 3 phase alternating voltage to a direct source of voltage. The magnitude of the voltage are controlled to maintain amount of reactive power to enhance the system voltage profile. Generally D-STATCOM voltage (Vsh) injected with phase the bus voltage (Vt). There is need of injected energy but reactive power to be absorb or injected by the D-STATCOM system. The compensation of reactive power is takes place by the changing the magnitude of out voltage of D-STATCOM. The basic operating principal of D-STATCOM is described by fig 4. The output voltage of IGBTs (Vsh) is maintained in phase to the bus voltage (Vt) and. current output changes as Vsh [8,9]
If-
I) Vt < Vsh- Ish leads t by 0 . As a consequence leading reactive power produced by the D-STATCOM (i.e Capacitive mode)
II) Vt > Vsh- Ish lag t by 0 . As a consequence lagging reactive power absorb by D-STATCOM.(i.e Inductive mode)
International Journal of Emerging Technology and Advanced Engineering
Website: www.ijetae.com (ISSN 2250-2459,ISO 9001:2008 Certified Journal, Volume 6, Issue 3, March 2016)
[image:3.595.321.540.133.308.2]87
Fig 4- Operating Principal of D-STATCOM
IV. FUZZY LOGIC CONTROLLER SCHEME
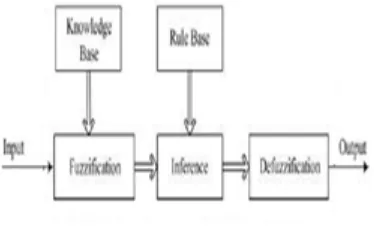
The proposed model used fuzzy logic control as a controller. Mamdani proposed FLC for a system has number of input and output is only one. It is a mathematical system dealing along to the probability and soft computing provides. Fuzzy logic controller mainly used for controlling of inverter action. It follows “if x and y then Z” technique for getting solution of control problem on the place of mathematically approach of the system. Fig 5 shows the basic structure of FLC
Fig 5- Block Diagram of Control System
A)Estimation of Error- The error is estimated on the difference among the bus voltage and reference voltage. The rate of error is time rate of the error. B)Fuzzification- Fuzzification is a process through
[image:3.595.328.538.417.616.2]which the crisp quantities are changes into the fuzzy, so the fuzzification process assign the membership value of the crisp quantities. Triangle membership function are used to the input and output as shown in fig 6.
Fig 6- Membership Function of Input and Output
Error and rate of error are used to the linguistic variable.
C) Fuzzy Rule Base- The linguistic variables that are used are POS, POM, POB, NES, NEB, NEM and ZE. The fuzzy process is based on Mamdani method in this wok. The set of rules for controller are shown in table. If then rule is used to describe the base rule.
Table I Rule Base of Fuzzy Logic
[image:3.595.75.262.419.532.2]International Journal of Emerging Technology and Advanced Engineering
Website: www.ijetae.com (ISSN 2250-2459,ISO 9001:2008 Certified Journal, Volume 6, Issue 3, March 2016)
88
V. MODELLING OF PROPOSED SYSTEM
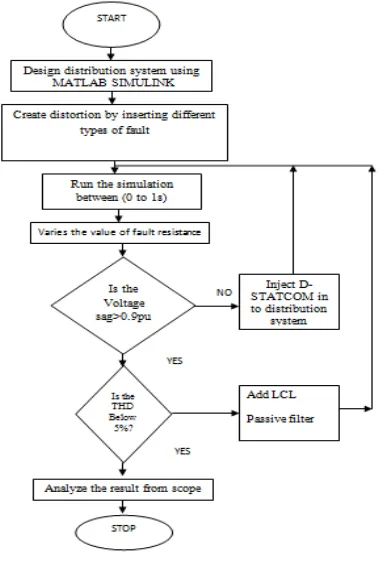
[image:4.595.319.543.163.343.2]In this study D-STATCOM is proposed to enhance the quality of power for the 11 kv distributed network. System is composed of a feeder that transfer power to distributed network at 50 Hz. The control strategy of the system is shown in fig 7.
Fig 7- Flow Chart for Control Strategy
[image:4.595.82.272.214.498.2]D-STATCOM is placed at the distribution end. The simulation parameter are shown in Table II.
Table II- Simulation Parameter
Proposed system are simulated 0n MATLAB 2012a which is shown in fig
Fig 7-Simulink Model of Test System
VI. SIMULINK RESULT AND DISSCUSION
[image:4.595.303.561.437.565.2]The test system are implemented for the various fault conditions such as single line ground, line to line, double line to ground, at various resistances.
Table III Simulink Result
Various Faults
Faults Resista -nces
System Voltage(pu)
Without DSTATCO
M
System Voltage(
pu) With DSTAT
COM
% Improve
ment
SLG 0.68 0.829 0.965 16.40
DLG 0.78 0.751 0.978 30.23
LL 0.88 0.817 0.992 21.42
TLG 0.68 0.671 0.935 39.34
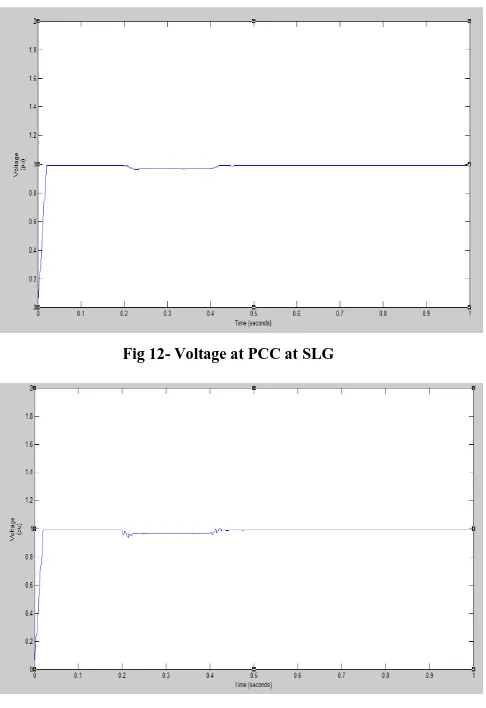
The table II shows the simulated results of voltage in pu for the various conditions. From the above results it is clear that the voltage profile of the system improved. TLG is most severe fault condition where the compensation of sag is more to improve voltage profile. Fig. 9 and fig. 12 shows system voltage value (pu) for various fault conditions at various resistances as shown in table II.
No System Values
01 Inverter IGBT based, 3 arm, 6 Pulse Carrier Frequency= 1080 Hz Sample time= 5µ second 02 Three
Phase Transforme r
Nominal Power=100 MVA Frequency=50 Hz
Magnetization Resistance Rm(pu)=500
Magnetization Induction Lm(pu)=500
[image:4.595.43.270.543.713.2]International Journal of Emerging Technology and Advanced Engineering
Website: www.ijetae.com (ISSN 2250-2459,ISO 9001:2008 Certified Journal, Volume 6, Issue 3, March 2016)
89
[image:5.595.150.545.94.740.2]A)System Voltage Wituout D-STATCOM-
Fig 8- Voltage at PCC at SLG
Fig 9- Voltage at PCC at DLG
[image:5.595.314.558.108.311.2]Fig 10- Voltage at PCC at LL
Fig 11- Voltage at PCC A TLG
[image:5.595.47.285.132.679.2]B)System voltage with D-STATCOM- Fig 12 to fig 16 shows the voltage of system with D-STATCOM at various fault and fault resistances. This is shows the compensation of voltage sag in the power system and voltage maintain within control.
Fig 12- Voltage at PCC at SLG
[image:5.595.317.560.375.729.2]International Journal of Emerging Technology and Advanced Engineering
Website: www.ijetae.com (ISSN 2250-2459,ISO 9001:2008 Certified Journal, Volume 6, Issue 3, March 2016)
[image:6.595.49.291.111.473.2]90
Fig 14- Voltage at PCC at LL
Fig 15- Voltage at PCC at TLG
[image:6.595.316.550.124.329.2]VII. PERFORMANCE OF D-STATCOM WITH LCL FILTER
Fig 16- THD of Current without Filter
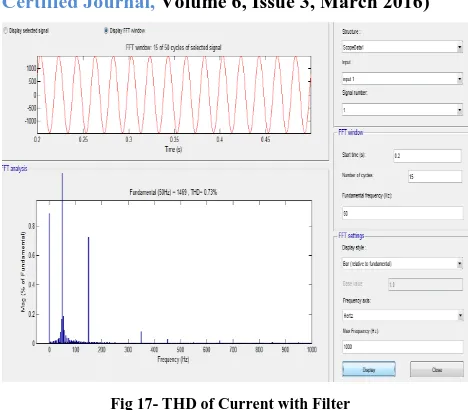
Fig 17- THD of Current with Filter
Fig 16 and fig 17 shows the TOTAL HARMONIC DISTORTION (THD) for the current of D-STATCOM without LCL filter /with LCL filter . THD is 43.43% without filter although when filter is connected it’s improved to 0.73%.
VIII. CONCLUSION
The result obtained by the simulation represents that the mitigation is done for voltage sag by implementing D-STATCOM in the power distribution system. In addition to the fuzzy logic controller and LCL passive filter with D-STATCOM, THD is very less and power factor approximately close to the unity. Thus the power quality of the power distribution can be improved. D-STATCOM’s performance can be further improved by applying intelligent optimization such as ANNs and genetics algorithm.
REFERENCES
[1] GYaleinkaya, M.H.J. Bollen, P.A. Crossley, “Characterization of voltage sags in industrial distribution systems”, IEEE transactions on industry applications, vol.34, no. 4, July/August, pp. 682-688, 1999.
[2] Haque, M.H., “Compensation of distribution system voltage sag by DVR and D-STATCOM”, Power Tech Proceedings, 2001 IEEE Porto, vol.1, pp.10-13, Sept. 2001.
[3] Anaya-Lara O, Acha E., “Modeling and analysis of custom power systems by PSCAD/EMTDC”, IEEE Transactions on Power Delivery, Vol.17, Issue: 1, Jan. 2002, Pages:266 – 272 [4] D. Prasad,T. Sandeep Kumar, Dr.B.Venkata Prasanth,
Dr.K.S.G.Sankar “ Fuzzy Logic Control of D-Statcom for Power Quality Improvement” Journal of Engineering Research and Applications, Vol. 3, Issue 6, Nov-Dec 2013.
[image:6.595.48.290.494.691.2]International Journal of Emerging Technology and Advanced Engineering
Website: www.ijetae.com (ISSN 2250-2459,ISO 9001:2008 Certified Journal, Volume 6, Issue 3, March 2016)
91
[6] Jovica V. Milanovic´, Fellow, IEEE, and Yan Zhang, “Modeling of FACTS Devices for Voltage Sag Mitigation Studies in Large Power Systems,” IEEE Transactions On Power Delivery, ol. 25, No. 4, October 2010.
[7] Bhim Singh,, P. Jayaprakash, Sunil Kumar, and D. P. Kothari,“ Implementation of Neural-Network-Controlled Three-Leg VSC and a Transformer as Three-Phase Four-Wire DSTATCOM,” IEEE Transactions On Industry Applications, Vol. 47, No.4, July/August 2011.
[8] K. R. Suja, I. Jacob Raglend, “Genetic Algorithm- Neuro-Fuzzy Controller (GANFC) Based UPQC Controller for Compensating PQ Problem”, European Journal of Scientific Research ISSN 1450-216X Vol.78 No.2 (2012), pp.184-197
[9] A. Ghosh and G. Ledwich, Power quality enhancement using custom power devices, Massachusetts, USA.: Kluwer Academic Publishers, 2002.
[10] A.L. Olimpo and E. Acha, “Modeling and analysis of custom power systems by PSCAD/EMTDC,” IEEE Trans. Power Delivery, vol. 17, no. 1, pp. 266-272, Jan. 2002.
[11] Mohit Bajaj, Vinay Kumar Dwivedi, Ankit Kumar, Anurag Bansal, "Design and simulation of DSTATCOM for power quality Enhancement in distribution Networks under various Fault Condition," International Journal of Emerging Technology and Advanced Engineering, Volume 3, Issue 4, pp 620-626, April 2013.
[12] Sai Kiran Kumar.Sivakoti, Y.Naveen Kumar, D.Archana, "Power Quality Improvement In Distribution System Using D-Statcom In Transmission Lines," International Journal of Engineering Research and Applications (IJERA), ISSN: 2248-9622, Vol. 1, Issue 3, pp.748-752.
[13] T. K. Abdel-Galil, E.F. El-Saadany and M.M.A. Salama “Effect of New Deregulation Policy on Power Quality Monitoring and Mitigation Techniques”, Transmission and Distribution Conference and Exposition, Vol.1, pp.554-560, 2001.
[14] Yueqiu Wang, Jie Tang, Xionger Qiu "Analysis and Control of D-STATCOM under unbalanced voltage condition" 2011 International Conference on Mechatronic Science, Electric Engineering and Computer August 19-22, 2011, Jilin, China. [15] G. K. Morison, B. Gao, and P. Kundur, “ oltage stability analysis
using static and dynamic approaches,” IEEE Trans. Power Systems, vol. 8, pp. 1159–1171, Aug. 1993.
[16] Walmir Freitas, "Impacts of AC Generators and DSTATCOM Devices on the Dynamic Performance of Distribution Systems," IEEE Trans. Power Delivery, vol. 20, no. 2, pp 1493- 1501, April 2005.
[17] E. Acha, Electronic Control in Electrical Power Systems, London, UK.: Butter-Worth-Heinemann, 2001.