An investigation into the validity of
utilising the CDRAD 2.0 phantom for
optimisation studies in digital radiography
AlMurshedi, S, Hogg, P and England, A
http://dx.doi.org/10.1259/bjr.20180317
Title An investigation into the validity of utilising the CDRAD 2.0 phantom for optimisation studies in digital radiography
Authors AlMurshedi, S, Hogg, P and England, A
Type Article
URL This version is available at: http://usir.salford.ac.uk/id/eprint/47331/ Published Date 2018
USIR is a digital collection of the research output of the University of Salford. Where copyright permits, full text material held in the repository is made freely available online and can be read, downloaded and copied for noncommercial private study or research purposes. Please check the manuscript for any further copyright restrictions.
1
An investigation into the validity of utilising the CDRAD 2.0 phantom for optimisation studies in digital radiography
Abstract
Objectives: To determine if a relationship exists between low contrast detail (LCD) detectability using the CDRAD 2.0 phantom, visual measures of image quality (IQ) and simulated lesion visibility (LV) when performing digital chest radiography (CXR).
Methods: Using a range of acquisition parameters, a CDRAD 2.0 phantom was used to acquire a set of images with different levels of image quality. LCD detectability using the CDRAD 2.0 phantom, represented by an image quality figure inverse (IQFinv) metric, was determined using the
phantom analyser software. A Lungman chest phantom was loaded with two simulated lesions,
of different sizes / placed in different locations, and was imaged using the same acquisition factors as the CDRAD phantom. A relative visual grading analysis (VGA) was used by seven observers for IQ and LV evaluation of the Lungman images. Correlations between IQFinv, IQ and LV were
investigated.
Results: Pearson’s correlation demonstrated a strong positive correlation (r=0.91; p<0.001) between the IQ and the IQFinv. Spearman’s correlation showed a good positive correlation (r=0.79;
p<0.001) and (r=0.68; p<0.001) between the IQFinv and the LV for the first lesion (left upper lobe)
and the second lesion (right middle lobe), respectively.
Conclusions: From results presented in this study, the automated evaluation of LCD detectability using CDRAD 2.0 phantom is likely to be a suitable option for IQ and LV evaluation in digital CXR optimisation studies.
2
1. Introduction
An essential technical priority of any X-ray examination is the production of an image with sufficient quality to answer the clinical question. Balanced against this is the requirement to avoid
unnecessary radiation risk to the patient 1.Within national legislature, a key aim is to identify acquisition parameters which deliver acceptable image quality with the lowest radiation dose practicable 2. Methods for patient dose assessment are readily available but the approaches for image quality (IQ) assessment are more complex. Observer performance methods, such as receiver operating characteristic (ROC) and visual grading analysis (VGA), are often utilised for evaluating clinical IQ in research studies 3–6. Nevertheless, they are difficult to implement for the purpose of evaluating IQ, within and between hospitals and to use ROC and VGA methods within routine quality assurance programmes would be time consuming and require a large number of images. Physics contrast-detail (CD) phantoms, such CDRAD 2.0 phantom, are normally used in medical physics departments7 and have been widely used within the literature for optimisation studies and when comparing the performance of imaging systems 8–12. The CDRAD 2.0 phantom does have limitations, it has a uniform background which does not take into account the influence of anatomical noise arising when imaging human anatomy 13. The principle of this phantom is based on the Rose model which assumes that the quantum noise is the limiting factor which can influence image quality (LCD detection)14. This assumption is true for the CDRAD 2.0 phantom,
but it could be limited for several common clinical tasks in diagnostic radiology 13.Within clinical
practice, the limiting factor for LCD detection performance is the anatomical background which is considered to be the most influential factor in CXR IQ rather than the quantum noise 15–17 . As
such, the validity of using the CDRAD 2.0 phantom for representing the chest region for IQ and
LV evaluations, including optimisation studies is questionable and needs further investigation13. It would be extremely useful if this phantom could predict visual (perceptual) IQ and LV in the
clinical setting since these parameters are more useful in optimisation studies, when undertaking routine quality assurance and also when evaluating and comparing IQ between systems.
3
2. Materials and Methods
Image acquisition
Two different phantoms were used in this study, 1) an anthropomorphic Lungman chest phantom (Kyoto Kagaku Co., Japan) 18, loaded with two spherical phantom lesions that simulate pulmonary nodules. A 10 mm +100 HU lesion was placed in left upper lobe and a 12 mm +100 HU lesion was placed in the right middle lobe. Lesion type and placement was based on the need to simulate a clinically relevant scenario and also take into account the complexity of the anatomical surroundings. This approach has been previous reported in the literature 19. 2) the CDRAD 2.0 phantom (Artinis Medical System, The Netherlands)20. This phantom consists of a square acyclic plastic plate (265 x 265mm). It is 10 mm thick and has holes of various depths and diameters providing a range of differently sized contrast details against a uniform background. Lungman was required for evaluating IQ and LV, while the CDRAD 2.0 phantom was required for evaluating LCD detectability. Image acquisitions were undertaken using a commercially available X-ray machine (Wolverson X-Ray Ltd, Willenhall, West Midlands, UK) with an erect Bucky encompassing an anti-scatter radiation grid (10:1 ratio, 40 line/cm frequency) and 3 mm Al inherent X-ray beam filtration and a Konica Minolta Aero DR detector (Konica Minolta Medical Imaging USA INC, Wayne, NJ, USA). Forty-two images of the Lungman phantom were acquired
4
Billdal, Sweden), additionally the beam quality (half-value layer, HVL) for each kVp value was recorded using the same dosimeter (Appendix).
Image quality evaluation
LCD detectability from the CDRAD 2.0 phantom was represented by an IQFinv value, this was the
average of the three repeated images and was produced automatically using the phantom analyser software20. The IQFinv was calculated using the following equation20:-
𝐼𝑄𝐹𝑖𝑛𝑣 = ∑ 1 𝐶𝑖𝑥𝐷(𝑖,𝑡ℎ)
15
𝑖=1
D(i, th) represents the lowest diameter (threshold diameter) in column (i) that has a visible hole
correctly detected; Ci represents the depth value (contrast) of the object (visible hole) in the column
(i). Using the analyser software, the input parameters were set as follows; 1) the alpha level of significance was set at 1e-008, as recommended in the literature20, 24. 2) the priori difference of means was set relative to the image bit depth20, finally, SID was set to 180 cm.
IQ and LV for the Lungman phantom images were evaluated visually by seven qualified diagnostic radiographers. They applied a relative VGA method and a 5 point Likert scale (1= much worse ,2=
worse ,3= equal ,4= better ,5=much better) using bespoke computer software 25 .The criteria used for IQ and LV evaluations are demonstrated in Tables 1 and 2, respectively and they are based on the European Guidelines 26 and the study by Ma et al. 27. Two simulated lesions, in two different locations, as previously described were selected as shown in Figure 1. For the relative VGA method, images were presented to observers on a computer monitor, on the left-hand monitor there was a fixed reference image and on the right hand monitor an image was randomly displayed from the experimental image bank. Each observer reviewed the images using a 5 mega-pixel DOME E5 (NDSsi, Santa Rosa, CA) monitors (2048 by 2560 pixels), calibrated to the DICOM Grey Scale Display Function (GSDF) Standard 28,and applied the set of criteria whilst making a comparison against the reference image. The reference image was selected by consensus opinion from expert observers since it had ‘average’ quality when compared with the others. This was to ensure that
5
[image:6.612.74.526.220.436.2]This approach was similar for the calculations of overall LV, for each image, by each observer. Next, the final IQ score for each image was determined by taking the average IQ score across the seven observers, and the same method was used for LV. Ethical approval for this study was granted from the University of Salford (HSR1617-76).
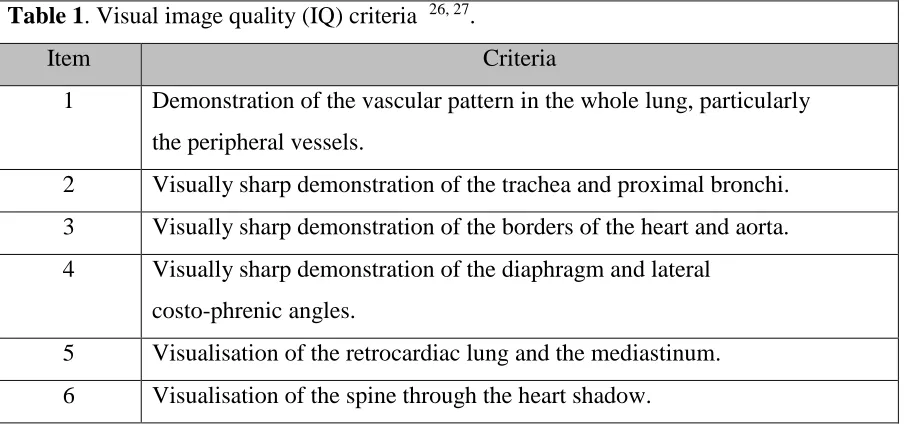
Table 1. Visual image quality (IQ) criteria 26, 27.
Item Criteria
1 Demonstration of the vascular pattern in the whole lung, particularly the peripheral vessels.
2 Visually sharp demonstration of the trachea and proximal bronchi. 3 Visually sharp demonstration of the borders of the heart and aorta.
4 Visually sharp demonstration of the diaphragm and lateral costo-phrenic angles.
5 Visualisation of the retrocardiac lung and the mediastinum.
6 Visualisation of the spine through the heart shadow.
Table 2. Simulated lesion visibility (LV) criteria27. Item Criteria
1 Contrast of nodule, against background.
2 Brightness of nodule, against background.
6
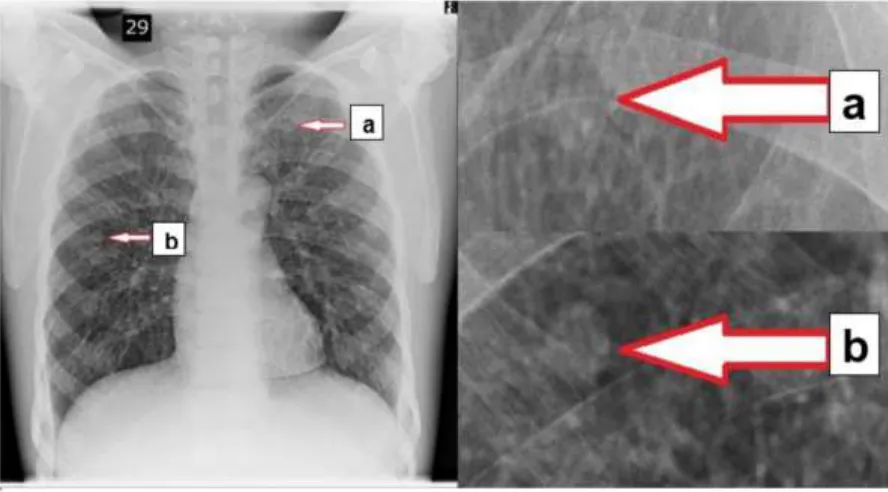
Figure 1. An example of a Lungman chest phantom image illustrating the two simulated lesions for the LV evaluation. (a) 10 mm +100 HU lesion placed in left upper lobe. (b) The 12 mm +100 HU lesion was placed in the right middle lobe.
Statistical analysis
Data were analysed using SPSS version 22.0 (IBM Inc, Armonk, New York, US). Data were first examined to investigate normality based on visual inspection of the data and the Shapiro-Wilk test. This was to determine the most appropriate correlation statistic between IQFinv and IQ and the LV.
Data, which were normally distributed, were analysed using Pearson’s correlation coefficient; non-parametric data were analysed using Spearman’s correlation coefficient. The interpretation of the
strength of the correlation (r) was conducted based on recommendations from the literature30, 31, in which r=0.1-0.29 (small), r=0.30-0.49 (medium), and r=0.50-1.0 (large).
IQ and the IQFinv had a normal distribution whereas LV showed a non-parametric distribution. To
7
3. Results
The IQFinv values from the CDRAD 2.0 phantom images and visual IQ and LV evaluations,
together with the acquisition parameters are illustrated in Table 3. Correlation analysis between
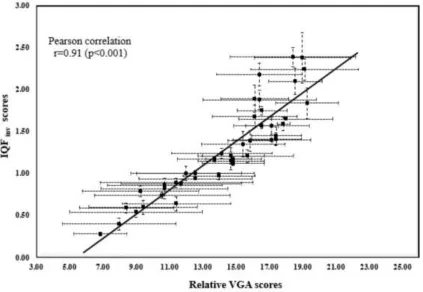
IQ and IQFinv demonstrated a strong positive correlation (r=0.91; p<0.001). Spearman’s
correlation was used to compare the IQFinv and LV. A good correlation was observed for both
lesions; lesion one (r=0.79; p<0.001); lesion two (r=0.68; p<0.001). Figure 2 illustrates the linear regression curve between the IQ and IQFinv. Figures 3 and 4 demonstrate the relationship, using
a linear regression curve, between the LV for the first lesion and the second lesion again as a function of IQFinv.
8
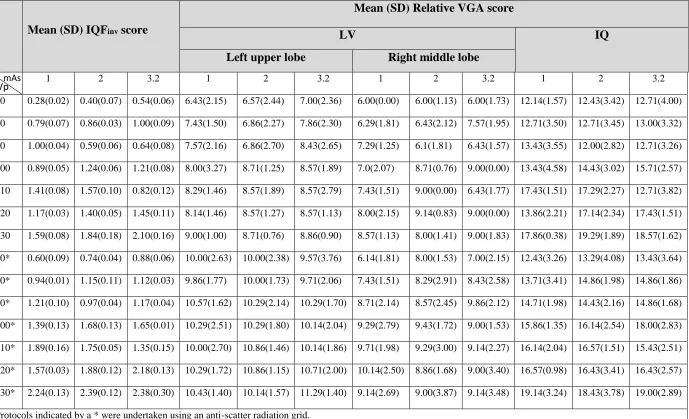
Table 3.Acquisition parameters used to acquire study images and the resultant mean and standard deviation (SD) of IQFinv, IQ and LV values.
Mean (SD) IQFinv score
Mean (SD) Relative VGA score
LV IQ
Left upper lobe Right middle lobe
1 2 3.2 1 2 3.2 1 2 3.2 1 2 3.2
70 0.28(0.02) 0.40(0.07) 0.54(0.06) 6.43(2.15) 6.57(2.44) 7.00(2.36) 6.00(0.00) 6.00(1.13) 6.00(1.73) 12.14(1.57) 12.43(3.42) 12.71(4.00)
80 0.79(0.07) 0.86(0.03) 1.00(0.09) 7.43(1.50) 6.86(2.27) 7.86(2.30) 6.29(1.81) 6.43(2.12) 7.57(1.95) 12.71(3.50) 12.71(3.45) 13.00(3.32)
90 1.00(0.04) 0.59(0.06) 0.64(0.08) 7.57(2.16) 6.86(2.70) 8.43(2.65) 7.29(1.25) 6.1(1.81) 6.43(1.57) 13.43(3.55) 12.00(2.82) 12.71(3.26)
100 0.89(0.05) 1.24(0.06) 1.21(0.08) 8.00(3.27) 8.71(1.25) 8.57(1.89) 7.0(2.07) 8.71(0.76) 9.00(0.00) 13.43(4.58) 14.43(3.02) 15.71(2.57)
110 1.41(0.08) 1.57(0.10) 0.82(0.12) 8.29(1.46) 8.57(1.89) 8.57(2.79) 7.43(1.51) 9.00(0.00) 6.43(1.77) 17.43(1.51) 17.29(2.27) 12.71(3.82)
120 1.17(0.03) 1.40(0.05) 1.45(0.11) 8.14(1.46) 8.57(1.27) 8.57(1.13) 8.00(2.15) 9.14(0.83) 9.00(0.00) 13.86(2.21) 17.14(2.34) 17.43(1.51)
130 1.59(0.08) 1.84(0.18) 2.10(0.16) 9.00(1.00) 8.71(0.76) 8.86(0.90) 8.57(1.13) 8.00(1.41) 9.00(1.83) 17.86(0.38) 19.29(1.89) 18.57(1.62)
70* 0.60(0.09) 0.74(0.04) 0.88(0.06) 10.00(2.63) 10.00(2.38) 9.57(3.76) 6.14(1.81) 8.00(1.53) 7.00(2.15) 12.43(3.26) 13.29(4.08) 13.43(3.64)
80* 0.94(0.01) 1.15(0.11) 1.12(0.03) 9.86(1.77) 10.00(1.73) 9.71(2.06) 7.43(1.51) 8.29(2.91) 8.43(2.58) 13.71(3.41) 14.86(1.98) 14.86(1.86)
90* 1.21(0.10) 0.97(0.04) 1.17(0.04) 10.57(1.62) 10.29(2.14) 10.29(1.70) 8.71(2.14) 8.57(2.45) 9.86(2.12) 14.71(1.98) 14.43(2.16) 14.86(1.68)
100* 1.39(0.13) 1.68(0.13) 1.65(0.01) 10.29(2.51) 10.29(1.80) 10.14(2.04) 9.29(2.79) 9.43(1.72) 9.00(1.53) 15.86(1.35) 16.14(2.54) 18.00(2.83)
110* 1.89(0.16) 1.75(0.05) 1.35(0.15) 10.00(2.70) 10.86(1.46) 10.14(1.86) 9.71(1.98) 9.29(3.00) 9.14(2.27) 16.14(2.04) 16.57(1.51) 15.43(2.51)
120* 1.57(0.03) 1.88(0.12) 2.18(0.13) 10.29(1.72) 10.86(1.15) 10.71(2.00) 10.14(2.50) 8.86(1.68) 9.00(3.40) 16.57(0.98) 16.43(3.41) 16.43(2.57)
130* 2.24(0.13) 2.39(0.12) 2.38(0.30) 10.43(1.40) 10.14(1.57) 11.29(1.40) 9.14(2.69) 9.00(3.87) 9.14(3.48) 19.14(3.24) 18.43(3.78) 19.00(2.89)
Protocols indicated by a * were undertaken using an anti-scatter radiation grid.
9
Figure 2. Linear regression curve between mean IQFinv scores and mean IQ values. Error bars
10
Figure 3. Linear regression curve between the mean IQFinv scores against the mean LV scores for
11
Figure 4. Linear regression curve between the mean IQFinv scores against the mean LV scores
12
4. Discussion
Image quality and lesion visibility studies have a number of applications within medical imaging but are notoriously labour intensive. Automated methods for evaluating IQ are attractive but
historically there has been a lack of data on their relationships with perceptual (visual) methods. It must be acknowledged that there are potential limitations when using the CDRAD phantom for
IQ evaluation and CXR optimisation studies. The chest region is classified as a quantum-saturated
region where the anatomical structures are the main factor that influence lesion detection and IQ
when compared with quantum noise 34. Quantum noise is a limiting factor for physics phantoms
(i.e. CDRAD 2.0) whereas images acquired on patients would be limited by anatomical noise.
Results from our study have demonstrated a strong positive correlation (r=0.91; p<0.001) between the physical evaluation of LCD detectability (IQFinv from the CDRAD 2.0 phantom) and IQ
evaluations from Lungman. Based on IQ alone, the CDRAD 2.0 phantom appears to be a valid and a well justified approach and can be used as a surrogate for IQ tasks using an anthropomorphic phantom when evaluating the performance of radiography systems or during optimisation studies. For LV, it is important to know to what extent there is correlation between the IQFinv values and
LV from the Lungman phantom images since the CDRAD 2.0 phantom was designed to examine the performance of imaging systems in visualising LCD objects.
Our findings demonstrated a good positive correlation between IQFinv and LV for the two
simulated lesions; the first lesion showed r=0.79 (p<0.001) and the second lesion showed r=0.68 (p<0.001). It was useful to examine the correlation between the IQFinv and the LV when the lesions
were located in different positions and with different levels of visibility (high and low). This was necessary to understand how the variations in the location and visualisation of the lesion affect the
correlation values of IQFinv. Although the two simulated lesions have the same HU value (+100
HU), the radiographic visibility of the first simulated lesion (in the left upper lobe) was lower than
13
that of the second simulated lesion (12 mm). It was found that the lesion with lower visibility (left upper lobe) had higher correlation (r=0.79) when compared with that of the higher visibility lesion (right middle lobe, r=0.68). A possible reason behind this could be because the small levels of improvement and degradation of general IQ which would have a higher impact on increasing or decreasing the visualisation of the lower visibility lesion when compared with that of the higher visibility lesion (acquisition parameters had more of an effect on the lower visibility lesion). The good positive correlation observed under these two conditions provides a useful indication on the utility of the CDRAD 2.0 phantom for investigating the performance of an imaging system in LCD
detection.
To our knowledge, only one study undertaken by De Crop and colleagues, attempted to investigate the correlation between the LCD detectability using a CDRAD 2.0 phantom and IQ from cadaveric images using an absolute VGA method21. However, the correlation between LV and LCD detectability from CDRAD 2.0 has not been investigated. Within the work of De Crop et al.21 comparable results were reported with a strong positive correlation (r=0.91; p=0.001) between the physical evaluation of IQFinv (CDRAD 2.0) and IQ (cadavers). Our work has built upon the study
by De Crop et al.36 in that we used a Lungman phantom loaded with simulated pulmonary lesions instead of three normal cadavers with no inherent pathology. The inclusion of pathology provides the opportunity for a more accurate evaluation of IQ and the detection task, and it is an important factor in optimisation studies. We consider our study to have some methodological benefits when compared with De Crop et al.36 Within our work a wider range of image qualities were generated and tested compared with that by De Crop et al.36, this can be seen from the lowest value of IQFinv
in our study which was equal to 0.28 compared with 2.56 in study by De Crop et al. The range of image qualities generated in our study closely reflected those acquired in clinical practice but also included both high (IQFinv =2.39) and low (IQFinv =0.28) qualities, this was necessary to ensure
that the correlations between the IQFinv and IQ / LV were tested across a full range of different
levels of IQ. Image qualities in our study were deemed similar to those acquired in clinical practice
for several reasons. First, a group of experienced radiographers were asked to provide acquisition parameters routinely used within their clinical practice. Second, acquisitions parameters were
14
windowing and magnification. This was different to the absolute VGA system, with windowing and magnification, used in the study by De Crop et al.36 Utilising a relative VGA approach is justified because it is likely to be less biased and more sensitive in detection of subtle variations in image quality, this is due to the presence of a reference image. Although the free adjustment of image viewing parameters, such as brightness, contrast and magnification are considered part of a clinical review of an image, it could, however, influence the correlation between the IQFinv and
the IQ and LV and was not permitted within this study. A consistent image display is necessary to ensure that any measured variation in IQ results only from the imaged object and not the
adjustment of image viewing parameters such as zooming or windowing.
Geijer et al.35 investigated the influence of different tube potentials (by adjusting the mAs values to keep the effective dose constant) on IQ in lumbar spine radiography using two different phantoms, CDRAD 2.0 and the adult anthropomorphic Alderson phantom. Findings of the study by Geijer et al. 35 demonstrate that the IQ was higher for high kVp values (≥96 kVp) for both phantoms. Bacher et al.23 compared the performance of an amorphous silicon and amorphous selenium flat-panel detector using two different approaches: clinical images generated from patients and using CDRAD 2.0 phantom images. Both methods showed that the amorphous silicon flat-panel system had a lower effective dose, without any reduction of IQ when compared with that of amorphous selenium flat-panel system. However, in these two studies the correlation between the IQ from the Alderson phantom, images from patients and the IQFinv from the CDRAD
2.0 phantom were not calculated. Within mammography, the use of the CDMAM phantom is well established36–38 and there is some similarity in the evaluation of image quality with CDMAM and the methods described in this study. To our knowledge, there is no study which has investigated the correlation between the IQFinv and the LV, as a result there is no data available in the literature
to compare with our findings. The good positive correlations reported in our study (IQFinv and IQ
and LV) might also have a value in indicating the detectability of abnormality and possibly this could extend to lesion detection performance; several studies have found that there is a correlation
between pathological detectability and the visibility of normal anatomical structure39–42.
15
DRR computer simulation. The simulated clinical experiment (simulated DRR) used by Moore et al. has been successfully utilised for deriving an optimal exposure parameter for CXR examinations. Therefore, further studies could be conducted using DRRs or clinical images from patients, applying the same acquisition parameters used in our study, to investigate the validity of using the CDRAD 2.0 phantom as a measure of clinical image quality in optimisation studies. This can provide a further evidence of the validity of using the CDRAD phantom for optimisation studies.
Also, based on our findings, future work could focus on establishing a baseline IQFinv value for
CXR that identifies the threshold of LCD detectability that is required for obtaining an adequate IQ for diagnosis. The availability of such baseline measures is highly beneficial for routine quality assurance programs to ensure that the IQ is within accepted limits, and it is also beneficial for optimisation studies as it can facilitate the evaluation of how different techniques can influence IQ in clinical practice.
A limitation of our study was that the correlations between the LCD detectability and IQ and LV were only carried out using a standard size anthropomorphic phantom and the variation in phantom size were not taken into account. Anatomical noise would increase for larger patients and it was not possible to assess the effects of this within our study. A further limitation was the correlation between the LCD detectability and the LV was carried out using only one type of simulated lesions (that simulate a pulmonary nodules) and the other types (such as micronodules, lines, and reticular opacities) were not considered. Future work can be undertaken taking into account these limitations by using different anthropomorphic phantom sizes, loaded with different simulated lesions.
5. Conclusion
Based on our findings, there is an excellent correlation between LCD detectability using CDRAD 2.0 phantom and IQ. A good correlation existed between LCD detectability and LV. It can be confirmed that the CDRAD 2.0 phantom is valid for evaluating IQ and LV and could be of use in digital CXR optimisation studies. Also, our findings suggest it is possible that the CDRAD 2.0
16
References
1 H.P. Busch and K. Faulkner, Image quality and dose management in digital radiography: a
new paradigm for optimisation, Radiat. Prot. Dosimetry 117(1–3), 143–147 (2005).
2 S. Instrument, The Ionising Radiation (Medical Exposure) Regulations 2000 (2000). 3 B. Lanhede, M. Båth, S. Kheddache, et al., The influence of different technique factors on
image quality of chest radiographs as evaluated by modified CEC image quality criteria, Br. J. Radiol. 75(889), 38–49 (2002).
4 U. Redlich, C. Hoeschen, and W. Doehring, Assessment and optimisation of the image
quality of chest-radiography systems, Radiat. Prot. Dosimetry 114(1–3), 264–268 (2005).
5 J.G. Im, M.J. Chung, H.Y. Kim, et al., Detection of simulated chest lesions by using
soft-copy reading: comparison of an amorphous silicon flat-panel-detector system and a storage-phosphor system., Radiology 224(1), 242―246 (2002).
6 Y. Yano, H. Yabuuchi, N. Tanaka, et al., Detectability of simulated pulmonary nodules on
chest radiographs: Comparison between irradiation side sampling indirect flat-panel detector and computed radiography, Eur. J. Radiol. 82(11), 2050–2054 (2013).
7 C.S. Moore, T.J. Wood, A.W. Beavis, and J.R. Saunderson, Correlation of the clinical and
physical image quality in chest radiography for average adults with a computed radiography imaging system, Br. J. Radiol. 86(1027), 20130077 (2013).
8 K. Bacher, P. Smeets, K. Bonnarens, A. De Hauwere, K. Verstraete, and H. Thierens, Dose
Reduction in Patients Undergoing Chest Imaging: Digital Amorphous Silicon Flat-Panel Detector Radiography Versus Conventional Film-Screen Radiography and Phosphor-Based Computed Radiography, Am. J. Roentgenol. 181(4), 923–929 (2003).
9 H. Geijer, K.-W. Beckman, T. Andersson, and J. Persliden, Image quality vs radiation dose
for a flat-panel amorphous silicon detector: a phantom study, Eur. Radiol. 11(9), 1704–1709 (2001).
10 X.J. Rong, C.C. Shaw, X. Liu, M.R. Lemacks, and S.K. Thompson, Comparison of an
amorphous silicon/cesium iodide flat-panel digital chest radiography system with screen/film and computed radiography systems - A contrast-detail phantom study, Med. Phys. 28(11), 2328–2335 (2001).
11 W.J.H. Veldkamp, L.J.M. Kroft, M. V. Boot, B.J.A. Mertens, and J. Geleijns,
Contrast-detail evaluation and dose assessment of eight digital chest radiography systems in clinical practice, Eur. Radiol. 16(2), 333–341 (2006).
12 K. Alzimami, S. Sassi, M. Alkhorayef, A.J. Britten, and N.M. Spyrou, Optimisation of
computed radiography systems for chest imaging, Nucl. Instruments Methods Phys. Res. Sect. A Accel. Spectrometers, Detect. Assoc. Equip. 600(2), 513–518 (2009).
13 L.G. Månsson, M. Båth, and S. Mattsson, Priorities in optimisation of medical X-ray
17
14 A. Rose, The sensitivity performance of the human eye on an absolute scale., J. Opt. Soc.
Am. 38(2), 196–208 (1948).
15 M. Båth, M. Håkansson, S. Börjesson, et al., Nodule detection in digital chest radiography:
part of image background acting as pure noise, Radiat. Prot. Dosimetry 114(1–3), 102–108 (2005).
16 M. Håkansson, M. Båth, S. Börjesson, S. Kheddache, Å. Allansdotter Johnsson, and L.G.
Månsson, Nodule detection in digital chest radiography: Effect of system noise, Radiat. Prot. Dosimetry 114(1–3), 97–101 (2005).
17 E. Samei, M.J. Flynn, and W.R. Eyler, Detection of Subtle Lung Nodules: Relative
Influence of Quantum and Anatomic Noise on Chest Radiographs, Radiology 213(3), 727– 734 (1999).
18 K.M. Dewerd L.A, The Phantoms of Medical and Health Physics (Springer New York, New
York, NY, 2014).
19 M. Jessop, J.D. Thompson, J. Coward, et al., Lesion Detection Performance: Comparative
Analysis of Low-Dose CT Data of the Chest on Two Hybrid Imaging Systems, J. Nucl. Med. Technol. 43(1), 47–52 (2015).
20 van der B.R. Thijssen MAO, Bijkerk HR, Manual CDRAD-phantom type 2.0. Project
quality assurance in radiology. (1988).
21 A. De Crop, K. Bacher, T. Van Hoof, et al., Correlation of Contrast-Detail Analysis and
Clinical Image Quality Assessment in Chest Radiography with a Human Cadaver Study, Radiology 262(1), 298–304 (2012).
22 A. De Hauwere, K. Bacher, P. Smeets, K. Verstraete, and H. Thierens, Analysis of image
quality in digital chest imaging, Radiat. Prot. Dosimetry 117(1–3), 174–177 (2005).
23 K. Bacher, P. Smeets, L. Vereecken, et al., Image Quality and Radiation Dose on Digital
Chest Imaging: Comparison of Amorphous Silicon and Amorphous Selenium Flat-Panel Systems, Am. J. Roentgenol. 187(3), 630–637 (2006).
24 a Pascoal, C.P. Lawinski, I. Honey, and P. Blake, Evaluation of a software package for
automated quality assessment of contrast detail images—comparison with subjective visual assessment, Phys. Med. Biol. 50(23), 5743–5757 (2005).
25 P. Hogg, P. and Blindell, Software for image quality evaluation using a forced choice
method, in United Kingdom Radiol. Conf. (p. 139). Br. Inst. Radiol. Manchester/London, UK.(2012).
26 European Commission, European Guidelines on Quality Criteria for Diagnostic
Radiographic Images (1996).
27 W.K. Ma, P. Hogg, A. Tootell, et al., Anthropomorphic chest phantom imaging – The
potential for dose creep in computed radiography, Radiography 19(3), 207–211 (2013).
28 The Royal College of Radiologists, Picture archiving and communication systems (PACS)
18
29 E. Allen, P. Hogg, W.K. Ma, and K. Szczepura, Fact or fiction: An analysis of the 10 kVp
‘rule’ in computed radiography, Radiography 19(3), 223–227 (2013).
30 A. Field, J. Miles, and Z. Field, Discovering Statistics Using SPSS (2013).
31 J. Cohen, Statistical power analysis for the behavioral sciences.Hilsdale." NJ: Lawrence
Earlbaum Associates 2 (1988).
32 T.K. Koo and M.Y. Li, A Guideline of Selecting and Reporting Intraclass Correlation
Coefficients for Reliability Research, J. Chiropr. Med. 15(2), 155–163 (2016).
33 L. Portney and M. Watkins, Foundations of clinical research: applications to practice.New
Jersey: Prentice Hall (2000).
34 E. Samei, W. Eyler, and L. Baron, Effects of anatomical structure on signal detection, in
Handb. Med. imaging. Vol. 1. Phys. Psychophys.(2000), pp. 655–682.
35 H. Geijer and J. Persliden, Varied tube potential with constant effective dose at lumbar spine
radiography using a flat-panel digital detector, Radiat. Prot. Dosimetry 114(1–3), 240–245 (2005).
36 L.M. Warren, A. Mackenzie, J. Cooke, et al., Effect of image quality on calcification
detection in digital mammography, Med. Phys. 39(6Part1), 3202–3213 (2012).
37 A. Mackenzie, L.M. Warren, M.G. Wallis, et al., The relationship between cancer detection
in mammography and image quality measurements, Phys. Medica 32(4), 568–574 (2016).
38 A.M.F. Fausto, M.C. Lopes, M.C. de Sousa, T.A.C. Furquim, A.W. Mol, and F.G. Velasco,
Optimization of Image Quality and Dose in Digital Mammography, J. Digit. Imaging 30(2), 185–196 (2017).
39 A. Tingberg, C. Herrmann, J. Besjakov, et al., Evaluation of lumbar spine images with
added pathology, Proc. SPIE 3981, 34–42 (2000).
40 A. Tingberg, Quantifying the quality of medical X-ray images. An evaluation based on
normal anatomy for lumbar spine and chest radiography (2000).
41 P. Sund, C. Herrmann, A. Tingberg, et al., Comparison of two methods for evaluating image
quality of chest radiographs, Proc. SPIE 3981(April), 251–257 (2000).
42 A. Tingberg, M. Båth, M. Håkansson, et al., Comparison of two methods for evaluation of
the image quality of lumbar spine radiographs, Radiat. Prot. Dosimetry 90(1), 165–168 (2000).
43 C.S. Moore, G.P. Liney, A.W. Beavis, and J.R. Saunderson, A method to produce and
validate a digitally reconstructed radiograph-based computer simulation for optimisation of chest radiographs acquired with a computed radiography imaging system, Br. J. Radiol.
84(1006), 890–902 (2011).
44 C.S. Moore, G. Avery, S. Balcam, et al., Use of a digitally reconstructed radiograph-based
19
45 C.S. Moore, T.J. Wood, G. Avery, et al., Investigating the use of an antiscatter grid in chest
radiography for average adults with a computed radiography imaging system, Br. J. Radiol.
20
Appendix:
Detector dose values during imaging CDRAD 2.0 and Lungman phantoms and the values of HVL corresponding for each kVp value.
Image number
kVp mAs Grid Detector Dose (µG)
(CDRAD phantom)
Detector Dose (µG) (Lungman phantom)
HVL
1,2,3 70 1 2 3.2 No 0.79 2.04 3.59 0.35 0.95 1.68 3.46
4,5,6 80 1 2 3.2 No 1.29 3.30 5.65 0.59 1.56 2.71 3.96
7,8,9 90 1 2 3.2 No 1.94 4.80 8.20 0.91 2.30 4.01 4.34
10,11,12 100 1 2 3.2 No 2.66 6.51 11.19 1.29 3.12 5.48 4.79
13,14,15 110 1 2 3.2 No 3.46 8.47 14.55 2.12 4.52 7.24 5.25
16,17,18 120 1 2 3.2 No 4.65 10.60 17.82 2.66 5.55 8.97 5.63
19,20,21 130 1 2 3.2 No 5.65 13.16 22.28 3.29 6.83 11.05 5.87
22,23,24 70 1 2 3.2 Yes 0.13 0.30 0.50 0.07 0.18 0.28 3.46
25,26,27 80 1 2 3.2 Yes 0.24 0.53 0.85 0.14 0.32 0.51 3.96
28,29,30 90 1 2 3.2 Yes 0.38 0.82 1.32 0.24 0.51 0.82 4.34
31,32,33 100 1 2 3.2 Yes 0.54 1.18 1.89 0.35 0.76 1.20 4.79
34,35,36 110 1 2 3.2 Yes 0.79 1.61 2.59 0.49 1.05 1.73 5.25
37,38,39 120 1 2 3.2 Yes 0.99 2.06 3.37 0.67 1.39 2.23 5.63