International Journal of Emerging Technology and Advanced Engineering
Website: www.ijetae.com (ISSN 2250-2459, ISO 9001:2008 Certified Journal, Volume 7, Issue 12, December 2017)
158
Image Compression Using Empirical Wavelet Transform
Abhipriya Singh
1, K. G. Kirar
21,2
Department of E&C,SamratAshokTechnologicalInstitute,Vidisha,India Abstract—Image compression is minimizing size of graphic
file without degrading the quality of the image to the objectionable level. Different compression approaches used are lossless and lossy compression. In this paper lossy image compression is used. This paper suggests an adaptive approach for image compression based on Empirical Wavelet Transform (EWT) technique. Empirical wavelet transform builds a number of components adapted to the processed image. These components are analyzed and relevant components are chosen using threshold and compressed
image is obtained from these chosen components.
Performance parameters such as compression ratio, mean square error, peak signal to noise ratio and mean structural similarity index measure are analyzed.
Keywords— Empirical wavelet transform (EWT), Image compression, compression ratio (CR), mean square error (MSE), peak signal to noise ratio (PSNR), mean structural similarity index measure (SSIM)
I. INTRODUCTION
The challenge that multimedia communication face is to transmit the multimedia signal (image signals and video signals) through limited bandwidth channel. Image data compression techniques are concerned with the reduction of the number of bits required to store or transmit images without any appreciable loss of information. There are two compression techniques used that is lossy compression and lossless compression. In lossless compression, image is compressed and restored without any loss of information i.e. the reconstructed image is mathematically identical to the original image. In lossy compression, reconstructed image comprises degradation as compared to original image i.e. perfect recovery of image is not possible. [1][2]
Digital image is an array of various pixel values. In image, pixels of neighborhood are correlated because of which these pixels contain redundant bits. Two basic fundamentals of image compression are redundancy and irrelevancy reduction. In redundancy reduction, the duplicate signal source (image/video) is removed. In irrelevancy reduction, it omits parts of the signal that will not be noticed by the receiver. Bycompressionalgorithms, redundant bits are removed from the image and the size of image gets reduced [3].
Gourav Sharma [2] showed image compression technique employing Modified Wavelet Filter-bank using Kaiser Window. In this compressed image is compared with the original image using performance parameters like MSE, compression ratio, PSNR.
Jerome Gilles [4] developed new approach i.e Empirical Wavelet Transform (EWT) for building adaptive wavelets. It decomposes the image into its amplitude modulated – frequency modulated (AM-FM) components which are called EWT components. These AM-FM components, basically supports the fourier spectrum.
This paper is divided as follows: Section II describes the existing methods; Section III briefly explains methodology entitled and proposed algorithm; Section IV shows the experimental results and their analysis and section V gives the conclusion and major perspectives.
II. EXISTING METHODS
The digital image compression takes place in two domains such as spatial domain and frequency domain. Compression is basically applied on the frequency domain in order to achieve the best compression ratio as compared to its spatial domain counterparts [5]. Compression can be occupied anywhere in the network applications. The images which we get from the network are generally compressed using .JPEG or .GIF formats [6]. There are two types of compression techniques used: Lossy and Lossless techniques.
A. Lossless Compression
In this compression scheme, the decompressed image after compression is actually numerically identical to the original image. Basically in compression programs two things are done in sequence: firstly, it generates statistical model for the input data. Secondly, it uses this model to map input data into bit sequences in such way that the frequently encountered data will produce shorter output than the improbable information [7].
International Journal of Emerging Technology and Advanced Engineering
Website: www.ijetae.com (ISSN 2250-2459, ISO 9001:2008 Certified Journal, Volume 7, Issue 12, December 2017)
159 1) Run Length Encoding: Run length encoding is simplest image compression technique. It is useful in the case of repetitive data. In this the data is in the form of runs. The sequence of identical symbol or pixel is replaced, it is called run by shorter symbol [8]. It is the form of sequences in which the identical data values occur in successive data element and is stored as the data value in addition to count moderately than as the unique run [7]. The application where run length encoding is used is fax machine.
2) Entropy Encoding: This entropy coding firstly creates and assigns unique prefix-free code for each symbol that occurs in input. Then the entropy encoders compress the image by replacing each fixed length input symbol with the corresponding variable length prefix free output code [9].
The most common symbols uses the shortest codes.
3) Huffman Encoding: In this technique smaller bit code is given to those pixel values which occur frequently and higher bit values given to those pixel values that are repeated. This technique can reduce 10% to 50% size of file by removing irrelevant data [10]. First step in Huffman coding is to divide image into 8×8 blocks. Then each block is assigned with particular symbol and Huffman code is applied and then encoding of all blocks is done.
4) Arithmetic Coding: Arithmetic coding gives extra flexibility and better competence than Huffman coding. Arithmetic coding provides code word with perfect length [7]. It is different from other coding because rather than separating the input into particular symbols and replacing them with codes, arithmetic coding encodes entire message into single number [9].
B. Lossy Compression
In this compression scheme, the decompressed image after compression is actually numerically not identical to the original image. Compression ratio of lossy compression is better than lossless compression techniques. Some of the lossy compression techniques are briefly described below:
1) Transform Coding: In this technique the image is partitioned into sub image or blocks of small size of 8×8. Change coefficients are calculated for each block. Original 8×8 array of pixels is converted into the coefficients closer to top left corner because it contains most of the information with little perceptual distortion. Then the coefficients are quantized. Then at the decoders side reversal process is carried out. Some loss is introduced by quantizer on the encoding side which is not reversible [7].
2) Discrete Cosine Transform (DCT): This technique is applied on blocks of 8×8 or 16×16 pixels, which will convert into series of coefficients. Transform coding techniques are reversible [7]. Discrete cosine transform is orthogonal transform, which has fixed set of basis function. It is used to map the image space into frequency. The advantage of DCT is that it has capacity to reduce the blocking artifact effect, because of which the boundaries of sub images become visible [11].
III. METHODOLOGY ENTITLED A. Empirical Wavelet Transform
Empirical Wavelet [4] is transform domain technique in which the wavelet is adapted according to processed signal, hence it offers adaptibility to incoming data [12]. Its construction is quite similar to that of Band-pass filters. The empirical wavelet transform (EWT) firstly, detects fourier supports and then the corresponding wavelet is build. Now by this obtained filter bank, the input signal is filtered in order to get the different components. The scaling function and wavelet for empirical method can be formulated as given below.
Scaling Function:-
1 if |ω|≤ωn-𝜏n
1(ω)= cos[𝜋/2β(1/2𝜏(|ω|-ωn+𝜏n))] if ωn- 𝜏n ≤|ω|≤ ωn+ 𝜏n
0 otherwise (1)
Empirical Wavelet Function:-
1 if |ω|≤ωn- 𝜏n
sin[𝜋/2β(1/2𝜏(|ω|-ωn+1+ 𝜏n +1))]
if ωn+1 - 𝜏n +1 ≤|ω|≤ ωn+1+𝜏n +1
n (ω) = sin[𝜋/2β(1/2𝜏(|ω|-ωn+ 𝜏n )]
if ωn- 𝜏n ≤|ω|≤ ωn+ 𝜏n
0 otherwise (2)
B. Discrete Wavelet Transform
International Journal of Emerging Technology and Advanced Engineering
Website: www.ijetae.com (ISSN 2250-2459, ISO 9001:2008 Certified Journal, Volume 7, Issue 12, December 2017)
160
In DWT image is firstly digitized because digitized image can be easily characterized by its intensity levels. Then the image is decomposed into sequence of wavelet coefficients. Then any wavelet whose fixed value falls below the tolerance is set to zero, this is called thresholding. Then quantization is performed. It converts the sequence of floating numbers to sequence of integers. Quantization introduces error to the process because of which it is called lossy. Finally entropy encoding is applied [13].
C. Proposed Algorithm
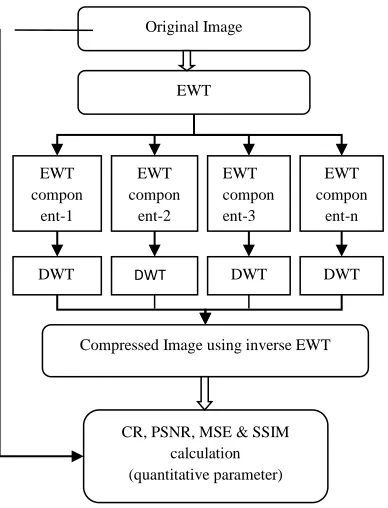
[image:3.612.70.264.427.681.2]Wavelets are useful mathematical tool which are can be efficiently used for image processing. 2D Empirical wavelet transform [14] provides a better approach for adaptive representation in which the basis is generated according to the information contained in the image itself. It consists of three main steps: first, detects the Fourier supports, secondly, build the corresponding wavelet according to those supports and at last, filters the input signal with the constructed filter bank to get different components. DWT is applied on each EWT component using haar wavelet. Compressed image is obtained by reconstruction. Different performance parameters like CR, PSNR, MSE and MSSIM are calculated.
Fig 1 . Flow diagram of implementation of EWT for image compression
IV. EXPERIMENTAL RESULTS AND ANALYSIS
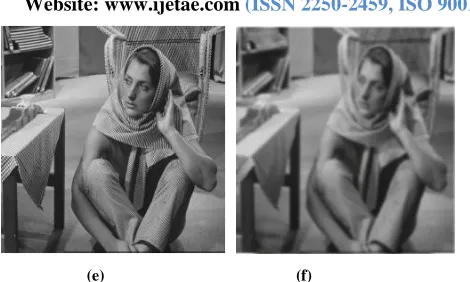
To perform these experiments, MATLAB R2016a software is used for simulation. System specifications are HP Windows-7, 64 bit operating system with Intel core i3 500 5U CPU @2.00GHz processor containing 4GB of RAM. Tests are performed on the various test images like Barbara, cameraman and lena of size 512x512.
Image is decomposed using EWT. Then EWT components are extracted, on these extracted components DWT is applied using haar wavelet. Then compressed image is obtained using inverse EWT. Then various performance parameters are calculated.
In fig.1, complete process of image compression using EWT is explained. Table 1, shows the comparison between the results of image compression using modified filter bank [2] and EWT. Original image and compressed image of lena, cameraman and Barbara are shown in fig 2.
Fig. 3 and fig. 4 shows the comparison graphs for PSNR and CR% of modified filter bank and EWT. Results of image compression using EWT are mentioned in table 2.
(a) (b)
(c) (d)
Original Image
EWT
EWT compon
ent-1
EWT compon
ent-2
EWT compon ent-3
EWT compon
ent-n
Compressed Image using inverse EWT
CR, PSNR, MSE & SSIM calculation (quantitative parameter)
International Journal of Emerging Technology and Advanced Engineering
Website: www.ijetae.com (ISSN 2250-2459, ISO 9001:2008 Certified Journal, Volume 7, Issue 12, December 2017)
161
(e) (f)
Fig. 2 (a) Lena original image, (b) lena compressed image, (c) cameraman original image, (d) cameraman compressed image, (e)
barbara original image, (f) barbara compressed image
A. Performance Parameters
Measures used for quantifying the error between images are defined as follows:
1. Compression Ratio (CR): Number of bits required to represent original image to number bits required to represent compressed image is called compression ratio. Increase in compression ratio decreases the quality of compressed image.
= ( 1) ( )
(3)
TABLE 1
COMPARISON OF RESULTS OF MODIFIED FILTER BANK AND EWT
Image Performance Parameter
PSNR CR%
Modified Filter Bank
EWT Method
Modified Filter Bank
EWT Method
Barbara 39.70 54.6758 5.85 9.6
Cameraman 39.38 53.5446 9.19 9.6
[image:4.612.51.286.127.268.2]Lena 43.55 53.8161 9.57 9.6
Fig 3. Comparison graph of modified fiter bank and EWT for PSNR
2. Mean Square Error (MSE): MSE is cumulative squared error between original image and compressed image
MSE = ∑(Ŷi-Yi)2 (4) Eq. (4) is for calculating MSE. Where, i is original
image and Yi is compressed image.
3. Peak Signal Noise Ratio (PSNR): Basically, PSNR is ratio of maximum power of signal to the power of unnecessary distorting noise. Here, signal is original image and noise is MSE in reconstruction [2]. Increase in PSNR results in decrease in compression ratio. Eq. (5) is used for calculating PSNR.
PSNR = 10log10 (Max2 /MSE) (5) 4. Structural Similarity Index Measure (SSIM)
SSIM = ( )( ) ( ) ( )
(6) Equation(6) is used to calculate SSIM
39.7 39.38 43.55
54.67 53.54 53.81
Barbara Cameraman Lena
P
SNR
Image Name
[image:4.612.322.563.138.320.2]International Journal of Emerging Technology and Advanced Engineering
Website: www.ijetae.com (ISSN 2250-2459, ISO 9001:2008 Certified Journal, Volume 7, Issue 12, December 2017)
[image:5.612.47.290.126.320.2]162
Fig 4. Comparison graph of modified filter bank and EWT for CR%
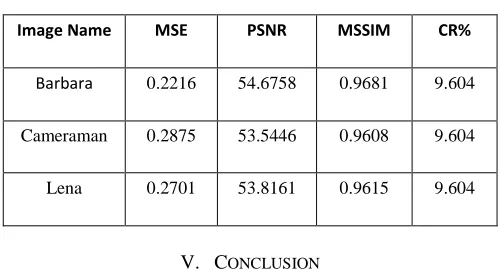
TABLE 2
RESULTS OF IMAGE COMPRESSION USING EWT
Image Name MSE PSNR MSSIM CR%
Barbara 0.2216 54.6758 0.9681 9.604
Cameraman 0.2875 53.5446 0.9608 9.604
Lena 0.2701 53.8161 0.9615 9.604
V. CONCLUSION
In this paper a new approach has been proposed for compression of an image. This paper presented the EWT method for compression of different images. In this paper, EWT has been explained and experiments were performed for different grayscale images. Results are shown in tables according to which EWT gives better MSE, PSNR and CR% than modified filter bank[3]. In future, this method can be used for image compression of color images.
Acknowledgement
The author acknowledges all the staff members of Electronics and Communication Engineering, Samrat Ashok Technological Institute for their support for fulfilling this work and their valuable comments for improving this paper.
REFERENCES
[1] R.C. Gonzalez and R.E. Woods (2004), Digital Image Processing, 2nd Ed., Prentice Hall
[2] Gaurav Sharma, A Novel Image Compression Techniques Using Modified Filter Bank, International journal of current engineering and technology, Vol.5, No.5 (0ct 2015)
[3] Sachin Dhawan, A review of image compression and comparison of its algorithm, International Jounal of Electronics and Communication Technology, vol. 2, Issue 1, March 2011
[4] Jérôme Gilles, Empirical Wavelet Transform, IEEE TRANSACTIONS ON SIGNAL PROCESSING, Vol.16, No.16, AUGUST 15, 2013
[5] K. Sayood , Introduction to data compression, 4th revised Edn. Los Altos, CA: Morgan Kaufmann publisher (2012)
[6] S. Anantha Babu, P. Eswaran, C. Senthil Kumar, Lossless compression algorithm using improved RLC for grayscale image, Springer,11 march 2016
[7] D. Meenakshi, Literature review of image compression techniques, International Journal of Computer Science and Engineering Technology, vol.6, No.05 May 2015
[8] Er. Shilpa Sachdeva, A review on digital image compression techniques, International Journal of Recent and Innovation Trends in Computing and Communication, vol.2, issue 7
[9] Neelam, Ashu Bansal, Image compression a learning approach: survey, International Journal of Computer Science Trends and technology, volume 2, issue 4, jul-aug 2014
[10] Mr. chandresh K Parmar, Prof. Kruti Pancholi, A review on image compression techniques, Journal of information, knowledge and research in electrical engineering , volume 02, issue 02, October 2013
[11] Randall C. Reiningek, Jerry D. Gibson, Distribution of the two dimensional DCT coefficients for images, IEEE transactions on communications, vol. 31 ,issue 6, june 1983
[12] Deepthy Johny, Reshma M, Dimensionality Reduction of Images with Empirical Wavelet Transform and Householder Transform, IJSRD - International Journal for Scientific Research & Development, Vol. 3, Issue 03, 2015 , ISSN (online): 2321-0613 [13] Neha Pandey, Himani Agrawal, Hybrid image compression based on
fuzzy logic technology, International Journal of Science,Engineering and Technology, volume 3, issue 9, September 2014
[14] Jerome Gilles and Giang Tran and Stanley Osher, 2D Empirical transforms: Wavelets, Ridgelets and Curvelets revisited, SIAM J. IMAGING SCIENCES, vol.7, No. 1, 157-186,2014
5.85
9.19 9.57
9.6 9.6 9.6
Barbara Lena
CR
%
Image Name
[image:5.612.43.294.365.500.2]