International Journal of Emerging Technology and Advanced Engineering
Website: www.ijetae.com (ISSN 2250-2459,ISO 9001:2008 Certified Journal, Volume 3, Issue 9, September 2013)
182
A Robust Method for Processing Speech in Cell Phone
Communication
I. Neelesh
1, J. Sravani
2, P. S. S. Sashank
3 ECE Department, Gitam University, VishakapatnamAbstract— In this paper we designed a robust method for
processing of speech in cellphone communication using linear predictive analysis and synthesis. A set of speech parameters such as pitch, gain and prediction filter coefficients are computed for every 30ms of input speech and transmitted to the receiver. At the receiver speech is produced using the transmitted parameters .Linear predictive synthesis at the receiver is performed with original fundamental frequency or pitch. Pitch at the transmitter is estimated using Cepstrum method .We implemented the method on speech samples of both male and female speaker and showed that the method is robust. Both subjective and objective analyses are performed on experimental results.
Keywords—LPC- Linear predictive analysis and synthesis, auto-regressive model, pitch, Cepstrum, speech, and excitation.
I. INTRODUCTION
Cellphones which have become ubiquitous are a marvel of technology. Only few people realize that hundreds of millions of operations per second are performed by these small handled devices. Linear Predictive analysis plays a crucial role in transmission of speech. In this paper we designed a robust method for speech processing in cellphone communication. Input speech is segmented into frames each of 30ms duration. For each frame LPC analysis is performed and a set of linear predictive coefficients are calculated. Pitch is estimated on frame by frame basis using Cepstrum method.
Thus a set of speech model parameters are calculated and transmitted to the receiver. At the receiver excitation is generated based on the pitch estimated. Linear predictive synthesis at the receiver is performed with original fundamental frequency or pitch. The method is implemented on speech samples of both male and female speaker and the results are presented. Both subjective and objective analyses are performed and the results are discussed.
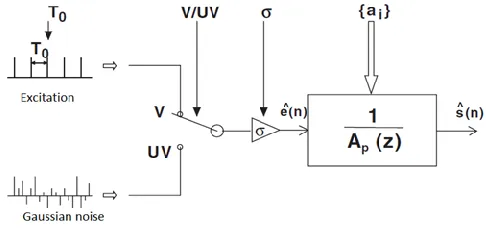
II. LINEAR PREDICTION ANALYSIS AND SYNTHESIS FILTER Linear prediction served as the main stay of speech communications for several decades.
It depends upon several speech characteristics which are derived from the fact that speech is produced by modification of excitation generated by glottis, based on resonances produced by different shapes of vocal, nasal and pharyngeal tracts. Linear prediction models are often referred as auto regressive (AR) processes. Auto regressive model or LP model of speech production describes speech s(n) as the output s^(n) of an all pole filter [1/ (z)] excited by e^(n).
Where and are the z transformations of the speech and the excitation signal. P is the prediction order
.
III.
[image:1.612.331.574.446.561.2]IV. 3 SECTIONS
Figure 1: Linear Predictive model of speech
International Journal of Emerging Technology and Advanced Engineering
Website: www.ijetae.com (ISSN 2250-2459,ISO 9001:2008 Certified Journal, Volume 3, Issue 9, September 2013)
183 The figure shown below describes a linear predictive analysis filter which is also called as inverse filter.
The inverse filter removes all the vocal tract information from speech s(n) and produces a prediction residual e(n).The prediction residual e(n) is given by
III. PITCH ESTIMATION VIA CEPSTRUM METHOD Pitch estimation is one of the most important issues of speech processing. There are a variety of ways to estimate pitch. Pitch in our method is estimated by using cepstral analysis. Cepstrum is obtained by inverse Fourier transform of logarithm of the Fourier transform of the original signal. Speech can be assumed as convolution of excitation e(n) with the vocal tract’s discrete impulse response i;e S(n)=e(n)* . By applying Fourier transform convolution in time domain can be converted as multiplication in frequency domain. Then logarithmic property can be used to transform multiplicative relationship into an additive one. Finally by applying inverse Fourier transform we can estimate pitch from the obtained real Cepstrum.
Thus Fourier analysis of logarithmic amplitude spectrum gives Cepstrum. Cepstrum shows a huge dc peak corresponding to spacing between the harmonics. The amplitude of Cepstrum is plotted against quefrency and peaks in Cepstrum which are related to periodicities in spectrum are known as rahmonics.
IV. EXPERIMENTAL RESULTS AND DISCUSSION
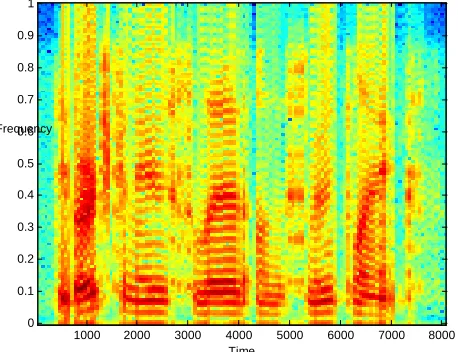
In this section experimental results are presented and discussed. We considered speech signals of both male and female speakers sampled at 8khz.Figure 3.1 and 3.2 shows pitch estimated for a speech sample using Cepstrum method. Figures 4.1, 4.2, 4.3 and 4.5 show the original and the synthesized speech of male speaker along with their spectrograms. Similarly figures 5.1, 5.2, 5.3 and 5.4 show the original and the synthesized speech of female speaker along with their spectrograms
Figure 3.1: Speech Sample
0 50 100 150 200 250
International Journal of Emerging Technology and Advanced Engineering
Website: www.ijetae.com (ISSN 2250-2459,ISO 9001:2008 Certified Journal, Volume 3, Issue 9, September 2013)
184 Figure 3.2 Cepstrum of speech sample. Pitch frequency=
145.4545Hz
Figure 4.1: Original speech of the male speaker
Figure 4.2: Spectrogram of the original speech signal
`
Figure 4.3: Synthesized male speech signal
0 20 40 60 80 100 120
-0.15 -0.1 -0.05 0 0.05 0.1 0.15 0.2 0.25 0.3
0 0.5 1 1.5 2 2.5
x 104 -0.3
-0.2 -0.1 0 0.1 0.2 0.3 0.4
original speech
Time Frequency
1000 2000 3000 4000 50006000 7000 8000 9000 1000011000
0 0.1 0.2 0.3 0.4 0.5 0.6 0.7 0.8 0.9 1
0 2000 4000 6000 8000 10000 12000 14000 16000 18000
-0.3 -0.2 -0.1 0 0.1 0.2 0.3 0.4
International Journal of Emerging Technology and Advanced Engineering
Website: www.ijetae.com (ISSN 2250-2459,ISO 9001:2008 Certified Journal, Volume 3, Issue 9, September 2013)
185 Figure 4.4: Spectrogram of the synthesized male speech signal
Figure 5.1: Original speech sample
Figure 5.2: Spectrogram of original speech
Figure 5.3: Synthesized female speech signal Time
Frequency
1000 2000 3000 4000 5000 6000 7000 8000
0 0.1 0.2 0.3 0.4 0.5 0.6 0.7 0.8 0.9 1
0 0.2 0.4 0.6 0.8 1 1.2 1.4 1.6 1.8 2
x 104 -0.4
-0.3 -0.2 -0.1 0 0.1 0.2 0.3 0.4 0.5
original speech
Time Frequency
1000 2000 3000 4000 5000 6000 7000 8000 9000
0 0.1 0.2 0.3 0.4 0.5 0.6 0.7 0.8 0.9 1
0 2000 4000 6000 8000 10000 12000 14000 16000
-0.8 -0.6 -0.4 -0.2 0 0.2 0.4 0.6 0.8 1
[image:4.612.82.573.139.537.2] [image:4.612.330.566.144.533.2] [image:4.612.64.293.149.325.2]International Journal of Emerging Technology and Advanced Engineering
Website: www.ijetae.com (ISSN 2250-2459,ISO 9001:2008 Certified Journal, Volume 3, Issue 9, September 2013)
186 Figure 5.4: Spectrogram of the synthesized female speech
From the above results we can observe that the synthesized speech almost resembles the original speech. Subjective analysis is also performed and confirmed that the synthesized speech almost sounds exactly like the original speech with slight hissing.
V. CONCLUSION
In this paper we designed a robust method for processing speech in cellphone communication using linear predictive analysis.
We implemented this method on speech samples of both male and female speakers and results are presented. The obtained results show that the synthesized speech is almost similar to the original speech. Both subjective and objective analyses are performed and showed that the proposed method is robust.
REFERENCES
[1 ] Atal, B., & Remde, J. (1982, May). A new model of LPC excitation
for producing natural-sounding speech at low bit rates. In Acoustics, Speech, and Signal Processing, IEEE International Conference on ICASSP'82. (Vol. 7, pp. 614-617). IEEE.
[2 ] Boersma, P. (1993). Accurate short-term analysis of the fundamental
frequency and the harmonics-to-noise ratio of a sampled sound. In Proceedings of the institute of phonetic sciences (Vol. 17, No. 1193, pp. 97-110).
[3 ] Dutoit, T., Moreau, N., & Kroon, P. (2009). How is speech
processed in a cell phone conversation?. In Applied Signal Processing (pp. 1-31). Springer US.
[4 ] Ahmadi, S., & Spanias, A. S. (1999). Cepstrum-based pitch
detection using a new statistical V/UV classification
algorithm. Speech and Audio Processing, IEEE Transactions on, 7(3), 333-338.
[5 ] Markel, J. E., & Gray, A. H. (1982). Linear prediction of speech. Springer-Verlag New York, Inc..
Time Frequency
1000 2000 3000 4000 5000 6000 7000