A COMPARATIVE ANALYSIS OF TERRESTRIAL
LASER SCANNING (TLS) AND STRUCTURE FROM
MOTION (SfM) PHOTOGRAMMETRY FOR
MEASURING FLUVIAL SEDIMENTS
Contents
List of Figures iii
List of Tables iv
Acknowledgements v
Declaration vi
Abstract vii
Chapter 1 Introduction
1.1. River Restoration and The European Water Framework Directive
1
1.2. Key Drivers for Weir Removal-‐based River Restoration 3 1.3. Shortfalls in Contemporary Monitoring and Appraisal
Practices
4
1.4. Potential for Remote Sensing and Computer Modeling as River Restoration Appraisal Methods
5
1.5. Roughness Elements of Rivers and the Quantification of Grain Size Distribution
7
1.6. Aims and Objectives of Thesis 10
1.7. Motivation 11
1.8. Thesis Layout 12
Chapter 2 Literature Review
2.1. Natural Hydromorphologic Processes of Gravel-‐Bed Streams 15 2.2. River Regulation and its Impacts upon Natural
Hydromorphic Processes and River Ecology
21
2.3. Process-‐based River Restoration 25
2.4. Emergence of the Digital Elevation Model and its Application in River Science
27
Chapter 3 Study Site and Background
3.1. Introduction 33
3.2. The River Irwell Catchment Backgound 35
3.3. The River Roch Study Area 36
Chapter 4 Methods
4.1. Introduction 38
4.2. Pebble Counts 41
4.3. Data Acquisition 42
4.4. Post-‐Processing 44
4.5 Grain-‐Size Analysis 48
Chapter 5 Results
5.1. Introduction 52
5.2. Grain-‐Size Analysis 53
5.3. Geostatistical Analysis 58
Chapter 6 Discussion
6.1. Introduction 64
6.2 Issues Surrounding Traditional Methods of Quantifying Grain-‐Size
64
6.3. Terrestrial Laser Scanning for Informing Grain-‐Size
Distribution and Identifying Homogeneous Sediment Facies 66
6.4. SfM-‐Photogrammetry for Informing Grain-‐Size Distribution and Identifying Homogeneous Sediment Facies
67
6.5. Comparative Analysis of SfM-‐photogrammetry-‐ and Terrestrial Laser Scanning-‐derived Sediment Data
71
6.6. Practical Application of SfM and its Benefit in River Restoration, Hydrogeomorphic Modeling and Habitat Assessment
73
Chapter 7 Conclusion
7.1. Introduction 75
7.2. Structure from Motion Photogrammetry for Informing Sediment Grain-‐Size Distribution
75
7.3. SfM-‐Photogrammetry and its relevance in Fluvial Geomorphology
76
7.4. SfM-‐Photogrammetry as a New, Low-‐Cost, High Accuracy Method of River Restoration Monitoring
77
7.5. Limitations 78
7.6. Future Recommendations 80
References 81
List of Figures
Figure 1.1 Planning and Implementation of river restoration schemes. 2 Figure 1.2 Spatial and temporal scale of remote sensing methods. 6
Figure 1.3 Thesis layout. 14
Figure 2.1 Modes of sediment transport. 17
Figure 3.1 The River Irwell catchment. 34
Figure 3.2 Characteristics of The Irwell catchment. 36
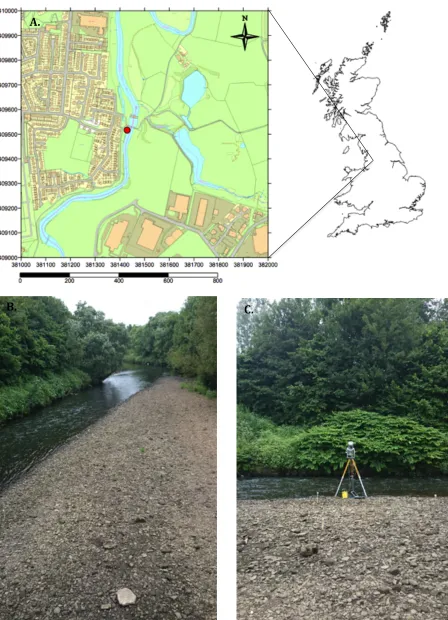
Figure 3.3a Study site location. 37
Figure 3.3b Sampled sediment bar. 37
Figure 3.3c TLS and retro reflectors. 37
Figure 4.1 Differences in sediment size-‐class. 39
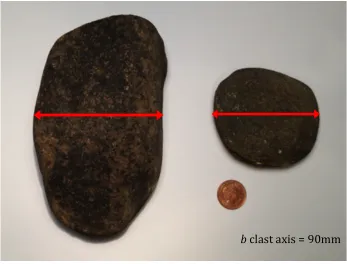
Figure 4.2 A, B and C clast axes. 42
Figure 4.3 SfM-‐photogrammetry shooting scenario. 44
Figure 4.4 Raw Point-‐cloud data derived from TLS and SfM 45
Figure 4.5 SfM workflow. 47
Figure 4.6 Isolated regions used to assess internal consistency. 51
Figure 5.1 Wolman frequency distribution curve. 53
Figure 5.2 Frequency distribution curve drawn from a,b,c clast axis data. 54 Figure 5.3 Sediment grain-‐size distribution derived from SfM and TLS. 55 Figure 5.4 Empirical relations between TLS, SfM and a-‐, b-‐, and c-‐clast data 57 Figure 5.5 Elevation map of SfM and TLS data. 58 Figure 5.6 Omni-‐directional variograms for SfM-‐ (blue line) and TLS-‐derived
sediment data.
60
Figure 5.7 Diagrammatic representations of 360° omni-‐directional variograms derived from A) SfM; and B) TLS data.
61
Figure 5.8 Empirical relation between percentile data attained from each remote sensing method.
62
Figure 5.9 Direct comparisons of TLS-‐ and SfM-‐derived sediment distribution for the five isolated regions .
63
Figure 6.1 Configuration of river sediments. 66
List of Tables
Table 1.1 Thesis Aims and Objectives. 11
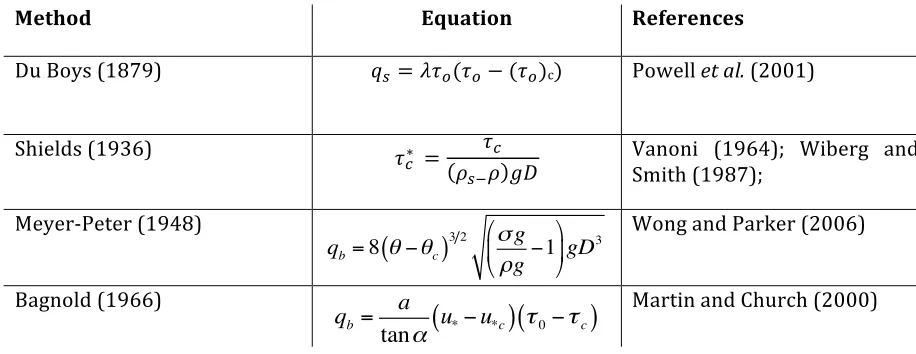
Table 2.1 Common Sediment Transport Equations. 18
Table 2.2 Principles of River Restoration. 25
Table 2.3 Overview of LiDAR-‐related journal articles. 28 Table 5.1 Percentile data derived from Wolman counts. Size classes are based on
Wentworth’s (1922) scale. 53
Table 5.2 Percentile data from A, B, C clast axis counts. 54 Table 5.3 Percentile data derived from SfM and TLS. The difference between
each data set is provided.
56
Table 5.4 Univariate statistics drawn from each remote sensing method. 59 Table 5.5 Percentile data derived from the five random, isolated regions from
Acknowledgements
I wish to extend my warmest appreciations to Dr. Neil Entwistle for his patient support,
sound academic advice, and expert assistance both during the fieldwork phase and
during the write-‐up phase throughout this endeavor. In addition, I would like to thank
Philip Pasco for being an abled and extremely helpful assistant during data collecting. I
also thank my long-‐suffering Girlfriend Jo Burton, who has tolerated another two-‐years
of me being an irritable, penniless student; and my friends and family, all of whom have
been great sources of encouragement and support.
Thank you.
Declaration
I certify that this thesis consist of my own original work. All quotations from published and unpublished sources are acknowledged as such in the text. Material derived from other sources is also indicated.
Total number of words in main text: 17,705
Name __________________________________
Signature________________________________
Date____________________________________
Abstract
Chapter 1: Introduction
1.1. River Restoration and The European Water Framework Directive
Hydrogeomorphic impacts of man-‐made hydraulic structures on the streams in which they reside are poorly understood and seldom quantified. In addition, morphological channel response following river restoration procedures has rarely been monitored to a reasonable standard, both as a consequence of insufficient data acquisition, and unsatisfactory timeframes over which data is collected. However, over the last decade, advent of the European Water Framework Directive (WFD) (European Commission, 2000) has provided impetus to restore rivers and monitor their subsequent ecological and hydromorphological response; hence, a requirement for accurate monitoring is necessary to demonstrate adequate completion of WFD aims and objectives (Skinner and Bruce-‐Burges, 2005).
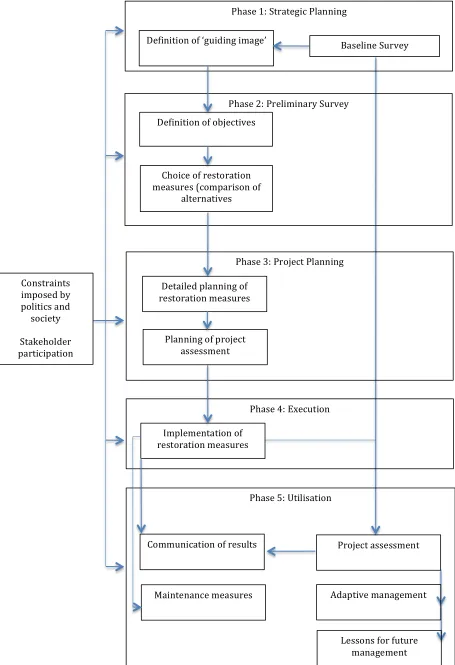
Effective river restoration monitoring under guidance of the WFD relies on identification of a set of parameters relating to, for example, geomorphological, hydrological, and ecological objectives (England et al., 2008). In order to more satisfactorily encompass interactions between hydrologic and geomorphic fluvial processes, the concept of ‘hydromorphology’ (European Commission 2000; Newson and Large, 2006) was introduced in order to better assess physical habitat quality (England et al., 2008; Orr et al., 2008). Thus, linkages between physical and ecological components of rivers are brought together by holistic management practices and common objectives of a wide array of practitioners of varying disciplines (Vaughn et al., 2009) (Figure 1.1.) The result of this is an arrangement whereby a ‘good ecological status’ or, in instances where a water body is classed as ‘heavily modified’, ‘good ecological potential’ is sought.
Baseline Survey Definition of ‘guiding image’
Definition of objectives
Choice of restoration measures (comparison of
alternatives
Constraints imposed by politics and society
Stakeholder participation
Phase 1: Strategic Planning
Phase 2: Preliminary Survey
Phase 3: Project Planning
Detailed planning of restoration measures
Planning of project assessment
Phase 4: Execution
Implementation of restoration measures
Phase 5: Utilisation
Communication of results
Maintenance measures
Project assessment
Adaptive management
Lessons for future management
[image:10.595.69.524.67.732.2]1.2. Key Drivers for Weir Removal-‐based River Restoration
There are a number of primary benefits of employing complete weir removal as a technique for river restoration. Fundamentally, such measures are applied in order to improve upstream and downstream ecological and hydrological longitudinal connectivity in streams that have been regulated by man-‐made structures. This may be displayed as benefits to a plethora of aquatic organisms, which are able to readily migrate and disperse throughout a river both as populations or individuals.
Additionally, removal of a barrier almost instantly restores natural sediment transport processes by initiating redistribution of impounded material. This eventually leads to complex, heterogeneous assemblages of habitat types, which further enhances biological functionality of streams. Moreover, as channel adjustment is initiated following barrier removal, a natural regimen of erosion and deposition is established, thus satisfying a range of criteria set out by the Water Framework Directive.
There are additional, anthropogenically-‐oriented benefits to removing weirs, most notably in the form of social and economic factors delivered in compliance of Ecosystem Services (a full and comprehensive overview of which can be found in Maltby et al. (2011)). Essentially, however, restoration by weir removal may contribute to the aesthetics of a river reach, in addition to general improvement of fauna and flora and potential for recreation. Moreover, reestablishing natural river processes may also reduce the risk of flooding, particularly as climatic changes further exacerbate extreme hydrologic events; thus, simply by removing an obsolete, outdated structure, a wide range of benefits can be achieved at relatively low cost and subsequent maintenance.
1.3. Shortfalls in Contemporary Monitoring and Appraisal Practices
Post-‐scheme monitoring and appraisal is integral to the success of river restoration (Skinner and Bruce-‐Burgess, 2005; Bernhardt et al., 2007; England, 2008). Many projects, despite their increasing prevalence in the UK, fail to include sufficient evaluation methods that assess whether or not their objectives have been met (Wohl, 2005). Indeed, England (2008) identifies that many schemes are somewhat lacking precisely because their core objectives are not adequately outlined in the early stages of planning, and are thus destined to fail where monitoring is concerned. Furthermore, instances where monitoring has taken place, yet yielded results that may not correspond with initial aims, are rarely published. Morandi et al. (2014) found a lack of post-‐ restoration feedback from French river restoration projects, particularly where communication of pre-‐ and post-‐restoration references (i.e., biological metrics – such as floara and fauna survey data; and physical metrics – such as hydromorphology survey data). This is perhaps, in part, due to involvement of multiple stakeholders and pressure to maintain Good Ecological Status in compliance with government mandates.
Nevertheless, many river restoration schemes comprise a range of elements that have in some way been replicated elsewhere. It is therefore critical that results of successes and failings are shared among the river restoration community in order to: a) better understand river processes following remedial engineering; b) facilitate vital communication between practitioners, whose results can be compared; and c) maintain Good Ecological Status once achieved. Further, successful appraisal must encompass a wide-‐range of parameters in order to fully assess post-‐restoration developments. However, such appraisals must be implemented under adaptive management, defined by Kondolf and Downs (2002) as ‘arguably the most suitable conceptual framework for planning restoration schemes’. River restoration should not be implemented in an ‘all or nothing’ approach (Palmer et al., 2005) but rather as a set of adjustable milestones, realised through synthesis of quantified scientific observation (e.g., Florsheim et al., 2005).
1.4. Potential for Remote Sensing and Computer Modelling as River Restoration Appraisal Methods
Remote Sensing
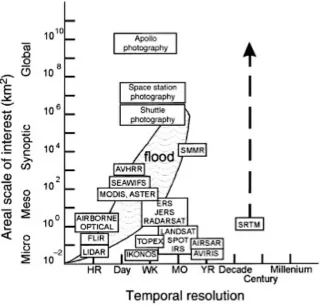
Various remote sensing techniques for evaluating natural river phenomena have emerged as a vital component in many riverine studies (Metres, 2002). Many such methods have existed since the launch of NASA’s LandSat mission in 1972 (See Kirk 1982; Dekker et al., 1997; Mertes et al., 2002), leading to significant advancements in the exploitation of physical properties of light for informing various parameters of a variety of natural phenomena. However, space-‐borne instruments are limited in their spatial resolution in that only relatively large areas can be observed (Figure 1.2), and therfore, for the most part, cannot match spatial resolutions achieved by aerial-‐ and terrestrial-‐ based instruments.
Perhaps the most significant recent development in fluvial remote sensing is the advent of LiDAR (Light Detection And Ranging). Both aerially (Bowen and Waltermire, 2002; Charlton et al., 2003; Jones et al., 2007; Cavalli et al., 2008; Vetter et al., 2011) and terrestrially (Heritage and Hetherington, 2007; Entwistle and Fuller, 2009; Hodge et al., 2009; Milan et al., 2011; O’Neil and Pizzuto, 2011; Smith et al., 2011) deployed LiDAR instruments have yielded excellent results, each offering their own particular advantages. Aerial LiDAR, for instance, provides highly accurate topographical data at spatial resolutions significantly greater (sub-‐metre) than that offered by space-‐borne instruments; however, it cannot provide the very high resolutions attained by terrestrial LiDAR.
TLS methods have, historically, been employed in favour of more conventional techniques given the precision and accuracy offered by such instruments. However, recent developments in computer software have allowed for production of fine-‐scale digital elevation models (DEMs) similar to those derived from LiDAR, using conventional digital cameras. So-‐called Setructure from Motion (SfM) photogrammetry techniques have potential to instigate a new era in remote sensing, where traditional constraints, such as cost and specialised training, are no longer limiting factors for many river science applications. This thesis will encompass both TLS and Structure from Motion methods in a comparative, proof-‐of-‐concept quantitative study of grain size. For this reason, a patch-‐scale approach was selected in order to reduce time expenditure during data acquisition, post-‐processing, and analysis.
Figure 1.2 Spatial and temporal scale of a range of remote sensing apparatus employed in riverine studies. After Mertes (2002).
[image:14.595.153.477.328.634.2]1.5. Roughness Elements of Rivers and the Quantification of Grain Size Distribution
The textural characteristics of river bedforms is important in controlling near-‐bed hydraulics, flow resistance and grain particle motion (Nikora et al., 1998), and are defined by interactions between hydraulic roughness, flow parameters and sediment supply (Van Rijn, 1984). Quantification of bed roughness and its interrelationship with river flow is a fundamental element of hydraulic engineering and river restoration design, both as a physical, channel-‐forming component, as well as one that has important implications for aquatic ecology and habitat. However, bedforms are highly dynamic, moveable features, comprised of a complex arrangement of particle shapes and sizes, which are shaped and worked into an infinite configuration of packing, orientation, sorting and clusters, which, are therefore difficult to quantify.
Central to the formation of complex beforms is flow velocity and flow resistance, described by Knighton (1998. p, 101) as, ‘one of the most important elements in the interaction between the fluid flow and the channel boundary’. For the purposes of this thesis, it is necessary to focus on ‘boundary resistance’, that is, friction created by bed morphology (Lawless and Robert, 2001), where, in streams whose bed is comprised of gravels and cobbles (i.e., particles ranging from 2 – 64mm and 64 – 256mm respectively), is derived from the shape and configuration of particles (Richards, 1982. p, 17), in addition to sediment size distribution.
Advancements in aforementioned remote sensing – namely, Terrestrial Laser Scanning – has offered perhaps the most substantial and influential recent shift in the ways in which grain size distribution is measured, providing a means of highly accurate grain size calculation with the exclusion of obstructive limitations associated with labor-‐ intensive manual counting. A particularly beneficial advantage of TLS is that it is able to rapidly gather sub-‐cm topographic data over relatively large areas, thus illuminating the need for any strenuous manual surveying. Nevertheless, despite its success in topographic surveying, TLS at present is extremely financially expensive, with the cost of scanners being in the order of £100,000. Moreover, specialist training is required to operate such devices, and post-‐processing can be extensive and often requires considerable computing power.
More recently, modern photogrammetric techniques have allowed for acquisition of high-‐resolution topographic data. So-‐called Structure from Motion (SfM) photogrammetry derives reconstructed three-‐dimensional geometry through identification of conjugate points within two-‐dimensional digital images. Though the software packages that facilitate this technique are relatively new (for example, Autodesk 123D Catch; Microsoft Photosynth; VisualSFM; Photomodeler and, in this instance, AgiSoft PhotoScan Pro), the mathematical principles on which photogrammetric Structure From Motion derives its models has been in existence since the middle of the 20th Century, and, through extensive research and development, have
evolved over the decades to eventually produce the aforementioned programs (Micheletti et al. 2015).
A primary benefit of SfM-‐photogrammetry is that the associated software performs the three-‐dimensional reconstruction process automatically: very little user training (compared to other techniques, for instance TLS and traditional photogrammetry) is required to produce a suitably accurate topographic model. The automated workflow – that is, image preparation; photo alignment; dense point-‐cloud construction; georeferencing; mesh construction; and DEM construction (see section 4.4) – is extremely intuitive, and the forgiving nature of SfM software means that processing is carried out with relative ease and efficiency. Whilst the georeferencing element of the SfM workflow is not essential for producing a representative model, fully georeferenced ground control points (GCPs), which are easily identifiable in each image, must be included in order to provide scale – which is essential if quantitative measurements are to be extracted from SfM-‐derived data (Micheletti et al., 2015).
The final product of fully georeferenced SfM output data allows for full quantification of topography to the user’s exact specifications, as one would with a model produced by aerial or terrestrial laser scanned data. Indeed, data produced by SfM-‐photogrammetry would be very familiar to anyone with experience of handling laser-‐derived topographic models. This is an important element of this study, whose main intention is to remotely and quantifiably characterise sediment characteristics of dry gravel.
Attaining sediment grain distribution, however, is particularly problematic. Commonly employed, traditional methods (e.g., Woman, 1954) require sampling of 100 randomly selected grain particles, from which a range of sediment size percentiles (16, 50, 84, and 99%, for example) can be derived. Though this technique is a ubiquitous feature of many geomorphic investigations, there are a number of fundamental shortcomings that have potential to yield erroneous data. Attempts have been made to eradicate such limitations: Leopold (1970), for instance, proposed a method whereby size frequency is obtained via a size-‐to-‐weight conversion in order illuminate bias towards larger particles during sampling. However, this technique is extremely laborious with similarly poor spatial coverage and insufficient sample size associated with that of the Wolman (1954) technique.
In addition, sediment features are often heterogeneous in form, comprising of many particle shapes and sizes, which are arranged in various configurations (e.g., amouring and imbrication) depending on the prevailing conditions. However, Buffington and Montgomery (1999b) demonstrate that gravel features are also commonly made up of homogenous patches or ‘facies’, ‘distinguished by from one another by differences in grain size and sorting’.
1.6. Aims and Objectives of Thesis
Given that there are a number of shortfalls in the understanding of geomorphological channel modification following barrier removal, this thesis aims to present and examine several methods that can be used to observe a variety of geomorphic components fundamental to controlling river form and dynamics. Since sediment transport processes are essential in governing channel morphology, a new, innovative technique for quantifying sediment grain size characteristics will first be presented in a proof-‐of-‐ concept approach. This will feature photogrammetric techniques to derive high-‐ resolution digital elevation models (DEMs) from which a range of sedimentological parameters can be read. The technique has been applied in conjunction with traditional methods – which have previously been shown to yield insufficient data, yet which remains the industry standard – in addition to contemporary terrestrial laser scanning (TLS) methods (e.g., Entwistle and Fuller, 2009), which has previously yielded excellent results, but is expensive, cumbersome and requires considerable post-‐processing and user training.
Results from this new method will receive validation through the application of semi-‐ variance analysis, i.e., multi-‐directional variograms, which has been validated as a viable statistical method in a number of studies that derive textural composition of dry gravel features in order to inform channel morphology and hydromorphologic processes. A full overview of the aims, objectives and structure of this thesis are described in Table 1.1.
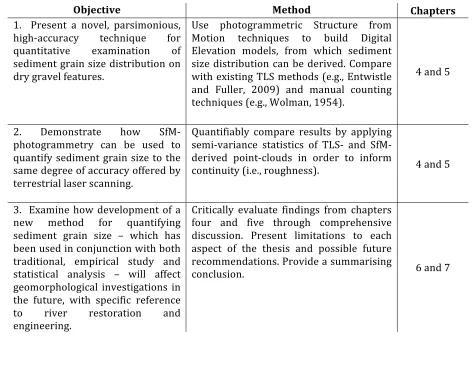
Table 1.1. Thesis objectives and the methods employed in order to achieve them.
Objective Method Chapters
1. Present a novel, parsimonious, high-‐accuracy technique for quantitative examination of sediment grain size distribution on dry gravel features.
Use photogrammetric Structure from Motion techniques to build Digital Elevation models, from which sediment size distribution can be derived. Compare with existing TLS methods (e.g., Entwistle and Fuller, 2009) and manual counting techniques (e.g., Wolman, 1954).
4 and 5
2. Demonstrate how SfM-‐ photogrammetry can be used to quantify sediment grain size to the same degree of accuracy offered by terrestrial laser scanning.
Quantifiably compare results by applying semi-‐variance statistics of TLS-‐ and SfM-‐ derived point-‐clouds in order to inform
continuity (i.e., roughness). 4 and 5
3. Examine how development of a new method for quantifying sediment grain size – which has been used in conjunction with both traditional, empirical study and statistical analysis – will affect geomorphological investigations in the future, with specific reference to river restoration and engineering.
Critically evaluate findings from chapters four and five through comprehensive discussion. Present limitations to each aspect of the thesis and possible future recommendations. Provide a summarising
conclusion. 6 and 7
1.7. Motivation
The stimulus for this investigation is a desire to provide a method for accurately quantifying sediment grain size by means of a remote sensing method that is accessible to those operating on modest budgets, yet who require a precise estimation of grain size distribution and sediment characteristics. Existing remote sensing methods, though highly accurate and strongly established as a viable method for micro-‐scale topographic estimation, are beyond the financial reach of many river restoration projects, particularly in a time of austerity at the time of writing. At the same time, methods for quantifying river restoration are highly sought after in an age where process-‐based restoration is widely ubiquitous in modified catchments.
[image:19.595.72.544.117.491.2]
1.8. Thesis Layout
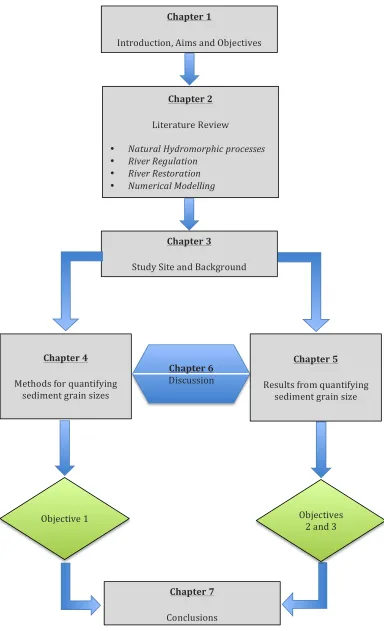
This thesis is comprised of two distinct studies whose results will be integrated to form a single, cohesive argument. A generalised layout is provided in Figure 1.3., however, the broader rationale behind this arrangement is based on independent fractions of each study being assimilated through combined results. It is anticipated that this approach will assist the reader’s referral to the presented material, in addition to creating a clear, intelligible paper.
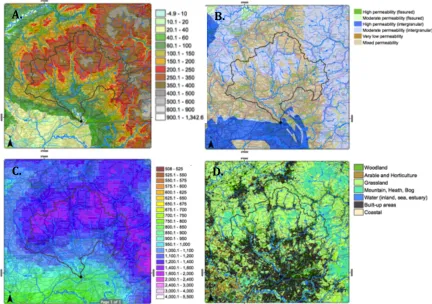
Chapter Two provides a comprehensive review of the available literature regarding subjects touched upon throughout this thesis. This evaluation of existing works led to the establishment of experimental designs for each investigation presented herein, by allowing for identification of potential gaps in current knowledge, or of where improvements in technology may permit progression of existing research. Following this, a brief overview of the study site is provided in chapter Three, including descriptions of catchment characteristics – such as geology, land-‐use, precipitation, and elevation – in addition to a brief introduction of relevant maps, hydrological characteristics and a general historical background.
Chapter Four is separated into the two distinct elements that comprise this study: methods for quantifying sediment grain size distribution; and geo statistical analysis of data gathered using a range of techniques; including traditional, manual methods; laser scanning methods; and so-‐called SfM-‐photogrammetry methods. This separation is continued in chapter Five, where results from all the applied methods are presented. First, empirically-‐derived results from traditional, manual counting methods are provided, followed by findings from the application of both contemporary TLS, and SfM-‐ photogrammetry. Next, results generated from geostatistical analysis are presented along with results from investigations of internal consistency within generated spatial data sets.
Finally, Chapter Seven provides an overall conclusion, presenting within it limitations of the methods and analysis employed in the study, in addition to possible future recommendations where applicable. Furthermore, the aims and objectives highlighted in section 1.5 will be referred back to and examined; demonstrating how this study may contribute in the future remote sensing of fluvial environments.
Figure 1.3. A generalised thesis workflow highlighting its core aims and objectives and how they will be realised.
Chapter 1
Introduction, Aims and Objectives
Chapter 2
Literature Review
• Natural Hydromorphic processes • River Regulation
• River Restoration • Numerical Modelling
Chapter 3
Study Site and Background
Objective 1
Chapter 7 Conclusions Chapter 4
Methods for quantifying sediment grain sizes
Chapter 5
Results from quantifying sediment grain size
Objectives 2 and 3 Chapter 6
[image:22.595.118.502.51.682.2]Chapter 2: Literature Review
2.1. Natural Hydromorphologic Processes of Gravel-‐Bed Streams
Gravel-‐bed rivers are inherently complex systems, which encompass an intricate mosaic of in-‐stream habitat types and functions, and are shaped by interactions of fluid flow and erodible materials within the channel boundary (Knighton, 1998). Such systems comprise a diverse range of hydromorphologic processes; however, two primary forces acting upon water flowing within a channel’s boundary define channel form: gravity, which facilitates movement of water in the downslope direction; and friction, which resists downslope motion (Leopold et al., 1964; Van Rijn, 1984; Knighton 1998).
The flow of water in rivers is highly dynamic and undergoes periodic fluctuations of magnitude over timescales of ‘hours days, seasons, years, and longer’ (Poff et al., 1997). Predictions of such events are permitted through analysis of long-‐term flow data derived from an extensive network of stream gauges, and is generally expressed as a daily mean average (although instantaneous values taken at 15 minute intervals may be available) usually in cubic metres per second (m3s-‐1).
Flow regimes exhibited by rivers are essentially dictated by precipitation events (Poff et al., 1997), though catchment geology, soil typologies, and land cover can influence the timing, magnitude, frequency and duration of high and low discharge (Newson, 1994). Such fluctuations are important from a hydromorphologic perspective, since water flowing within a channel is the medium in which sediments and debris is transported, and thus facilitate morphological processes operating within the channel (Knighton, 1998). There is, then, a significant, optimal discharge for every river: a point at which sediment transport is initiated and channel-‐forming processes take place. ‘Dominant Discharge’, defined by Wolman and Miller (1960) as the discharge that performs most ‘work’ (i.e., sediment transport); and by Benson and Thomas (1966) as ‘the discharge that over a long time period transports the most sediment’, is a fundamental concept in fluvial geomorphology (Richards, 1982; Knighton, 1998).
In order for sediment transport to occur, river flow must first reach a sufficiently high discharge to initiate entrainment (the modes by which sediments are transported in a stream are described in figure 2.1). This may be described in the context of flow competence (Ashworth and Ferguson, 1989; Powell and Ashworth, 1995; Whitaker and Potts, 2007) and is expressed as stream power (Ω):
Ω =𝜌𝑔𝑄𝑆
More specifically, the entrainment, transport and deposition of non-‐cohesive alluvial sediments are fundamental for river morphology (Richards, 1982). Sediment transport processes may be separated into three distinct fractions: suspended load, comprised of fine, easily transported material; solute load, comprised of those products of weathering and erosion which are conveyed in the form of solutes; and bed-‐load, comprised of large sediment particles (gravels, cobbles and boulders) which form a river’s substrate (Richards, 1982). The former two fractions represent the majority of material transported by a river at any given moment whilst the latter, despite contributing a smaller portion of total transported material, is important for defining channel form (Collins and Dunne, 1990) and thus will receive most investigation throughout this thesis. Bed-‐load transport is a phenomenon that occurs intermittently, during periods when discharge is sufficiently high to initiate entrainment and sustain transport, and is mediated through three primary mechanisms of conveyance: rolling, sliding and saltation (erratic jumping and bouncing of particles (Figure 2.1.)) (Van Rijn, 1984). Initially, some threshold must be achieved at which the aforementioned forces (gravity and friction) are balanced; either as critical shear stress (
𝜏
!") or critical velocity (𝜈!"). Mean boundary shear stress may be defined as:
𝜏
!𝛾𝑅𝑠
Where 𝛾 is specific weight of water, R is hydraulic radius and s is slope (after Knighton, 1998). Whilst this notion is broadly accepted, true transport processes require complex calculations in order to sufficiently describe them.
Numerous attempts have been made to fully encompass the entire range of variables that may influence bed-‐load transport, with DuBoys (1879) creating the first successful (albeit incomplete) numerical formula. Later works followed (see table 2.1. for a brief summary) (Schoklitsch, 1930; Shields, 1936; Einstein, 1942; Meyer-‐Peter, 1949; Einstein, 1950; Yalin, 1963; Nielsen, 1992) and have been subsequently tested under various conditions (Dietrich, 1982; 1989; Gomez, 1989; Gomez and Church, 1989; Lisle, 1995; Reid et al., 1996; Buffington and Montgomery, 1997; 1999a; Yang and Huang, 2001; Barry et al., 2004; Wilcock et al., 2009; Recking et al., 2012) (Figure 2.1b).
Figure 2.1. Modes of sediment transport in gravel rivers. A: saltation; B: rolling and sliding. After Knighton (1998).
Y Y=D/2 sin𝜙
D/2
𝜙 X=D/2 cos𝜙
A
Submerged weight =
𝑔(𝜌!−𝜌)𝜋!6𝐷!
for a sphere of diameter D
Drag force = 𝜋!/! assuming n
particles in a unit area A.
[image:25.595.113.496.276.585.2]Table 2.1. Common equations used to describe sediment transport processes in open channels.
A river’s substrate (or bed-‐load) can be loosely defined in the context of ‘texture’ or ‘roughness’ (Nikora et al., 1998; Buffington and Montgomery, 1999b). However, whilst these appear to be qualitative observations, efforts have been made to objectively quantify streambed rugosity (e.g., Wolman, 1954), given that bed roughness is fundamentally interrelated with hydraulics and the supply and distribution of sediment particles within open channels (Buffington and Montgomery, 1999b). Moreover, texture can also refer to the immense variations of shape, size, weight and density of sediments that comprise bedforms – features similarly important in natural hydrogeomorphic processes (Gomez, 1993; Smart et al., 2004; Qin et al., 2013) – in addition to the many ways in which sediment can be configured (Milan et al., 1999).
Method
Equation References
Du Boys (1879)
𝑞! =𝜆𝜏!(𝜏!−(𝜏!)c) Powell et al. (2001)
Shields (1936)
𝜏!∗ =
𝜏! 𝜌!!𝜌 𝑔𝐷
Vanoni (1964); Wiberg and Smith (1987);
Meyer-‐Peter (1948)
qb=8
(
θ−θc)
3 2 σg ρg−1 " #
$ %
& 'gD3
Wong and Parker (2006)
Bagnold (1966)
qb =
a
tanα
(
u*−u*c)
(
τ0−τc)
[image:26.595.81.539.113.290.2]Flow velocity is one of the most important factors in controlling riverbed texture (Knighton, 1998) and relates to frictional resistance between fluid flow and the channel boundary. A number of formulae have been devised in order to account for such interactions, the most common of which are:
1) The Chezy (1769) Equation:
𝑣= 𝐶 𝑅𝑠
Where v is mean velocity (in m3s-‐1), C is the Chezy roughness coefficient, R is hydraulic
radius and s is slope.
2) Manning’s (1889) Roghness Equation:
𝑉
=
!!
𝑅
!/!𝑆
!!/!
Where V is mean flow velocity (in m3s-‐1), R is hydraulic radius (in m) Se is slope of energy
grade line (in m per m) and n is Manning’s roughness coefficient.
3) Darcy-‐Weisbach equation:
𝑓𝑓
=
!!"#!!Where f f is the Darcy-‐Weisbach friction factor, g is gravitational acceleration (9.81 m/s2), R is hydraulic radius, s is slope and v is mean velocity.
Though the two former equations are pervasive in many river engineering operations, the latter is recommended ‘for its directional correctness and sounder theoretical basis’ (Knighton, 1998. p, 101). In rivers whose substrate is comprised of cobbles and gravels, grain roughness prevails as dominant factor of flow resistance, where grain roughness is a function of relative roughness:
1
𝑓𝑓= 𝑐log 𝑎
𝑅 𝐷!
Where c and a are constants, and Dx is a measure of the size of roughness elements.
In addition to small-‐scale sediment size distribution, a natural, longitudinal sorting of sediment likewise controls particle characteristics in gravel-‐bed streams (Hooke, 2003). Upper reaches of river catchments provide a source of coarse material, where the products of erosion are added to a continuous hydrogeomorphic cycle of bed-‐load transport, erosion and deposition (Kondolf, 1997). A consequence of the abovementioned modes of bed-‐load transport is that particles are gradually reduced in size by episodic periods of motion during high discharge.
Accordingly, forces acting upon bed-‐load material serves to lineally sort sediment along a river’s length. The mechanisms by which sorting occurs is somewhat contended in the available literature; however, downstream fining is likely to be facilitated by a combination of selective sorting at varying discharge, and mechanical abrasion of particles during transit (therefore enhancing selective sorting) (Hoey and Ferguson, 1994; Paola and Seal, 1995; Dade and Friend, 1998; Gomez et al., 2001; Constantine et al., 2003; Wright and Parker, 2003; Gaspariani et al., 2004). Hence, longitudinal changes in the structure of channel form are reflected by the myriad of habitat types along a river’s course (Ward et al., 2002).
2.2. River Regulation and its Impacts upon Natural Hydromorphic Processes and
River Ecology
Most of the world’s major rivers are in some way regulated by human intervention (Dynesius and Nilsso, 1994; Bednarek, 2001). Historically, such impacts result from the central role rivers played in the development and prosperity of civilizations. The most common way in which humans regulate rivers is through construction of dams and other hydraulic structures, usually for the purposes of flow diversion, flood control, irrigation, and hydroelectric power generation (Surian, 1999). The practice of building dams for water security developed 5,000 years ago (Petts and Gurnell, 2005; Gregory, 2006) thus prompting one of the oldest forms of engineering (Baxter, 1977), and has expanded considerably over the centuries, both in quantity and size: Bradt (2000) notes that ‘in 1900, there were 427 large dams, i.e. higher than 15m, around the world, while in 1950 and 1986 there were 5,268 and 39,000 respectively’ a number which, by the earlier 21st Century, had risen to between 45,000 (Marrenn et al., 2014) and 48,000
(WWF, 2014) structures.
The importance of river regulation in human development is noteworthy indeed, and dams continue to be constructed in response to rapid growth in population. Whilst there exists a great many large impoundments, 168 of which are in the United Kingdom (BDS, 2014), there are likely to be millions of far smaller hydraulic structures constructed in rivers the world over. It is difficult to quantify how many of these lesser impoundments exist in UK streams, though Elbourne et al. (2013) suggest there could be up to 25,000 in-‐stream constructions. However, it is clear that many of these structures have become obsolete since the end of the industrial revolution and no longer serve the purpose for which they were constructed. Hence, profound alterations to natural hydromorphic processes arise from the addition of artificial barriers within rivers.
River impoundments disturb the two most determinant factors of channel size, shape and morphology: water and sediment (Grant et al., 2003). Kondolf (1997) describes the river system as a continuous conveyor belt, which is defined by three distinct zones (erosion, transport and deposition), driven by the transfer of energy from ‘steep, rapidly eroding headwaters’ to lower level reaches below sea level (Schumm, 1977), and maintained by a dynamic, quasi-‐equilibrium (LaLeft ngbein and Leopold, 1964; Leopold et al., 1964; Schumm and Lichty, 1965; Richards, 1982; Knighton, 1998).
Artificially modifying natural processes that facilitate transfer of water and sediments has profound influences on morphological, hydrological and ecological functions of rivers (Petts, 1977; Williams and Wolman, 1984; Knighton, 1989; Ligon et al., 1995). The most important impacts of river regulation are alterations to natural water and sediment regimes brought about by a reduction in the timing, frequency and magnitude of low and high discharge events (Benke, 1990; Power et al., 1996; Graf, 1999; Nislow et al., 2002; Magilligan and Nislow, 2005; Rolls and Arthington, 2014). Church (1995) notes that, downstream from the point of regulation (where sediment is intercepted), degradation may occur providing that ‘post-‐regulation flows remain competent to move bed material’. Similarly, Baxter (1977) highlights that the downstream impacts of impoundments are conversely mirrored upstream.
Hence, man-‐made impoundments represent a foremost disturbance to Kondolf’s (1997) idealiased, conveyer-‐like river system, removing kinetic energy from the flow and severely adjusting post-‐impoundment quasi-‐equilibrium, therefore interrupting longitudinal connectivity within streams. Similarly, a reduction in peak flows ultimately reduces lateral connectivity with riparian environments –the zone that runs adjacent to river corridors (Marren et al., 2014); and vertical connectivity – i.e., interactions between stream and groundwater resources (Ward, 1989). Diminution of the interaction between channel and floodplain may have significant impacts upon the morphology of rivers, since ‘as much as half the annual sediment load of a river is deposited on its floodplain’ (Renshaw et al., 2014).
The purpose of dams is generally to control water for human requirements; however, a secondary effect is mass accumulation of sediments transported from upstream reaches either as fine material suspended in the water column, or as coarse-‐grained bedload, which intermittently rolls and cascades downstream and becomes impounded by the dam.
Though a maximum of only about 15% of sediment within a river is comprised of bedload material (Collins and Dunne, 1990), it is this which determines the character of alluvial channels, and what is more, Petts and Gurnell (2005) note that, ‘for many rivers, the headwater catchment provides more than 75% of the river’s sediment load’. Further, the efficiency with which hydraulic structures are able to impound sediment increases with size (Williams and Wolman, 1984); yet, although this thesis is concerned with small river weirs, the combined effects of many successive weirs may equal or exceed those imposed by very large constructions (Brandt, 2000).
In most cases, some form of channel adjustment will occur in response to flow and sediment impoundment, though the ways in which this is manifested, and the timeframe over which modifications occur, varies from one stream to the next (Surian, 1999). Due to the prompt impediment of sediment delivery from upstream, a regulated channel is likely to degrade since no new material is able to replace that which is entrained and transferred to lower reaches, often resulting in a coarsening of bed material or scour, before a newly-‐imposed equilibrium is achieved (Church, 1995). There is, then, a balance between form and process (Petts and Gurnell, 2005), a concept generally expressed by Lane (1955) as:
𝑄𝑆
=
𝑓𝐿𝑏𝐷
Where bed material load (Lb) and sediment size (D) is some function (f) of discharge (Q) and slope (S). Hence, alluvial river channel form (width, depth and gradient) is a product of the quantities of water and sediment supplies they receive and have adjusted to. Accordingly, a change in such parameters will permanently change channel form, and is likely to induce profound detrimental impacts to ecological functions of rivers.
The most abrupt and pervasive ecological impact of river impoundments is that they present a physical barrier to longitudinal movements of a plethora of aquatic organisms. Perhaps most marked are the impacts upon migratory species of fish, such as anadromous Atlantic salmon (Salmo salar) (Thorstad et al., 2008) and catadroumous European eel (Anguilla anguilla) (White and Knights, 1997), each of which requires unimpeded passage from sea to upstream reaches at some point in their life cycle. A diverse range of ecological impacts arises from changes to flow regimes, many of which are discussed by Ligon et al. (1995) and Bunn and Arthington (2002), though the entire range of such impacts are too numerous to mention in this thesis. What must be stated, however, is that reductions in the quality of riverine habitat is a major catalyst for many restoration projects in the UK (usually under the direction of European Law) and the interactions between natural hydromorphic processes are intrinsically linked with healthy river ecology (Clarke et al., 2003).