International Journal of Emerging Technology and Advanced Engineering
Website: www.ijetae.com (ISSN 2250-2459,ISO 9001:2008 Certified Journal, Volume 4, Issue 5, May 2014)
789
Design and Implementation of Improved Frequent Item Set
Mining Technique On Electricity Billing System
Prof. (Dr.) Sanjeev Bansal
1, Sovers Singh Bisht
21,2
Amity School Of Engineering And Technology, Amity University, Noida, India
Abstract—Electricity is one of the fundamental necessities of the human being which is commonly used for industrial, domestic and agricultural purposes, therefore problem arises when we distribute this electricity and cannot work beyond the meter readings. With the advent of time technology has provided tremendous advancements on its consumption, generation and distribution, one such area for its improvement is in its billing system and data mining approach has given a large scope for its improvement in billing system.
Our existing electricity board billing system is obsolete and time consuming. The approach here is based on consumption because we cannot rely on the meter reading as it might give faulty readings as the meter may be mutilated or damaged manually and their might be large differences between power consumption and the amount billed. This approach here also checks on electricity theft and helps in maintaining the electricity billing standards.
Keywords—frequent item set mining, database, meter reading, electricity billing, correlation, data compression and FP-tree pattern.
I. INTRODUCTION
This paper primarily focuses on the “design and implementation of the frequent item set mining technique on electricity billing system”. Association rules primarily focus on finding the hidden relationship between the stored databases. Hence the system can be related as rules which show relationship between the two classes. The object-oriented database consist of classes and as the classes grows hence the relationship between the classes thus association rules. In this context we design and improvise an algorithm based on electricity billing meter reading as the objects here are random and unique. This paper deals to design the right association rules for the object oriented database taken from the classes. If we think the universe is represented by the set of objects available and each object is in form of a boolean variable representation indicating the presence and absence of the object available.
These boolean variables can be used in future showing the frequency of occurrence of elements within a given time span thus in this paper we deal with the meter readings as the boolean variables to find hidden and frequent readings in a given billed transaction and it also checks the discrepancy within the billed items.
1.1 Existing System
Data mining (DM) is a step from Knowledge Discovery in Database (KDD) process, which is defined as a “nontrivial process of identifying valid, novel, potentially useful and ultimately understandable pattern in data”
(Fayyad et al., 1996)[1]. Association rules are created by
analyzing data for frequent item set. The technique for
International Journal of Emerging Technology and Advanced Engineering
Website: www.ijetae.com (ISSN 2250-2459,ISO 9001:2008 Certified Journal, Volume 4, Issue 5, May 2014)
790
1.2 Problem Statement
The current electricity billing system is generally not based upon any computer generated system and if it is it consists of many defects. The scope of fraud and irregular meter reading generation is of ample amount and this causes loss of revenue and higher power consumption due to false meter reading and tampered devices. Thus in this paper we provide an effective method by using the concept of data mining to effectively see the variations in bills generated in past and current time span. The billing system does not check the bills generated according to past transactions and current meter reading but randomly issues the bill amount here proposed system is used to check the frequency of bills in past and current and find the most appropriate bill which would be generated currently and if not there is a scope of meter false reading.
II. OBJECT ORIENTED LAYOUT
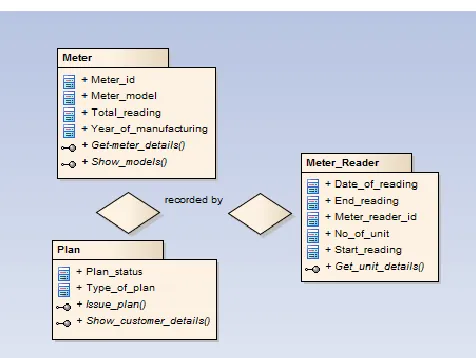
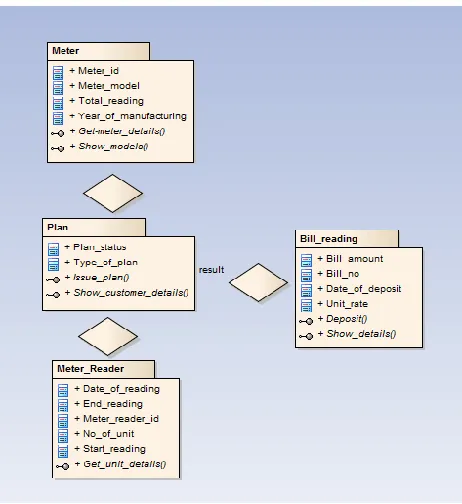
In this paper association rules can be represented through unified modeling language as a class diagram. Compressed FP tree is used for finding the frequent item set from the large datasets and represented through the diagram. This present work is useful when the database is growing continuously in generating of electricity bills and fraud detection. Unified modeling language (UML) represents the graphical view of the modeling language and the important feature of the UML is to design the software models. The electricity billing system in Indian context is primarily based upon the meter and plan opted to get billed. Thus in figure 1 the class diagram here is representation of a meter distributed with reference to a plan. This shows a one to one relationship between the meter and plan distributed accordingly. The interface shows how we can calculate meter details and show models. The figure 2 shows the meter, plan and meter reading which shows how a customer opted for a unique plan and what is its meter reading. The class diagram shown in figure 3 shows clearly how many to one association can be done to build a software according to a particular transaction of a meter being billed within a given time span.
[image:2.612.325.563.134.316.2]
Fig 1: Representation of binary Association
Fig 2: Representation of ternary Association
[image:2.612.325.563.334.513.2]International Journal of Emerging Technology and Advanced Engineering
Website: www.ijetae.com (ISSN 2250-2459,ISO 9001:2008 Certified Journal, Volume 4, Issue 5, May 2014)
[image:3.612.53.284.132.384.2]791
Fig 3: Representation of many to one Association
The importance of an effective and efficient billing system cannot be over emphasized as this is very critical step as small errors can lead to substantial loss of revenue. The main theme of this paper is to design and construction of a computer based billing system to display the consumed power, the sale rate and other parameters.
III. PROPOSED CONCEPT
Suppose we have certain databases of a customer which shows his different meter readings and plans opted for billing, in this context he has been billed multiple times in a given period of time and thus the proposed system here is to find the most frequent billed transaction on which he can check his current billed system authenticity. The proposed algorithm for this purpose is a compressed form of FP tree based algorithm.
3.1Correlation concept
As we are aware of the fact that mining frequent itemsets rely on the concept of correlation thus here according to the probability distribution theory two itemsets can be correlated according to the entropy of information contained within the itemsets. Entropy is the resultant of the probability distribution of elements which signifies how much information an element contains within a transaction.
According to the entropy elements is generally represented by the method as follows:
Entropy= - where,
Pi of an element i is given as frequency of element i/total
number of elements thus we group the elements according to their occurrence in a particular transaction get the reduced tree based on frequent itemset approach.
Two items P1 and P2 can be correlated if they satisfy the following conditions:
P (P1P2) > P (P1) P (P2) Here
P (P1P2) = Probability of items P1 and P2 occurring simultaneously in a particular system i.e. the probability of occurrence of both P1 and P2 together/total number of occurrences, similarly we measure probability of P1 and P2. This shows that if two items occur together within a system than information gained is more as compared to items occurring alone thus the above concept represents that
Observed Probability P (P1P2) > Expected P (P1)P (P2)
3.2 Proposed Algorithm
Algorithm: FP growth.
Mine frequent itemsets using an FP growth algorithm.
Input:
min sup, the minimum support count threshold in terms of frequency of occurrence of item sets. i.e. required to group items for correlation.
Output:
The complete set of frequent item sets in a system billed generation process.
Method:
1. The FP -tree is constructed in the following steps:
(a) Scan the database D within a customer once. Collect P,
the set of frequent item sets, and their frequency of
occurrence. Sort P in support count descending order as L,
the list of frequent item sets.
(b) Create the root of an FP tree, and label it as “null.” For
each transaction Trans in D do the following. Select and
sort the frequent item sets in systemaccording to the order
of L. Let the sorted frequent item list in system be [N],
where n is the first element and N is the remaining list. Call
insert tree ([n in N], which is performed as follows. If T has
a child X such that X.item-name=n.item-name, then
increment item sets’s count by 1; else create a new node A,
and let its count be 1, its parent link be linked to T, and its
node-link to the nodes with the same item-name via the
node-link structure. If A is nonempty, call insert tree (N, A)
International Journal of Emerging Technology and Advanced Engineering
Website: www.ijetae.com (ISSN 2250-2459,ISO 9001:2008 Certified Journal, Volume 4, Issue 5, May 2014)
792
2. The FP -tree is mined by calling FP growth (FP tree,
null), which is implemented as a following procedure to
generate FP growth tree:-
1.If tree contains a single path p then
2.For each combination generate nodes(b) in the path p
and generate entropy by probability of occurrence item sets of each group in a bottom up fashion
3.pattern b[a with support count = minimum support
count o f items in b;
4.else till each header of the tree {
5.continue this process for every combination of group
of items in the tree with correlation
6.generate every conditional pattern base for each node
in correlation such as
7.P (P1P2) > P (P1) P (P2)
8.Thus if observed probability > expected probability
and it satisfies support count = minimum support
count o f items in b} then
9.Call improved FP growth tree
3.3 Design of association rules
Now let us design the association rules for which table 1 is created for the object oriented database represented in the table. Object-oriented database is better than relational database because the relation of object-oriented database establishes the connection between objects and not a table.
Customer records are stored in data tables and large amount of bills are stored in table and these recorded figures helps in applying the above proposed algorithm.
[image:4.612.318.571.205.323.2]The support count of the system is kept minimum so as to generate maximum number of groups and find frequent item sets to the lowest level of hierarchy which helps in effectiveness of the algorithm and in its implementation.
Table 1
Items for electricity bill system for a customer
S.no Items Name
1 Meter_id, Type-of_plan
2 Meter_id, Type-of_plan, date_of_reading,
Bill_amount
3 Bill_amount, Type-of_plan, date_of_reading,
Unit-rate
4 Meter_id, Type-of_plan, date_of_reading,
no_of_units, Bill_amount
5 Date_of_reading,Meter_id, Type-of_plan,
No_of_unit, Unit_rate, Bill_amount
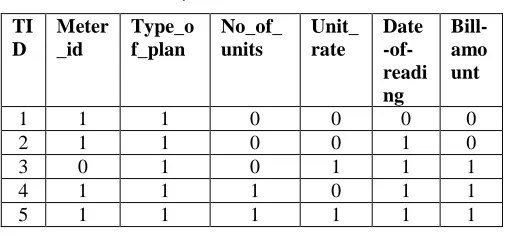
Let us establish binary representation of above transactions and this show how we can represent these values in a compressed format. The presence of an item set in a particular TID is represented by1 and absence by 0.
Table 2
Binary association of data items
TI D
Meter _id
Type_o f_plan
No_of_ units
Unit_ rate
Date -of-readi ng
Bill-amo unt
1 1 1 0 0 0 0
2 1 1 0 0 1 0
3 0 1 0 1 1 1
4 1 1 1 0 1 1
5 1 1 1 1 1 1
Now these item sets can be arranged according to the algorithm and be represented in decreasing order of occurrence of elements and we find the probability distribution of elements to compress the elements so that we can generate and compressed FP tree. The more we group elements the more compressed tree can be produced. Let these item sets be represented as {I1, I2, - - - - -In} to show the construction of the FP tree.
Table 3
Items with frequency of occurrence based binary association of data elements.
Items Elements Frequency Probability(f/n)
I1 Type_of_plan 5 0.25
I2 Meter _id 4 0.2
I3 Date_of_reading 4 0.2
I4 Bill_amount 3 0.15
I5 No_of_unit 2 0.1
I6 Unit_rate 2 0.1
[image:4.612.45.294.541.665.2]International Journal of Emerging Technology and Advanced Engineering
Website: www.ijetae.com (ISSN 2250-2459,ISO 9001:2008 Certified Journal, Volume 4, Issue 5, May 2014)
793
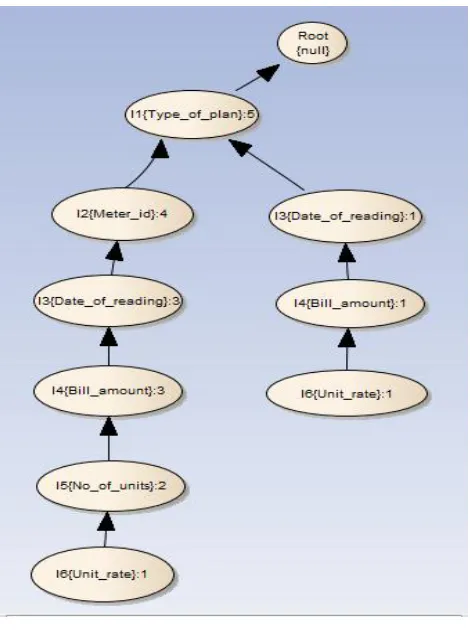
Fig 4: A FP tree based on frequent item sets.
The above tree is a compressed from of a binary tree which is traversed in a bottom up fashion. It is compressed as it generated very less amount of candidate sets and hence reduces repeated number of scans from the database.
3.4 Result analysis.
The above tree comes into a conclusion of finally generating a conditional pattern base in a bottom up manner thus to obtain the frequent pattern from above tree.
[image:5.612.52.287.132.448.2]The observed probability for the above FP tree can be generated as follows which shows the relation between every node with highest occurrence of item sets in this regard observed probability > expected probability of the data elements. Since when finding the conditional pattern base the elements with the support count less than minimum support count are pruned thus we finally obtain the frequent patterns which occur within the given database and hence a consumer can check the occurrence of elements and then decide to pay his bills accordingly.
Table 4
Frequent pattern for data elements
Item sets Min_sup
Meter_id,Type_of_plan, Date_of_reading 3
Meter_id,Type_of_plan,Bill_amount 3
IV. CONCLUSION
This paper presents a new and improved mechanism to generated highly compressed frequent itemsets in context to electricity billing system. This shows there is ample scope for improvement in the billing system technology in the Indian context thus this algorithm when implemented efficiently has the following advantages which are given as follows:
As much less is the probability that much less is the
probability of occurrence of elements i.e. elements will be frequent but their probability of occurrence system based configuration will be less.
Since the support count of the elements is kept minimum
and is generating a frequent pattern it proves our result.
The observed probability of occurrence of elements is
less than probability of individually occurring elements hence redundancy is reduced for elements in the matrix table.
Whenever we find probabilities of large datasets
containing elements it becomes easier to generate fast moving data streams such as real time traffic and system monitoring thus clustering ahead becomes easier and compact.
The tree generated is highly compressed and the
redundancies of datasets have been highly reduced due to the grouping of data itemsets.
This approach saves time and cost of scanning highly
large incoming data item sets within a system. This algorithm transforms the problem of finding long frequent patterns into searching for shorter ones in much smaller conditional databases recursively and then concatenation the suffix.
Therefore this approach reduces the size of pattern to be
searched for and generates a routing table that reduces the time complexity on large streams of data.
V. FUTURE SCOPE
International Journal of Emerging Technology and Advanced Engineering
Website: www.ijetae.com (ISSN 2250-2459,ISO 9001:2008 Certified Journal, Volume 4, Issue 5, May 2014)
794
It can also be used for hand held devices and this algorithm can also be used for credit card collection system where numerous transactions occur per day thus research can be elaborated and results can be highly compressed by implementing on different software tools.
REFERENCES
[1] R.Agrawal and R.Srikant. Fast algorithms for mining association rules.In VLDB‟94, pp.487 {499
[2] Data Mining: Concepts and Techniques: Concepts and Techniques -Jiawei Han, Micheline Kamber, Jian Pei.2012
[3] Improved algorithm for frequent itemset mining based on apriori and FPtree-Sujata Dandu,B.L.Deekshatulu & Preei Chandra Global Journals Inc. (USA) 2013
[4] An improved frequent pattern tree based association rule mining technique.ICISA-2011
[5] An improved association tree mining with FP tree using positive and negative integration-Rashmi & Nitin Shukla-JGRCS-2012
[6] An effective approach in data mining to reduce redundancies in large databases-Sovers Singh & Dr.Sanjeev Bansal-IJETAE-2012 [7] J.Han,J.Pei and Y.Yin,” Mining frequent patterns without candidate
generation”, Proceedings of the ACM SIGMOND ,May 2000. [8] Contrasting Correlations by an efficient double clique Condition
Aixiang Li, Makoto Haraguchi, and Yoshiaki Okubo.
[9] Implementation of apriori algorithm on electricity billing system Vipin saxena,Sudhir kumar singh IJCA jan 2014
[10] J.Pei, J.Han and H.lu.Hmine: Hyper-structure mining of frequent patterns in large databases.ICDM 2001.pp441-448.