International Journal of Emerging Technology and Advanced Engineering
Website: www.ijetae.com (ISSN 2250-2459, Volume 2, Issue 2, February 2012)1
Modeling and Simulation of a University LAN in OPNET
Modeller Environment
1
A.A. Atayero,
2A.S. Alatishe ,
3A.A. Afolayan
Department of Electrical and Information Engineering, Covenant University, Nigeria.
atayero@ieee.org
Abstract— Academia has peculiar networking needs that must be satisfied for effective dissemination of knowledge. The main purpose of a campus network is efficient resource sharing and access to information among its users. A key issue with designing and implementing such Local Area Networks (LAN) is its performance under ever increasing network traffic, and how this is affected by various network metrics such as latency and end-to-end delay. Implementation of network systems is a complex and expensive task; hence network simulation has become essential and has proven to be cost effective and highly useful for modeling the desired characteristics and analyzing performance under different scenarios. As well as providing useful prognosis of future network performance based on current expansion dynamics. We present in this paper the simulation and analysis of the Covenant University campus LAN in the OPNET Modeler environment.
Keywords – Ethernet, LAN, Network, OPNET, Simulation.
I. INTRODUCTION
Communication is a necessity in all settings be it social or professional. For tasks to be accomplished, people need to work together to solve problems and create resources for the institution. For easy sharing and access of information among users, the computers involved must be interconnected. This interconnection of computers to form a network with the objective of information communication and optimization of resource sharing is referred to as Local Area Network (LAN) [1]. Active and passive networking devices such as switches and hubs are deployed as concentrators to which other networking devices are connected to form LAN. For simulation purposes at the design stage and prior to actual network deployment, simulation software is used to imitate real life scenarios on the LAN. An example of such software is the OPNET modeler 11.5 simulation software.
II. THEORETICAL BACKGROUND
Works on Local Area Network modeling are widely reported in the literature. The two main concepts to note, while modeling a network are: Equivalence and Validation. Equivalence is a measure of the similarity between the model in terms of behavioral characteristics and the real system to be simulated [1].
2.1 Network Protocols
There exist a predefined set of rules engaged on networks, which allow for easy communication between the different devices on the network. These set of rules are known as network protocols. One such protocols is the Internet Protocol (IP) – used to enable computers communicate with each other, regardless of which operating system they are running. This protocol allows for easy information exchange among network nodes. Higher-level network protocols like Internet Protocol (IP) use Ethernet as their transmission medium, while data is transmitted over the Ethernet in protocol units known as frames [2]. The advanced protocol, Hypertext Transfer Protocol (HTTP): enables information on the Internet to be accessed from anywhere, by anyone. It is responsible for the easy migration between webpages using the GUI.
2.2 Ethernet
International Journal of Emerging Technology and Advanced Engineering
Website: www.ijetae.com (ISSN 2250-2459, Volume 2, Issue 2, February 2012)2 Fast Ethernet or 100BASE-T provides transmission speeds of up to 100 Mbps and is typically used for LAN backbone systems, supporting workstations with 10BASE-T cards. Gigabit Ethernet provides an even higher level of backbone support at 1000 Mbps.
2.2.1 LAN Topologies
The topology of a network is defined as the manner in which nodes are arranged and connected [5]. In line with this definition, there are two major types of topological groups, which are the physical and logical topology. The Physical topology of a network refers to the configuration of cables, computers, and other peripherals. While the Logical topology refers to the method used to pass information between workstations. There are three constrained and one unconstrained network topologies deployed in local area networks. The three constrained topologies are known as the bus, ring, and star configurations, while the unconstrained is called the mesh configuration [2].
2.2.1.1 Bus Topology:
In bus topology, all the network nodes are connected to a common transmission medium. The bus topology was fairly popular in the early years of networking. It is both easy and cheap to setup. All devices on the Bus Topology are connected using a single cable. In this topology, only one pair of users on the network can exchange a packet of information at the same time. The breakdown of a link affects the whole network.
2.2.1.2 Ring Topology:
In a ring topology, point-to-point links connect nodes, which are arranged to form a single closed path. Information travels around the ring from node to node. Installation is easy in Ring topology and Link failure can be easily identified. The Ring Topology is providing a collision-free and redundant networking environment. In this topology, if one link fails, the whole network goes down. However, adding a new device to an existing physical Ring network can be complicated, as any new device needs to go in between the existing devices. Ring topology provides a collision-free and redundant networking environment. It is not as common as other topologies due to its high expense.
2.2.1.3 Star Topology:
One of the most popular topologies for Ethernet LANs is the star topology. Star Topology works by connecting each node to a central device.
This central connection allows us to have a fully functioning network even when other devices fail. A Star topology gives great fault tolerance, as any device/cable failure will not affect the rest of the network (unless the central device or server fails). Physically adding new devices to a Star network is very simple compared to any of the other topologies by simply running a cable from the new device to the hub/switch. Data on a star network passes through the hub, switch, or concentrator before continuing to its destination. The hub, switch, or concentrator manages and controls all functions of the network. This configuration is common with twisted pair cable. However, it can also be used with coaxial cable or optical fibre cable. Star topology cabling can be very expensive, hence the need for software simulation before deployment.
2.2.1.4 Mesh Topology:
In this topology, the nodes do not have a unique point of connection, each device or PC is connected to every other device or PC in the network by its own cable, which means vast amounts of cables for any standard network. This type of network topology boasts the highest fault tolerance of all of the network topologies, it is also usually the most expensive. The Mesh topology provides fault tolerance by having separate cables for each connection, thereby allowing any one cable to break without interferring with the rest of the network. Adding new clients or computer could be complicated, because everytime you add a client to a mesh network you have to run cables to each of the other devices [6]. In mesh topology, traffic is shared between two nodes only. Error identification and isolation is easy with this topology.
In the course of this work, star topology was employed. This topology has a central switch or node (which transmits and receives messages to and from the clients) to which other nodes are connected. The topologies currently deployed on the Covenant University LAN are star and ring topologies.
III. NETWORK MODELING AND SIMULATION
International Journal of Emerging Technology and Advanced Engineering
Website: www.ijetae.com (ISSN 2250-2459, Volume 2, Issue 2, February 2012)3 It is mostly used for networks that contain a very large number of nodes and services, which would be too much time consuming and costly to deploy and evaluate. The use of simulation in networking helps save time and also helps control the scale of the network. The advantages of simulation in terms of cost, student involvement and learning outcomes, utility in distance learning, the ability to give practical experiences about expensive real network technologies of a wide range are so impressive that simulation as a veritable means of network analysis cannot be over-emphasized [6].
A. Methodology
The methodology adopted in this modeling and simulation experiment is presented in the OPNET architecture algorithmic diagram (Figure 1) with slight modification as described below[8]:
STEP1. Create a project
STEP2. Create a baseline scenario
STEP3. Import or create a network topology
STEP4. Import or create traffic
STEP5. Choose statistics to be collected
STEP6. Run the simulation
STEP7. View the results
STEP8. Duplicate the scenario
STEP9. Make changes
STEP10. Re-run the simulation
STEP11. Compare the obtained results
B. Network Data Collection
Network data is collected from individual nodes in the model network or from the real network. Some data need to be collected to ensure that the existing network is robust enough ot accommodate future expansion without excessive end-to-end delay or other negative effects due to expansion [11, 12, 9, 10]. In the course of network modeling, some specifications must be made and the following questions need be asked:
Server specification – will the server be able to handle the additional load introduced as a result of network expansion?
Delay specification – will the total end-to-end delay across the network be acceptable as the network grows?
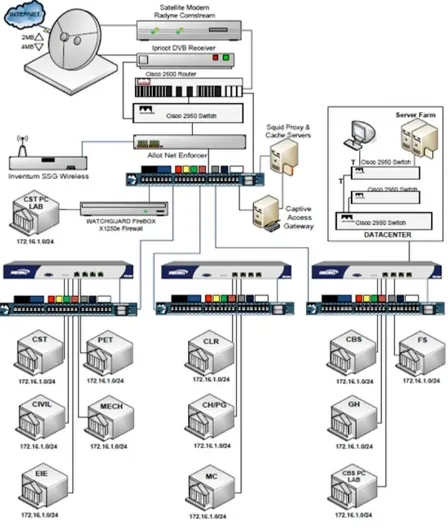
[image:3.612.336.560.419.683.2]In a bid to answer these questions comparative network performances are required. To this end, object statistic (Server Load), and global statistic (Ethernet Delay) data is collected. The Server load is a major statistic that reflects the performance of the entire network [11]. A proposed model of the Covenant University LAN is depicted in Figure 2.
Figure 2. Layout of Covenant University Campus Local Area Network
International Journal of Emerging Technology and Advanced Engineering
Website: www.ijetae.com (ISSN 2250-2459, Volume 2, Issue 2, February 2012)4 The OPNET modeler simulation of the network modeled in Figure 2 is shown in Figure 3. The network model has room for future expansion through addition of new nodes.
IV. RESULTS AND DISCUSSION
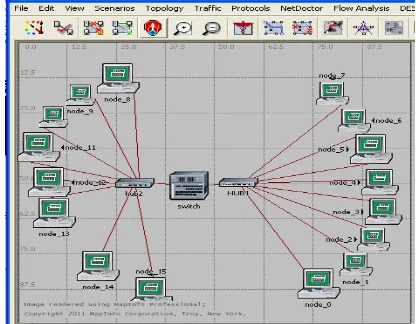
In this section we discuss briefly results obtained using the method described in section III above. Figure 4 illustrates the simulation of a segment of the modeled network using a switch and hubs as concentrators. The load on the server is determined at specific points in time during the simulation. The use of a switch and hubs helps to determine the effect of having the two concentrators on the network. It was observed that hubs produce more delay on the network than when switches are used.
It was observed that the sent packet across the network at a particular point in time is equivalent to the received packets. This implies that there was neither packet loss nor any significant collision on the network at that particular instant. Simulation results suggest that the delay on the Ethernet network is less when only switch is used compared to when hubs and switch or only hub is used.
Simulation results show that the Ethernet delay increases over the first few minutes as the traffic from the nodes being switched on increase network load. It then steadies out at around 0.00035 seconds as the average time a packet takes to traverse the network.
The analysis above proves that the addition of a few new nodes to the network does not have a significant effect on the network metrics. Likewise the removal of few nodes does not affect the Ethernet delay nor significantly increase the server load.
Replacing the switch with a hub in order to see how packets sent on the network affect Ethernet delay across the network results in a reduction in Ethernet delay by almost a half. This is as expected, since unlike a switch, hub performs no processing on the packets that passes through it. For this reason, it is faster at forwarding the packets and this reduces the network delay.
V. CONCLUSION
The use of the simulating software such as the OPNET modeler, whose advantages are enumerated in [12, 13], in the course of this project has thrown more light on the fact that real-life real-time network scenarios can be imitated successfully. From the graphical analyses it has been made clear that the maximum time used in sending packets across the network varies depending on the number of users on the network at that point in time. Also, the server load is affected (increases) when additional node is added to the server and this causes a decrease in the performance of the server as illustrated and explained in the analysis above.
[image:4.612.48.291.208.359.2]This paper has presented the modeling and simulation of a campus-wide local area network, which can be adopted for contextually similar scenarios. Its user-friendly GUI as well as its ease of setup and tweaking informed the choice of OPNET modeler. The import of network modeling and simulation becomes apparent as it helps in determining accurately the precise specifications for various network devices, as well as their anticipated performance after deployment in real-life scenarios.
[image:4.612.60.268.506.668.2]Figure 4. Network simulation using hubs and switch as the concentrator
International Journal of Emerging Technology and Advanced Engineering
Website: www.ijetae.com (ISSN 2250-2459, Volume 2, Issue 2, February 2012)5 References
[1] Network analysis and circuits, Arshad, M., b. 1979- / M. Arshad,
editor ISBN 978-1-934015-19-3.
[2] Local area networks, 2nd edition, Gerd E. Keiser, 2002-/ E. keiser editor, ISBN 0-07-239343-2, ISBN 0-07-112238-9 (ISE).
[3] Introduction to communications technologies: A guide for
non-engineers Stephen Jones and Ron Kovacs (2003), editors ISBN 0-8493-1266-3 (alk. Paper).
[4] Computer network - a system approach (3rd edition) Larry l.
Peterson and Bruce s. Davie (2003), editors: prepared by professor Emad Aboelela, university of Massachusetts / Dartmouth.
[5] CCENT/ CCNA ICNDI: official examination certification guide, 2nd
edition wendell Odom ( CCIE no: 1624).
[6] Use of network modeling tools in the nile system design Paul Avery,
editor. Department of Physics, University of Florida, Gainesville, FL, 32611 USA.
[7] Modeling and tools for network simulator Klaus wehrle, Mesut
Gunes, James Gros (2010), editors ISBN 978-3-642-12330-6 e-ISBN 978-3-642-12331-3 DOI 10.1007/978-3-642-12331.
[8] OPNET Technologies, Inc. OPNET Modeler Product Documentation,
release 1 18.
[9] V. Frost, B. Melamed (1994), “Traffic Modeling for
Telecommunications Networks”, IEEE Communications Magazine, 32(3):70-81.
[10] N. Alborz, M. Keyvani, M. Nikolic, L. Trajkovic, OPNET Work
2000.
Available:http://www.ensc.sfu.ca/people/faculty/ljilja/papers/opnetwo rk00_naz pdf.
[11] B. Kerkhoff, M. Kolon (2002), “Traffic Policing in Academic
Environments”, Juniper Network, PN# 350031-001 Berkeley’s “Commodity Network Bandwidth: Problems and Recommendations” (2002), Available: http://nac.berkeley.edu/bandwidth/
[12] NS-2 (2006). The Network Simulator – NS2. Retrieved February 18,
2006, from http://www.isi.edu/nsnam/ns.
[13] J. Guo, W. Xiang, S. Wang(2007), “Reinforce Networking theory
with OPNET simulation”, Journal of Information Technology Education, volume 6.