Detection under Noise Using Component
Improvement Strategy
E.O. Ogunti
1, W. Lawal
1, S.O. Olatunji
2,
W.O. Apena
1, B. Kareem
1,*1School of Engineering and Engineering Technology, Federal University of Technology, Nigeria 2Computer Science Department, University of Dammam, Saudi Arabia
Copyright © 2015 by authors, all rights reserved. Authors agree that this article remains permanently open access under the terms of the Creative Commons Attribution License 4.0 International License
Abstract
Inaccuracy in signal detection due to presence of noise in signal is responsible for fading/interference, this noise needs to be reduced for optimal signal detection, and detection must be accurate enough to minimize the risk of false alarm. A noise reduction model was developed to improve signal detection using component improvement strategy. The system was implemented on MATLAB software package. It can be seen from the results that for a given probability of false alarm (PFA), the detectionperformance increases monotonically with the ENR based on the balanced probability of not meeting target of 0.5. It can be generally concluded from the results of the study that signal detection could be fully enhanced with the application of six sigma component-based improvement system. This is an indication that component-based sigma improvement system played a significant role in signal detection performance.
Keywords Signal, Detection, Components,
Improvement1. Introduction
With a growing technology of mobile phones, people will always carry these devices anywhere and at anytime. Mobile phones, however, tend to cause interruptions because of the noise coming from the ringtone or the message tone that have been set by the users [1]. In some places such as prayer halls, library, meeting rooms, examination halls and hospitals, the use of hand phones is strictly forbidden because there is need to maintain silence [2]. Mobile phones need to transmit and receive the radio frequency (RF) signal in order to operate. This means there are possibility of jamming (make the system become stuck or in-operable) these RF signals in mobile phone in restricted areas. Jamming of communication signal is illegal in many countries, even when confined to privately owned spaces or secure facilities [3]. Shielding might be used to block RF signals from the required area, but
of the strategy in this study will determine how promising the system would be in the field of signal detection improvement and also how effective can it be in reducing the effects of noises on the signal detectability of a detector.
2. Materials and Methods
Detection performance of the detector was affected by both internal noises (noise in circuit components) and external noises (noises due to environmental conditions, which are, humidity, temperature, barriers, etc.) presence of noise in signal is responsible for fading/interference, All these lead to inaccuracy in signal detection The stated noises have ability to influence detection performance in two principal ways: detector detected signal and it was true detection, PD; and detector detected signal and it was false
detection, PFA.
Meanwhile, detection circuitry reported by Nicholas [22] with deficiencies of low coverage, weak detection and
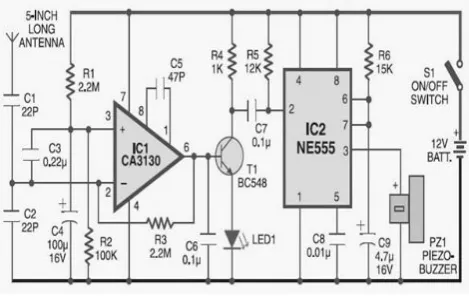
[image:2.595.315.550.148.296.2]accuracy modeling is shown in Fig. 1. In Fig. 2, the improved detector by Lawal [23] is given to include buzzer and microcontroller circuitries. The latter showed an improvement in terms of detection coverage and lead time but deficient in detection ability modeling.
Figure 1. Detector Circuitry
U1
8052
P1B0T2 1
P1B1T2EX 2
P1B2 3
P1B3 4
P1B4 5
P1B5MOSI 6
P1B6MISO 7
P1B7SCK 8
RST 9
P3B0RXD 10
P3B1TXD 11
P3B4T0 14
P3B5T1 15
XTAL2 18
XTAL1 19
GND
20 P2B0A8 21P2B1A9 22 P2B2A10 23 P2B3A11 24 P2B4A12 25 P2B5A13 26 P2B6A14 27 P2B7A15 28 P0B7AD7 32 P0B6AD6 33 P0B5AD5 34 P0B4AD4 35 P0B3AD3 36 P0B2AD2 37 P0B1AD1 38 P0B0AD0 39VCC 40
P3B2INT0 12
P3B3INT1 13
P3B6WR 16
P3B7RD 17
PSEN 29 ALEPROG 30EAVPP 31
5V
J2
Key = A
R1 1MΩ
R2 100kΩ
R3 1MΩ C1
0.22µF
C2 47µF
C3 0.1µF
Q1
BC548A Q2
BC548A
Q3
BC548A
R4 1kΩ
LED1
V1 12 V
V2 5 V U2
LMH6702MA
3
2 4 7
6
V3
10mVpk 900MHz 0°
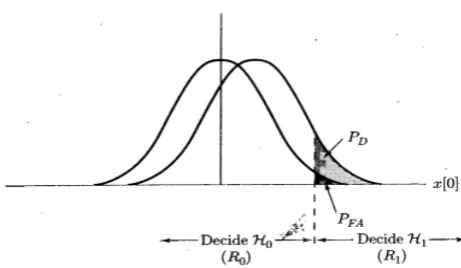
[image:2.595.70.547.334.686.2]Figure 3. Decision Region and Probability
2.1. Modeling of Signal Detection
In cell-phone signal detection system, certain parameter range is looked into; on which trial is made in deciding whether a target (signal) is present, H1 or target (signal) is
absent H0. Each hypothesis maps into a point in the
observation space corresponding to a set of N observations: r1, r2, r3,…,rN, and can be expressed in vector form
r
[5].The two known conditional probability densities P r H( / 1
] ]
) and P r H( / 0] ]
) , are the probabilistic transition mechanism points generators. They are used to develop decision rules or hypothesis, eitherH
0 orH
1 (Fig. 3). Therefore, each time the experiment is conducted one of four scenarios can happen:0 0
( : )
P H H =Prob. (decide
H
0 whenH
0is true), Prob.of correct non-detection
0 1
(
: )
P H H
=Prob. (decideH
0 whenH
1 is true), Prob. of missed detection PM1 1
( : )
P H H
= Prob. (decideH
1 whenH
1 is true), Prob. of detectionP
D.1 0
( :
)
P H H
= Prob. (decideH
1whenH
0 is true), Prob. of false alarmP
FAFrom the stated scenarios, the first and third alternatives correspond to correct choices, while the second and fourth alternatives correspond to errors. The method of processing received data
r
) depends on the selected decision criterion. In this study, the two criteria of interest,P
D andP
FA, were utilized on using Bayes’ and/or Neyman-Pearson (NP) approaches. The primary approaches to simple hypothesis testing are classical, based on Neyman-Pearson theorem [4], and Bayesian, based on minimization of Bayes risk [4-6,12]. Based on the selected criteria nature of the cell-phone signal detector, modified Neyman-Person criterion based on Bayes’ risk was utilized to optimize signal detection system.In Neyman-Pearson (NP) approach to cell-phone signal detection, the realization of a random variable whose
probability density function (PDF) is either
N
( )
0
1,
orN
( )
1
1,
is observed when the detector is on test. The notation N(
µ,σ2)
denotes a Gaussian PDF with meanµ
and variance
σ
2. For a sustainable hypothesis testing onµ
then the problem is to choose between two competing hypotheses expressed as follows [4]:0
:
,
1
:
01
=
=
Η
µ
H
µ
(1)Where
Η
0 is referred to as the null hypothesis andΗ
1 as the alternative hypothesis. The PDFs under each hypothesis with the difference in means may cause the PDF underΗ
1 to be shifted to the right. A reasonable approach might then be to decideΗ
1 ifx
[ ]
0
>
1/ 2
. This is because ifx
[ ]
0
>
1/ 2
, the observed sample is more likely ifΗ
1 is true, or ifx
[ ]
0
>
1/ 2
. This is equivalent (as given in Figure 3) to:[ ]
(
x
0
;
H
1)
p
(
x
[ ]
0
;
H
0)
p
.
Then detector compares the observed datum value with
1/ 2
, the latter called the threshold.With this scheme, two types of errors can be identified. If
1
Η
is decided butH
0 is true, that is a Type I error. On the other hand, ifH
0 decided butH
1 is true, then a Type II error is made. The errors,P
(
H
i;
H
j)
indicates the probability of decidingH
iwhenH
jis true. Then,(
H
1;
H
0)
Pr
{
x
[ ]
0
1
2
;
H
0}
P
=
These two errors are unavoidable to some extent but may be traded off against each other. The Type I error probability
(
H
1;
H
0)
P
is decreased at the expense of increasing the Type II error probabilityP
(
H
0;
H
1)
. It is not possible to reduce both error probabilities simultaneously. A typical approach then in designing an optimal detector is to hold one error probability fixed while minimizing the other (Figure 3). Let choose to constrainP
(
H
1;
H
0)
to fixed value, sayα
. The problem of Eq. 1 can be viewed as an attempt to distinguish between the hypotheses:[ ] [ ]
0
0
:
0
x
w
H
=
,H
1:
x
[ ] [ ] [ ]
0
=
s
0
+
w
0
Where
s
[ ]
0
=
1
andw
[ ]
0
N
( )
0
1,
, then the signal detection problem arise. DecidingH
1 whenH
0 is true can be thought of as a false alarm. As a result,P
(
H
1;
H
0)
minimize the other error
P
(
H
0;
H
1)
or equivalently to maximize1
−
P
(
H
0;
H
1)
. The latter isP
(
H
1;
H
1)
and in keeping with the signal, detection problem is called the probability of detection, denoted byP
D. This setup is termedthe Neyman-Pearson (NP) approach to hypothesis testing or to signal detection. The objective function is to maximize
(
H
1;
H
1)
P
P
D=
subject to the constraint(
1;
0)
=
α
.
=
P
H
H
P
FA Based on the stated illustration FAP
can be constrained by choosing the thresholdγ
since(
H
1;
H
0)
P
P
FA=
[ ]
{
0
;
0}
Pr
x
γ
H
=
dt
t
∫
∞
−
=
γπ
22
1
exp
2
1
)
(
γ
Q
=
Meanwhile, the goal of a detector is to decide either
H
0or
H
1 based on an observed set ofdata
{
x
[ ] [ ]
0
,
x
1
,...,
x
[
N
−
1
]
}
. LetR
1 be the set of values inR
N that map into the decisionH
1 or{
1 0}
1
x
:
decideH
orH
R
=
.
The set of points in
R
N that map into the decisionH
0 is the complement set of1
R
orR
0=
{
x
:
decideH
0orH
1}
.
Clearly,
R
0
R
1=
R
N sinceR
0 andR
1 partition the data space. TheP
FA constraint then becomesα
=
=
∫
p
x
H
dx
P
R FA 1)
;
(
0 (2)Now there are many sets
R
1 that satisfy Eq. 2, the goal is to choose the one that maximizes.
)
;
(
1 1dx
H
x
p
P
RD
=
∫
(3)The NP theorem indicates how to choose
R
1 for a givenp
(
x
;
H
0)
,p
(
x
;
H
1)
, andα
[4], Neyman-Pearson, NP theorem maximizeP
D for a givenP
FA=
α
.Then decide
H
1 if( )
(
(
)
)
γ
0 1 ; ; H x p H x p x
L = (4)
Where the threshold
γ
is found( ) { }
∫
=
γα
x Lx:
p
(
x
;
H
0)
dx
As stated earlier, internal and external noises have effects on the probability of signal detection. With special attention to internal noises-White Gaussian Noise (WGN), then general signal detection problem becomes:
[ ] [ ]
n
w
n
x
H
0:
=
n
=
0
,
1
,...
.,
N
−
1
[ ]
n
A
w
[ ]
n
x
H
1:
=
+
n
=
0
,
1
,...
.,
N
−
1
Where the signal is
s
[ ]
n
=
A
forw
[ ]
n
is WGN with varianceσ
2. The previous illustration (Eqs. 2-4) is a special case whereA
=
1
,N
=
1
, andσ
2=
1
. The current problem is a test of means of a multivariate Gaussian PDF. This is because:under
H
0, x ~N
(
0
,
σ
2I
)
, while underH
1, x ~N
(
A
,1
σ
2I
)
,where 1 is the vector of all ones. Hence, equivalently,
0
:
0
µ
=
H
,
1
:
1
A
H
µ
=
.
This parameter test of the PDF interpretation is used in describing the signal detection problem. Then the signal detector decides
H
1 if(
)
[ ]
(
)
(
)
[ ]
2 N 1 2 n 0 2 N 1 2 2 2 n 01 exp 1 x n A
N 2 2 2 1 N 2 1
2 exp x n
2 σ πσ γ πσ σ − − − − = − =
∑
∑
.This is similar to Eq. (4).
Taking logarithm of both sides results in
[ ]
N 1
2 2
n 0
1 2A x n NA In
2σ γ
−
− − +
=
∑
This simplifies to
[ ]
2N 1
2 2
n 0
A x n In NA
2 γ σ σ − + =
∑
.
Since,
A
>
0
, then[ ]
2 '1
0
2
1
σ
γ
+
=
γ
∑
− =A
In
NA
n
x
N
N n
.
(5)The signal based NP detector compares the sample mean
(
)
N 1[ ]
n 0
intuitively reasonable since
x
was thought of as an estimate of A. If the estimate is large and positive, then the signal is probably present. How large the estimate must be before willing to declare that a signal is present depends upon concerns that noise only may cause a large estimate [26]. Therefore noises can be reduced by adjustingγ
' with larger threshold values to controlP
FA, thereby increasingP
D.The detection performance was tested using the statistic:
( )
N 1[ ]
n 0
T x =1 N
∑
=− x n The means and variances are [4,5]:( )
( 0) N 1 [ ]
n 0
1 E T x ; H E w n
N − = = ∑
[ ]
(
)
N 1 n 01 E w n
N − =
∑
= 0
=
. Similarly, E(
T( )
x;H1)
=A and( )
(
0)
N 1[ ]
n 0
1
Var T x ;H var w n
N − =
∑
=
[ ]
(
)
=
∑
− = 1 0 2var
1
N nn
w
N
N
2σ
=
Similarly,
(
( )
)
N H x TVar ; 1 2
σ
=
This expressed uncorrelated noise samples. Thus,
( )
x
T
2 02 1 (0, ), ~ ( , ), a N underH N a
N A underH
N We have then
( )
{
o}
FA
T
x
H
P
=
Pr
γ
';
= N Q 2 '
σ
γ
(6)and
( )
{
';
1}
Pr
T
x
H
P
D=
γ
−
=Q AN
2 '
σ
γ (7)
D
P
can be related directly toP
FA by notingthat the
Q
function is monotonically decreasing since1
−
Q
is a CDF, which is monotonically increasing. Thus,Q
has an inverse denoted asQ
−1. As a result, the threshold was found from Eq. (5) as [4,5],(PFA) Q N2 1
'= σ −
γ
)
(
x
Q
is the probability of exceeding a given value (target) as: dt t x Q x ) 2 1 exp( 21 )( − 2
∏ =
∫
∞ From which, dx x x xQ( ) 21 exp(− 12 2)
∏ =
Then inverse, complementary Cumulative Distribution Function (CDF);
1
)
(
−x
Q
= 1-Q
(
x
)
t
dt
x
)
2
1
exp(
2
1
∏
−
2=
∫
∞ − and(
)
−=Q NQ−NP A
P FA D 2 1 2 σ σ
(
)
(
1 22)
σ NA PQ
Q FA−
= − . (8)
It is seen that for a given
P
FA the detection performancewould increase monotonically with
NA
2σ
2, which is thesignal energy-to-noise ratio (ENR) [4,5]. Based on hypothesis test, it was observed that the value of a test statistic T while decide
H
1 ifγ
' andH
0 otherwiseis expressed as:
T
2 0 0 2 1 1 ( , ), ~ ( , ), µ µ a N underH N a N underH N where,µ
1>µ
0hence, we wish to decide between the two hypotheses that differ by a shift in the means of T.
However, if
T
=
x
, then detection performance is characterized by the deflection coefficientd
2 [4].This is defined as
( ) ( )
( )
( 0)
2 0 1 2 ; var ; ; H TETH H
T E
d = − (9)
(
)
21 0
2 a
µ µ
− =In the case
µ =
00,
d
2=
µ α
12/
2 is interpreted as a signal-to-noise ratio (SNR). The dependence of detection performance ond
2 was verified by{
';
0}
Pr
T
H
P
FA=
γ
− = γ'σµ0
Q
{
'; 1}
PrT H
− =Q γ'σµ1
( )
+ −
=Q µ0 σQ−σ1PFA µ1
( )
−
−
= −
σµ µ1 0 1PFA
Q Q
And using Eq. (9), we have
( )
(
Q
1P
d
2)
Q
P
D=
− FA−
(10)Since,
µ
1>µ
0, the detection performance is monotonic with the deflection coefficient:2 2
2 NA σ
d = .
Each point on the curve corresponds to a value of
(
P
FA,
P
D)
for a given thresholdγ
'. Ifγ
' increases,P
FAdecreases but
P
D increases. This performance issummarily called the Receiver Operating Characteristics (ROC). The ROC adequately supported the detection probability relations:
{
det
ect
;
H
0}
P
P
FA= r{
det
ect
;
H
1}
P
P
D=
rAlternative way we used to summarize signal detection performance is by plotting
P
D againstP
FA.The improvement on probabilities of signal detection
P
Dwas further achieved by utilizing Total Quality Instrumentation Management (TQIM) on the components responsible for signal detection, which are capacitors, transistors, resistors, antennae, etc. (Fig. 2). Improvement strategies based on one-, two, three-, four-, five-, or six-quality sigmas (δ) were utilized on the components together [24]. With the new arrangement, eqn. (10) then becomes:
( )
(
2)
1
P
d
Q
Q
P
D=
− FAd
−
(11)The signal detection improving sigma (δ) was capable of reducing probabilities of false alarms by removing noises in the system. There is need to test the efficacy of this model by experimenting a detection system. The analysis based on alternative way of determining signal detection performance by plotting
P
D againstP
FA was utilized in this study.2.2. Model Testing
Information on cell-phone signal detector of the type shown in Fig. 2 was used. The experimental data obtained were hypothetically presented based on general detector behaviours with probabilities of false alarm ranging from 0 to 1. This indicated that when false alarm is 0, there is full (accurate) signal detection and if false alarm is 1, then detector is not functioning well. Accuracy of detection was improved upon by reducing false alarm through gradual removal of noises. Reduction of false alarms was carried out
by introducing component based sigma improvement strategies varied from one (1) to six (6) sigma under homogeneous behaviour of the system. In this arrangement, the range 0.69 to 0.0000034 would have reduced circuitry system failure probabilities [24]. The probability of exceeding the given value (target) Q(x) was also assumed a failure range, 0 – 1. The distance (d) between means of the two densities of hypothesis (Ho, H1) was taken in the range
0.5 to 2.0 in step of 0.5. Analysis of the optimized detection system was carried out on MATLAB computer software to determine the effect of sigma improvement system on the signal detection performance. The detection results generated based on stated variation of input parameters are presented in Figs. 4-10 for detection performance probabilities.
3. Results and Discussion
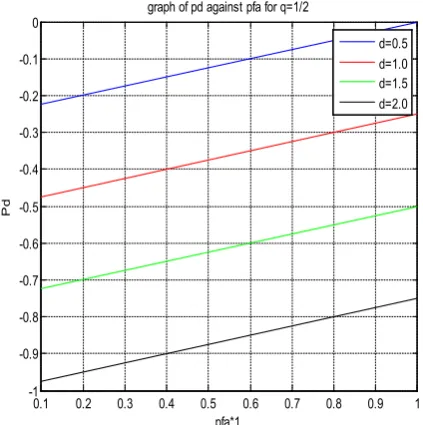
The results based on balanced probability of not exceeding the target of 0.5 were generated to illustrate performance of the system in terms of signal detection enhancement ability of the system with the deployment of signal sigma circuitry systems as improvement tools. Fig. 4 shows probability level of signal detection improvement with change in difference between the means of signal present and signal absent scenarios, at the probability of not exceeding the target (0.5). It can be seen from the stated results (Fig. 4) that for a given probability of false alarm (PFA), the detection performance
increases monotonically with the ENR. The results of the experiment indicated a conformance with the outcomes of previous studies [4,5].
0.1 0.2 0.3 0.4 0.5 0.6 0.7 0.8 0.9 1
-1 -0.9 -0.8 -0.7 -0.6 -0.5 -0.4 -0.3 -0.2 -0.1 0
Pd
graph of pd against pfa for q=1/2
pfa*1
[image:6.595.326.538.436.649.2]d=0.5 d=1.0 d=1.5 d=2.0
0 0.1 0.2 0.3 0.4 0.5 0.6 0.7 -1
-0.9 -0.8 -0.7 -0.6 -0.5 -0.4 -0.3 -0.2 -0.1 0
Pd
graph of pd against pfa for q=1/2
pfa*0.69
[image:7.595.320.548.76.295.2]d=0.5 d=1.0 d=1.5 d=2.0
Figure 5. Detection with One-Sigma Improvement System
0 0.05 0.1 0.15 0.2 0.25 0.3 0.35
-1 -0.9 -0.8 -0.7 -0.6 -0.5 -0.4 -0.3 -0.2 -0.1
Pd
graph of pd against pfa for q=1/2
pfa*0.31
[image:7.595.65.288.77.313.2]d=0.5 d=1.0 d=1.5 d=2.0
Figure 6. Detection with Two- Sigma Improvement System
0 0.01 0.02 0.03 0.04 0.05 0.06 0.07
-1 -0.9 -0.8 -0.7 -0.6 -0.5 -0.4 -0.3 -0.2
Pd
graph of pd against pfa for q=1/2
pfa*0.067
[image:7.595.320.546.333.543.2]d=0.5 d=1.0 d=1.5 d=2.0
Figure 7. Detection with Three-Sigma Improvement System
0 1 2 3 4 5 6 7
x 10-3 -1.1
-1 -0.9 -0.8 -0.7 -0.6 -0.5 -0.4 -0.3 -0.2
Pd
graph of pd against pfa for q=1/2
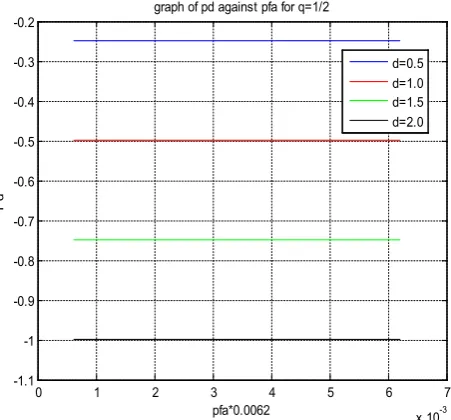
pfa*0.0062
d=0.5 d=1.0 d=1.5 d=2.0
[image:7.595.64.291.336.552.2]0 1 2 3 x 10⁻⁴ -1.1
-1 -0.9 -0.8 -0.7 -0.6 -0.5 -0.4 -0.3 -0.2
Pd
graph of pd against pfa for q=1/2
pfa*0.00023
[image:8.595.61.292.82.335.2]d=0.5 d=1.0 d=1.5 d=2.0
Figure 9. Detection with Five-Sigma Improvement System
0 0.5 1 1.5 2 2.5 3 3.5
x 10-6 -1.1
-1 -0.9 -0.8 -0.7 -0.6 -0.5 -0.4 -0.3 -0.2
Pd
graph of pd against pfa for q=1/2
pfa*0.0000034
d=0.5 d=1.0 d=1.5 d=2.0
Figure 10. Detection with Six-Sigma Improvement System Steadily and more satisfactorily improved signal detection performance was noticed and demonstrated by considerably monotonically increase in signal strength as the system was moving from two sigma (Fig. 6), three sigma (Fig. 7), four sigma (Fig. 8), five sigma (Fig. 9) to six sigma (Fig. 10). The outcomes generally revealed that signal detection could be fully improved with the application of six-sigma component-based improvement system.
4. Conclusions
The presence of noise in signal is responsible for fading/interference and inability to detect the signal accurately. The noise needs to be reduced for optimal signal detection. Detection must be accurate enough to minimize the risk of false alarm. A noise reduction model was developed to improve signal detection using component improvement strategy. The system was implemented on MATLAB software package. The detection circuit was developed to take care of deficiencies in the previous detection circuitries in the area of signal detection strength/probability through incorporation of component-based sigma improvement system. Signal detection strength modeling was developed using the improvement system under noises. Noises are classified as internal and external noises. Internal or thermal noises due to components’ temperature were considered in the study. Two methods of noise reduction were utilized, namely Gaussian mean-shifts of the hypothesized data and components’ sigma quality-based improvement strategy. It can be generally concluded from the results of the study that: though the hypothesized Gaussian mean-shifts brought improvement in signal detection by reducing noises in the system, but there was better improvement in signal detection with the application of components’ six sigma quality strategy. The deployment of six sigma system may demand high quality component-based circuitry. One cannot conclude yet on the strength of signal detection until thorough analysis of the components quality is carried out. Therefore, determination of signal detection strength would demand balancing the cost of component quality with strength of signal being detected. Detection accuracy based on signal strength improvement through component quality cost could be a good research area in future.
Acknowledgements
The authors wish to express gratitude to the Managements of the Federal University of Technology, Akure, and Rufus Giwa Polytechnic, Owo, Nigeria, for providing necessary facilities for this study.
REFERENCES
[1] W. Lawal, F.I. Oluwajobi, and E.O. Ogunti. Development of Unauthorized Cell-phone Usage Sniffing System using Embedded System. Proceedings of the International Conference on Advances in Computing, Electronics and Electrical technology- CEET 2014, pp. 208-212 (2014). [2] W. Lawal, A.F. Akinrinmade, and S.O. Ijarotimi. Effects of
[image:8.595.64.293.368.627.2][3] W. Lawal and E.O. Ogunti. An Evaluation of Mobile Phone usage Restriction in Selected Public Places in Akure, Nigeria. Book of Proceedings, 4th International Conference on Engineering research and Development (ICERD 2012), University of Benin, Benin City, Nigeria (2012).
[4] S.M. Kay. Fundamental of Statistical Signal
Processing-Detection Theory, Prentice Hall, New Jersey (1998).
[5] H.L. Van Trees. Detection, Estimation, and Modulation Theory, Part I: Detection, Estimation, and Linear Modulation Theory. pp. 19-86. John Wiley & Sons, Inc. (2001). [6] S.M. Kay. Fundamental of Statistical Signal Processing-
Estimation Theory, Prentice Hall, New Jersey (1993). [7] O.S. Adewuyi, W. Lawal and E.O. Ogunti. Performance
Analysis of OFDM in Combating Multipath Fading. IOSR Journal of Electronics and Communication Engineering (IOSR-JECE), 6 (2) 99-107(2013).
[8] W. Lawal, S.O. Adewuyi, and E.O. Ogunti. Effect of Cyclic Prefix on OFDM over AWGM Channel. International Journal of Innovative Research in Advanced Engineering (IJIRAE), 1 (9) 185-191 (2014).
[9] Y.W. Lau. Noise in Accounting Information: The Signal Detection Theory Perspective. Int. Journal of Economics and Management 2(1): 179 – 193 (2008).
[10] T. Kailath, and H.V. Poors. Detection of Stochastic Processes. IEEE Transactions on Information Theory, 44 (6) 2230-2259 (1998).
[11] R. Tandra. Fundamental Limits on Detection in Low SNR. A Thesis Submitted in Partial Satisfaction of the Requirements for the Degree of Master of Science in Engineering, Electrical Engineering and Computer Sciences in the Graduate Division of the University of California, Berkeley, Spring 2005 (2005). [12] S.V. Veseghi, S.V.: Advanced Digital Signal Processing and Noise Reduction, Second Edition, pp. 356- 377. John Wiley & Sons Ltd. (2000).
[13] S.V. Vaseghi and , P.J.W. Rayner. Detection and Suppression of Impulsive Noise in Speech Communication Systems. IEE Proceedings, 137 (1) 38-46 (1990).
[14] D. Kundu. Estimating the Number of Signals In The Presence of White Noise. Journal of Statistical Planning and Inference. 90 (1) 57 – 68 (2000).
[15] G. Shevlyakov and K. Kim. Robust Minimax Detection of a Weak Signal in Noise with a Bounded Variance and Density Value at The Center Of Symmetry. IEEE Transactions on Information Theory, 52 (3) 1206- 1211 (2006).
[16] S.M. Saberali, and H. Amindavar. Spread Spectrum Signal
Detection In Overlay Systems Using Maximum Entropy PDF Estimation Based on Fractional Moments, IEEE ICASSP 2007, III, pp. 1269-1272 (2007).
[17] B.M. Turner. Signal Detection Theory: A Proposal for a Nonparametric Model. A Thesis Presented in Partial Fulfillment of the Requirements for the Degree Master of Arts in the Graduate School of the Ohio State University, 2009 (2009).
[18] A. Broumandan. Enhanced Narrowband Signal Detection and Estimation with a Synthetic Antenna Array for Location Applications. A Thesis Submitted to the Faculty of Graduate Studies in Partial Fulfillment of the Requirements for the Degree of Doctor of Philosophy, University of Calgary, September 2009 (2009).
[19] D. Pastor and F.X. Socheleau. Algorithms Based On Sparsity Hypotheses For Robust Estimation of the Noise Standard Deviation in Presence of Signals with Unknown Distributions and Occurrences. Collection des rapports de recherché de Telecom Bretagne, RR-2010001-SC, hal-00703291, version 1-1 June 2012, Telecom Bretagne, France. (2012).
[20] H. Chaouech and R. Bouallegue. Multiuser Detection in Asynchronous Multibeam Communications. Inter. Journal of Wireless & Mobile Networks (IJWMN). 4 (1) 21-34 (2012). [21] T.J. O'shea, T.C. Clancy and H.J. Ebeid. Practical Signal
Detection and Classification in Gnu Radio. Research Conducted at Laboratory for Communication Sciences, US Department of Defense 2014 (2014).
[22] W.S. Nicholas. Study of Cellular Phone Detection
Techniques, M.Sc. Dessertation, Computer and electronics Engineering, Department of Dissertations & Student Research in Computer Electronics & Engineering, University of Nebraska-Lincoln (2011).
[23] W. Lawal. Development of Unauthorized Cell-Phone Usage Sniffing System. A Thesis Submitted to the School of Postgraduate Studies in Partial Fulfillment of the Requirements for the Degree of Master in Engineering in Electrical and Electronics Engineering, the Federal University of Technology, Akure, Nigeria, December 2012 (2012).
[24] B. Kareem. Evaluation of Failures in Mechanical
Crankshafts of Automobile based on Expert Opinion, Case Study in Engineering Failure Analysis, 3(1) 25-33 (2015). [25] J. Lehtomäki, Analysis of Energy Based Signal Detection, A
Dissertation in the Faculty of Technology, Department of Electrical and Information Engineering, University of Oulu, Oulu University Press, Finland, 102pp (2005)