Journal of Chemical and Pharmaceutical Research, 2014, 6(7):415-424
Research Article
CODEN(USA) : JCPRC5
ISSN : 0975-7384
Analysis of crystallization behaviour of ge2sb2te5 used in optical
and electrical memory devices
Wanhua Yu
1, Xiangde Yi
1and C. D. Wright
21University of Science and Technology Beijing, Beijing, China 2
School of Engineering, Computer Science and Mathematics, The University of Exeter, Exeter, EX44QF, UK _____________________________________________________________________________________________
ABSTRACT
We investigated three different modelling approaches to simulate crystallization behaviour of Ge2Sb2Te5 used in optical and electrical phase-change memories. First of these models is based on Johnson-Mehl-Avrami-Kolmogorov (JMAK) formalism to calculate the fraction of crystallized material during isothermal anneals. In the literature this model is widely used, but parameters of the model reported by different investigators varies wildly. We have showed that these discrepancies can be attributed to the ill-use of the theory. In order to overcome the restrictions put by the JMAK theory generalizations based on the classical nucleation theory have been suggested. Material parameters required by the theory, like viscosity, diffusivity, fusion enthalpy of Ge2Sb2Te5, have been deduced from published experiments. Uncertainty in the material parameters in combination with approximate expressions used by the classical nucleation theory, however, lead us to suggest a comprehensive model based on rate equations. Although it is more complicated this modelling approach has yielded more favourable and reliable results. We have discussed different simulation-experiment comparisons to illustrate the capabilities of the model.
Key words: computer simulation, phase change, data storage
_____________________________________________________________________________________________
INTRODUCTION
During the recent decade there has been great interest in chalcogenide amorphous materials for applications in optical data storage. Most prominent and widespread use of such materials is in the rewritable phase change optical memory disks (CD-RW) and in rewritable digital versatile disks (DVD-RW). In the past utilization of these materials in non-volatile electrical memory devices was reported and, more recently, large scale integration of this novel electrical memory has been successfully demonstrated [1-4]. Both optical and electrical data storage rely on reversible phase transformation of chalcogenide material between amorphous and (poly)crystalline states. On optical disks data recording is achieved by writing an amorphous dot on a crystalline film by local melting with a focused laser beam. When the laser is switched off rapid quenching of melt results in amorphous solidification of the dot. Since an amorphous dot has a lower reflectivity than the surrounding crystalline background the written bit can be read by a low power laser. Conversely, erasing of the dot is achieved by heating the amorphous dot to temperatures less than the melting point and allowing the amorphous dot to crystallize. Of the phase transformations during writing and erasing dots the crystallization is much slower than the amorphization and needs to fulfil two opposing requirements: during writing it should be sufficiently slow so that a successful amorphization can be obtained; during erasing, however, a fast crystallization is desirable to assure a fast erasure. Therefore, crystallization of the phase change material can be considered as rate limiting process to obtain a fast data transfer and its optimization is of utmost importance.
______________________________________________________________________________
caused by the current pulse. Amorphous phase is obtained by a pulse sufficiently large to achieve melting. Subsequently a rapid quench allows the material to become amorphous. Also crystallization is initiated by a pulse heating the device to sufficiently high temperatures. The state of memory cell is then read out non-destructively by measuring the cell’s electrical resistance. In an electrical phase change memory device data storage utilises the fact that the crystalline phase has a low resistivity in comparison to the amorphous phase. The difference in resistivity between two phases can be more than three-order-of-magnitude [5]. As in optical phase change memories speed of a memory cell is largely determined by the crystallization step.
In the last decade several chalcogenide material compositions, mainly Te based binary and ternary systems, have been studied to fulfil a number of requirements for a suitable phase change medium. Crystallization without phase separation is one of these requirements. It allows fast crystallization by eliminating the necessity of long distance atomic motion. Alloys like In-Sb-Te and Ge-Sb-Te have been investigated and found to be suitable for optical and electrical phase change memories. Among others Ge2Sb2Te5 is known to show both high speed phase transformation and high degree of cyclability without any compositional changes between different phases.
There has been considerable number of experimental studies to investigate amorphous-crystalline and reverse transformations in phase change media. Large proportion of these studies has been on laser induced crystallization in nanosecond scale and on overall characteristics of crystallization/amorphization [6]. Since it is not possible to measure thermal response of the material to laser heating in nanosecond scale one could not gain basic information on crystallization behaviour of the phase change material, i.e., one cannot obtain information how crystal nucleation and growth occur and what the underlying mechanisms and parameters affecting the phase transformation are. There were few experimental reports where thermal environment during crystallization were carefully controlled. These experiments were either isothermal [6-7] or ramped thermal anneals [8] of phase change materials to measure the crystallization kinetics. Unfortunately this type of experiments can be carried out in a very limited range of temperature (typically between 120 ºC and 150 ºC): at lower temperatures too long while at higher temperatures far too short measurement times make experiments unfeasible to perform.
In the literature there are much fewer studies concerning theoretical efforts and approaches to modelling the crystallization behaviour of phase change media. Existing models [9-12], in general, geared toward to capability of simulation of mark formation during a laser annealing. Applicability and validation of models used in these simulations have not been questioned or justified and models were often based on ad hoc assumptions. Despite the shortcomings simulations, and models behind these simulations, can be very useful to understand mechanisms controlling the crystallization process. A physically sound model would easily fill gaps of experimental studies and could test conditions experimentally inaccessible. In this article we report three different approaches for modelling the crystallization behaviour of phase change media. Although interrelated these models differ considerably in information content they have. We discuss, in addition to details of these models, merits, applicability, and weaknesses of these models when they are used for simulation studies of phase change media. For calculations presented here we have chosen Ge2Sb2Te5 (GST) as phase change material. This choice was for simplicity and convenience, and models are applicable to any other phase change material with appropriate use of model parameters of the material concerned.
MODELS FOR GE2SB2TE5 CRYSTALLIZATION KINETICS AND DISCUSSIONS
The knowledge of crystallization kinetics is very important for understanding of both amorphization and crystallization of GST. Amorphization of molten GST may be seen as its reluctance to undergo crystallization, i.e., it is a competition between crystallization and cooling. In contrast, overall crystallization of GST is a complex process involving nucleation and growth of separate crystallites.
The existing descriptions of crystallization kinetics are based mainly upon two theories: the Johnson-Mehl-Avrami-Kolmogorov (JMAK) theory, and the classical nucleation theory. The JMAK theory allows one to calculate the volume fraction of crystallized material in terms of crystal nucleation and growth rates while the classical nucleation theory provides means to estimate the cluster nucleation and growth rates, and crystallite size distributions. Both theories have inevitable limitations and one needs to be aware of these limitations in order to apply them to crystallization process in GST.
THE JMAK THEORY
The volume fraction of the transformed material, , under isothermal annealing condition is described by the JMAK equation
]
)
(
exp[
1
=
)
(
nt
k
t
x
(1)should be an integer providing information on the dimensionality of the crystallization process. The effective rate constant describing the nucleation and growth rates is generally given by an Arrhenius equation
exp
=
)
(
T
k
E
ν
T
k
B A
(2)
where ν is the frequency factor, EA is the activation energy, T is the absolute temperature and kB is the Boltzmann constant. A JMAK plot is obtained when versus is plotted producing a straight line with slope n and intercept .
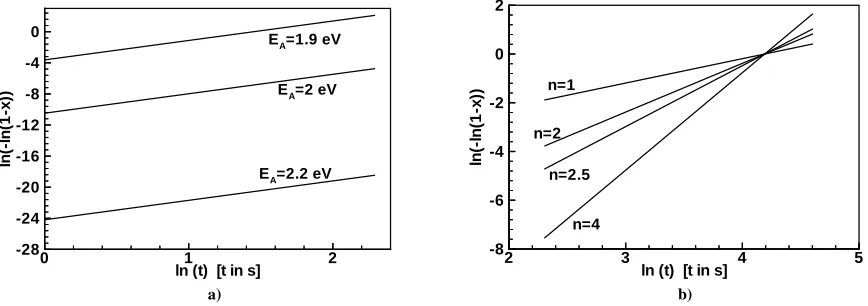
In the literature there are several studies of isothermal annealing of GST interpreted using the JMAK theory. It is also worth to add studies to measure the activation energy EA using Kissinger analysis. Reported activation energies deviates generally around 2 eV with few exceptions: 2 eV, 1.8 eV, 2.26 eV, 2.23 eV, 2.3 eV, 2.24 eV, 2.15 eV, 3eV, 0.81 eV, 1 eV. Fig. 1a shows JMAK plots at 150ºC for ν=1022 s-1 and n=2.5 for different activation energy values. Although differences in the activation energy are small, variations in total crystallized material at a given time can be huge. As we see below this activation energy of about 2 eV is very close to activation energy of crystallization growth rate estimated from diffusion coefficient of GST. Analysis techniques used to determine EA are based on assumption of an Arrhenian temperature dependence for the crystallization kinetics. Since the kinetics is partly controlled by the nucleation rate, which is non-Arrhenius, the use of such analysis techniques is not justified and can only yield information on transformations controlled by growth rate. Hence the activation energy obtained is approximately equal to the activation energy of growth. Strictly speaking, also growth is non-Arrhenius so that the activation energy obtained would depend on the temperature range over which the experiments were carried out. It is, therefore, not justified to split the observed activation energy between nucleation and growth parameters using ad hoc assumptions, as suggested in Ref. [13].
0 1 2
ln (t) [t in s] -28
-24 -20 -16 -12 -8 -4 0
ln
(-ln
(1
-x
))
EA=2.2 eV
EA=2 eV
EA=1.9 eV
2 3 4 5
ln (t) [t in s] -8
-6 -4 -2 0 2
ln
(-ln
(1
-x
))
n=4 n=2.5 n=2
n=1
[image:3.595.81.515.380.533.2]a) b)
Fig. 1: JMAK plots showing the effects of frequently quoted values of JMAK parameters of a) the activation energy EA (n=2.5), and b) Avrami coefficient (EA= 2 eV). For both plots the frequency factor ν was assumed to be 1022 s-1.
There are fewer reported values for the Avrami coefficient, n, and they are less consistent (see Fig. 1b): 2.5, 4.3, 1, 2, 3.6-5.8. While the agreement for n is bad it becomes worse for the frequency factor ν: it varies between 1017 and 1086 s-1 [6, 13].
______________________________________________________________________________
to say the that use of Eq. (1) to interpret experiments on the crystallization of GST is not legitimate. This would explain differences in the effective activation energy and large deviations in the Avrami coefficient one finds in the literature.
The restrictions imposed on the use of JMAK equation could be overcome by making generalizations. For isothermal crystallizations Eq. (1) can be written explicitly as
1)
+
(m
t
U
I
C
exp
1
=
x(t)
1 + m m
(3)
where I is the crystal nucleation rate, U is the crystal growth rate, C is a geometric factor, and m is an integer corresponding to the dimensionality of the crystallization. A second generalization can be made to consider transient effects. For example, 3-D spherical growth can be taken into account by rewriting Eqs. (1) and (3) as
g
n
σ
r
π
G
=
4
∆
∆
2 (4)where is the radius of a crystalline cluster at a time t which nucleated at time t0. The use of Eq. (3) or Eq. (4) requires the nucleation and growth rates to be known as input parameters. These can be obtained from the classical nucleation theory in connection with material and thermodynamic parameters of GST.
MODEL FOR NUCLEATION AND GROWTH RATES OF GST
Crystallization often starts with the formation of small, unstable clusters of new phase. Eventually some clusters reach to a critical size beyond which they are stable such that they can grow rather than dissolve. Homogeneous nucleation occurs at a random position in the original phase while heterogeneous nucleation takes place at preferential sites like surfaces, interfaces, impurities. The classical nucleation theory derived for condensed systems by Turnbull and Fisher using the Becker-Döring formalism assumes that formation of a cluster of new phase requires a free energy ∆G given by
g
n
r
G
=
−
∆
∆
π
2σ
4
(5)where σ is the interfacial energy density between amorphous and crystalline phases and r is the cluster radius. Here it has been assumed that clusters are of spherical shape such that the relation between cluster radius and number of GST molecules (monomers) in the cluster is
m
v
r
n
3
3
4
π
=
(6)where vm is the volume of a monomer, which can be easily estimated from the density [14- 15] and the molar weight of the material (vm=2.9x10⁻²² cm3). ∆g in Eq. (5) is the bulk free energy difference per GST molecule between two phases. It has been calculated using the approximation proposed by Singh and Holz as
+
−
∆
=
∆
T
T
T
T
T
T
H
v
g
m m m f
m
6
7
(7)
where Tm is the melting temperature of the GST (=900 K), ∆Hf is the enthalpy of fusion at melting point. There is no reported value for ∆Hf of GST in the literature. We estimated it using data obtained from differential scanning calorimetry experiments. using data from Refs and [16]. We found ∆Hf to be in the range of 610-625 J/cm3.
The free energy given by Eq. (5) increases with n up to a maximum critical value nc given by
3 3 2
3
32
g
v
n
c m∆
=
π
σ
(8)2 3 2
3
16
g
v
G
mc
∆
=
∆
π
σ
(9)The steady state rate of nucleation of crystalline GST clusters, Iss, i.e., the number of newly formed nucleus per unit time and volume, is approximated by
∆
exp
)
1
(
4
=
2/3T
k
G
Z
n
γ
f
I
B c c
ss
and
c B
T
n
k
π
g
Z
6
∆
=
(10)where f(1) is the concentration of GST molecules, Z is the Zeldovich factor, and γ is the molecular jump frequency at the interface between amorphous and crystalline phases. This attempt frequency can be, to a first approximation, assumed to be equal to the diffusional jump frequency of GST molecules, D, giving
2
λ
γ
=
D
(11)where λ is the jump distance taken to be same as the nearest neighbour distance in GST (=2.99 Å [14]). In absence of data on diffusion coefficient of GST Stokes-Einstein relationship is invoked to relate the diffusion coefficient to viscosity of GST, η, as
η
λ
π
3
T
k
D
=
B (12)Data on the viscosity of GST in the literature are rare; in particular at lower temperatures. We estimated the viscosity of GST using published data on Ge-Te and Sb-Te systems. According to studies of Herwig et. al. [18] the viscosity of Te based binary eutectics changes abruptly at about eutectic point (Fig. 2). For Ge15Te85 melt viscosity is characterized by an activation energy of about 0.2 eV while at lower temperatures the viscosity has an activation energy of about 1.85 eV. This is due to strong tendency of Te-rich alloys to increase atomic association when the temperature decreases. Both regions of viscosity plot can be described by Arrhenius type equations. We described low temperature data as
±
×
=
−T
k
eV
GeTe
B
15
.
0
85
.
1
exp
10
94
.
1
)
(
14η
(13)Another evidence for the value of the viscosity or of diffusion coefficient of GST comes from measurements of the incubation time during crystallization. In Refs. [6] and [13] it has been pointed out that at lower temperatures a measurable time for incubation exists and it depends on temperature. According to Kashchiev [17] the incubation time, τ, is determined mainly by the rate of molecular rearrangements during nucleation and can be approximated as
2 3 / 2 3
1
Z
n
cγ
π
τ
=
(14)The temperature dependence of τ is largely determined by the temperature dependence of γ. Data on the incubation time of GST (Fig. 3) indicates that it can be largely described by an Arrhenius type equation with an activation energy of 2±0.1 eV. Therefore we estimated the viscosity of GST by combining the viscosity data of GeTe and the results of incubation time measurements of GST as
±
×
=
−T
k
eV
B
1
.
0
2
exp
10
94
.
1
14______________________________________________________________________________
0.9 1 1.1 1.2 1.3 1.4 1.5 1.6 1000/T (K-1)
10 20 30 40 50
V
is
c
o
s
it
y
(m
P
a
s
)
0.2 eV
1.85 eV Ge15Te85
2.4 2.45 2.5 2.55 2.6
1/T (103K-1) 102
103 104
in
c
u
b
a
ti
o
n
ti
m
e
(s
) 2 eV
[image:6.595.82.525.86.241.2]Fig. 2 Fig. 3
Fig. 2: The viscosity of Ge15Te85 as a function of reciprocal temperature. Data points (symbols) were extracted from measurements reported in Refs. [18]. Continuous lines show best fit to data
Fig. 3: Incubation time during crystallization of Ge2Sb2Te5 as a function of reciprocal temperature. Data points (symbols) were taken from Ref. [6]. Continuous line is best fit to data.
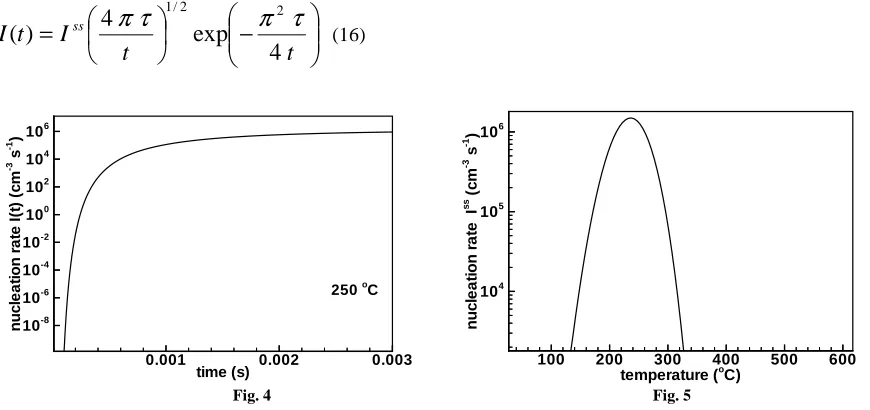
In Fig. 4 the steady state nucleation rate of crystalline clusters of critical size [Eq. (9)] is depicted as a function of temperature. For calculations the unknown value of the interfacial energy σ has been treated as a free parameter and a value of 0.1 J/m2 was used. Results in Fig. 4 shows that the steady-state nucleation rate has a maximum of about 250ºC. In practice the steady-state is reached after the incubation time. As mentioned above GST shows substantial incubation times during crystallization. Therefore transient effects must be taken into account for calculations of the nucleation rate. Most rigorous analytical treatment to calculate the transient effects is given by Kashchiev; he has proposed the nucleation rate for isothermal annealing conditions to be
−
=
t
t
I
t
I
ss4
exp
4
)
(
2 2
/ 1
τ
π
τ
π
(16)
0.001 0.002 0.003 time (s)
10-8
10-6
10-4 10-2 100
102
104 106
n
u
c
le
a
ti
o
n
ra
te
I(
t)
(c
m
-3
s
-1 )
250oC
100 200 300 400 500 600 temperature (o
C) 104
105 106
n
u
c
le
a
ti
o
n
ra
te
I
s
s (c
m
-3
s
[image:6.595.75.510.393.598.2]-1 )
Fig. 4 Fig. 5
Fig. 4. Steady-state nucleation rate [Eq. (9)] of Ge2Sb2Te5 as a function of temperature Fig. 5. Transient nucleation rate [Eq. (16)] of Ge2Sb2Te5 as a function of time for 250ºC
Which has been plotted in Fig. 5 as a function of time for 250ºC. It can be seen from the figure that a considerable time is required to reach the steady state. For 250ºC, at which the nucleation rate is maximum, it is necessary to wait up to 2 ms to reach the steady state. This incubation time is much larger than operating times used in memory devices suggesting that whole crystallization process might be proceeding in a transient fashion during the operation of devices.
)
(
)
(
n
d
n
g
dt
dn
=
−
(17)
where the growth and dissolution rates are given explicitly in the next section. Kelton and Greer approximated Eq. (17) to find the average growth rate of a cluster of radius r as
−
∆
=
mB m
v
r
g
T
k
v
D
dt
dr
σ
π
π
2
2
1
sinh
4
3
16
1/32 (18)
100 200 300 400 500 600 temperature (oC)
10-8
10-6 10-4 10-2
100
102
g
ro
w
th
ra
te
(c
m
/s
)
1
2 3 5
10
101 102 103 cluster size (number of GST molecules n) 107
109
1011
1013
1015
1017 1019 1021
c
lu
s
te
r
d
e
n
s
it
y
(c
m
-3 )
[image:7.595.80.510.152.352.2]Fig. 6 Fig. 7
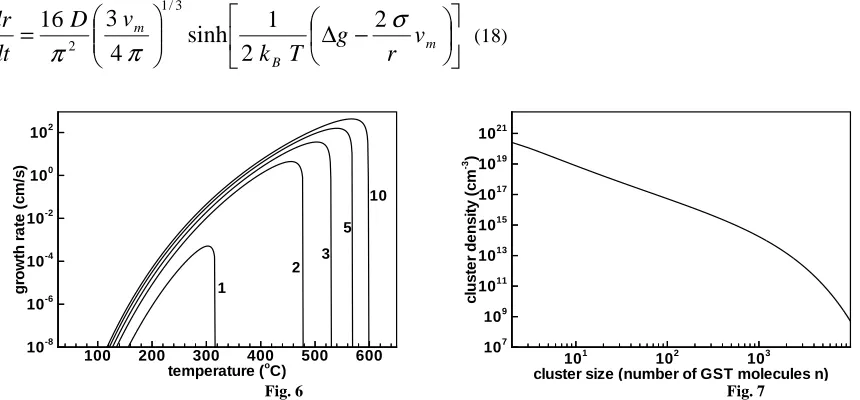
Fig.6: Growth rate of crystalline clusters as a function of temperature. Number next to each graph represents radius of cluster as nanometer.
Fig.7: Size distribution function of crystalline clusters describing density as a function of cluster size.
Fig. 6 shows the growth rate of clusters of different sizes as a function of temperature. Maximum of growth rate depends on the size of the cluster. For small clusters it is at around 300ºC while with increasing size it shifts toward higher temperatures. It should be pointed out that Eq. (18) agrees with Eq. (17) for clusters considerably larger than the critical size. Therefore for smaller sizes one has to employ Eq. (17).
It should be kept in mind that above descriptions of both the nucleation rate and the growth rate are approximate and are derived under simplifying assumptions. The derivation of the nucleation rate assumes that 1) loss of critical nuclei due to growth is balanced by formation of new ones. While this is true for the initial stages of crystallization in later stages the nucleation rate decreases due to continuous depletion of amorphous material. 2) The resulting steady-state number is also the equilibrium number nc. 3) Shrinkage of nuclei larger than critical size is negligible. This is true for cluster much larger than critical size. For nuclei of critical size or near critical size a finite probability exists for dissolution.
Furthermore there is no easy and acceptable way to combine the nucleation and growth rate calculations. One may use Eq. (4) but this requires to fulfil the restrictions of the JMAK formalism. Simulation of optical and electrical phase-change memory devices demands the handling of nucleation and growth in very short time scales where the crystallization process determined largely by transient and non-equilibrium conditions. It is therefore necessary to develop a model which treats the nucleation and the growth simultaneously by considering transient effects fully.
MODEL BASED ON RATE EQUATIONS
During nucleation in a real system there will be not only clusters of critical size but a distribution of clusters of different sizes. These clusters will interact with each other and this interaction will establish the progress of crystallization process. Therefore instead of considering only clusters of critical size we should take into account both subcritical and supercritical clusters to establish the size distribution. Considering that smallest possible cluster size is two GST molecules, i.e., a GST dimer, assuming the interactions among different sizes to be through monomers at a given time, a cluster can gain or lose a GST monomer to grow or dissolve, respectively. Possible interactions that a cluster of (n) GST molecules can have are then
)
1
(
)
(
)
1
(
n
−
←
→
±1n
←
→
±1n
+
(19)______________________________________________________________________________
clusters of size (n), then
)
,
1
(
)
,
1
(
)
,
(
)
,
(
)
,
(
)
,
(
)
,
1
(
)
,
1
(
)
,
(
t
n
f
t
n
d
t
n
f
t
n
g
t
n
f
t
n
d
t
n
f
t
n
g
t
t
n
f
=
−
−
−
−
+
+
+
∂
∂
for
n
≥
2
(20)where g(n,t) and d(n,t) are the growth and the dissolution rates of size (n), respectively. To solve the set of rate equations given by Eq. (20) one needs to determine the growth and dissolution rates. We modelled them following the work Turnbull and Fisher and using the theory of reaction rates as
∆
−
=
→ +kT
G
t
f
r
t
n
g
n n2
exp
)
,
1
(
4
)
,
(
π
2λ
γ
1(21)
∆
=
+
+→kT
G
t
f
r
t
n
d
n n2
exp
)
,
1
(
4
)
,
1
(
π
2λ
γ
1 (22)where f(1,t) is the concentration of GST monomers at a given time. Energy terms in Boltzmann factors have been defined as Gibbs free energy differences between sizes (n) and (n+1) such that
)
,
(
∆
)
,
1
+
(
∆
=
∆
G
n→n+1G
n
t
G
n
t
(23)where for ∆G Eq.(5) was used. Solution of set of equation given by Eq.(20) yields the size distribution function of crystalline clusters of GST. A typical solution shown in Fig. 7 where density of clusters as a function of cluster size n was plotted. As one can see that a very high concentration of small clusters was followed by larger clusters whose concentration decreases in an exponential fashion as cluster size increases. In order to find experimentally observable quantities like amount of crystallized material one needs to integrate the size distribution function. During calculations we have taken into account that available amorphous material for crystallization was continuously depleted, i.e., conservation of matter was considered and monomer concentration was calculated according to
∫
max 2)
,
(
)
0
,
1
(
=
)
,
1
(
ndn
t
n
f
f
t
f
(24)where f(1,0) is the initial concentration of GST monomers.
Since we have not made any restrictions for the nucleation and growth above expressions for the reaction rates can be regarded for the homogeneous nucleation. In order to take into account heterogeneous effects we considered “spherical-cap model”. Following this model we assumed that the nucleation of crystalline clusters takes place preferentially at the substrate-GST interface where energetically favourable places are nucleation sites. The shape of nuclei is determined not only by the radius but also by the angle θ between the nucleus surface and the substrate. For simulations we considered θ to be a free parameter and determined its value for each different substrate by comparing simulation results with experimental ones.
We solved model equations numerically using appropriate initial and boundary conditions. For all calculations presented here we assumed that initial stage of the material was always amorphous and there were no existing cluster distribution. The number of rate equations nmax used during calculations depends on the experiment simulated and varies between 104 and 107.
results on the incubation time of GST as a function of the annealing temperature, as shown in Fig. 9. The incubation time decreases exponentially with the increasing temperature. For annealing times smaller than the incubation time the crystallisation proceeds in a transient fashion while for times longer than the incubation time a steady-state nucleation and growth is established. Simulation results indicate that even for higher temperatures, e.g.,, 200<T<400ºC, where during the operation of phase-change memory devices crystallisation would mainly take place, the incubation times will be in orders of several hundred microseconds. This implies that the entire phase-change process of a phase-change memory device takes place transiently.
100 101 102
time (min) 0
0.2 0.4 0.6 0.8 1
c
ry
s
ta
ll
iz
e
d
fr
a
c
ti
o
n
140oC 131o
C 119o
C
120 125 130 135 140 Temperature (o
C) 0
2000 4000 6000
In
c
u
b
a
ti
o
n
ti
m
e
(s
)
[image:9.595.86.508.169.316.2]a) b)
Fig. 8: Crystallization behaviour of Ge2Sb2Te5 a) during isothermal anneals at 119ºC, 131ºC and 140ºC b) incubation time as a function of temperature. Lines are simulation results and symbols are from experiments reported in Ref. [6].
120 140 160
temperature (o
C) 0
0.2 0.4 0.6 0.8 1
c
ry
s
ta
ll
iz
e
d
fr
a
c
ti
o
n
Ge2Sb2Te5 3o
C/min on silicon
150 175 200 225
temperature (o
C) 0
0.2 0.4 0.6 0.8 1
c
ry
s
ta
ll
iz
e
d
fr
a
c
ti
o
n
Ge2Sb2Te5 on SiN
10o
C/min
a) b)
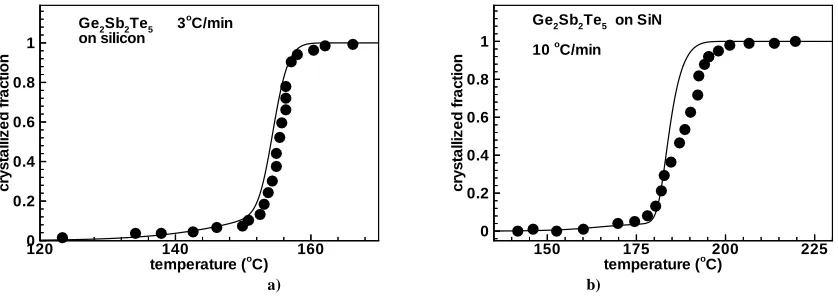
Fig. 9: Experimental [8] (symbols) and calculated (lines) results of crystallized fraction of Ge2Sb2Te5 as a function of temperature during ramped anneals for a) Ge2Sb2Te5 on silicon for 3ºC/min ramp rate; b) Ge2Sb2Te5 on SiN for 10ºC/min ramp rate.
Non-isothermal treatments, during which the temperature increases with a constant rate, are common in the literature to study phase-change behaviour of GST. Depending on the rate of temperature the onset of crystallisation shifts: the higher the rate, the higher the onset-temperature. In Fig. 10 one can see two different experiments and corresponding simulations. In one case, where ramp rate is 3ºC/min, crystallisation takes off at about 155ºC while a ramp rate of 10ºC/min results in a higher crystallisation-onset of about 180ºC. In Fig. 10 we can also see the effect of different substrates. In Fig. 10b GST layer was sandwiched between two SiN layers. For the simulation of this structure a value of θ=87º was used to obtain good agreement with the experiment. Since we could explain all heterogeneous effects with a simple “spherical cap” model based on geometrical considerations it is justifiable to argue that the main effect of a substrate on crystallisation kinetics is the change of energetics of the phase-change process: the change of Gibbs free energy for nucleus formation, i.e., the driving force for crystallisation, is considerable increased. The differences among different substrates are then attested by the different surface activity of these substrates.
CONCLUSION
[image:9.595.89.508.371.519.2]______________________________________________________________________________
are violated. Phase-change process of GST is neither homogeneous nor time-independent, which are basic assumptions of the JMAK theory, so that large deviations in reported values of JMAK parameters in the literature are predestined. Some of the restrictions of the JMAK formalism can be overcome by means of generalizations, but this would destroy most attractive attribute of the theory: it’s simplicity.
Calculation of nucleation rate in GST based on the classical nucleation theory and the use of rough estimates for steady-state and transient nucleation rates require the knowledge of material parameters. We showed that some of these parameters, like the viscosity, the diffusivity, and the fusion enthalpy of GST, could be inferred or estimated from published experimental results. We also suggested that some of the parameters could be taken as free parameters. Combination of free parameters and approximate equations of this approach, however, diminishes prediction capability and reliability of the model. Therefore we suggested a more detailed and comprehensive model. Based on rate equations this model is capable to simulate the crystallization process in GST. We demonstrated that it is possible to simulate set of different experiments without employing fitting parameters. Application of this type of modelling formalism to GST is new and in its early stage. Nevertheless, first results are encouraging.
REFERENCES
[1] S. Bernacki, K. Hunt, S. Tyson, S. Hudgens. IEEE Trans. Nucl. Sci, v.47, pp.2528, 2000. [2] S. Lai and T. Lowrey. Proceedings, 2001 IEEE International Elecron Devices Meeting, 2001.
[3] M. Gill, T. Lowrey, and J. Park. Proceedings, 2002 IEEE International Solid State Circuits Conference, 2002. [4] Wanhua Yu, David Wright. Cellular automata Modelling of phase change memories, Journal of University of Science and Technology Beijing, 2008, 15(4), 444-450.
[5] I. Friedrich, V. Weidenhof, W. Njoroge, PP. Franz. J. Appl. Phys, v.87, pp.4130, 2000. [6] V. Weidenhof, I. Friedrich, S. Ziegler. J. Appl. Phys, v.89, pp.3168, 2001.
[7] S.-H. An, D. Kim, S. Y. Kim. Jpn. J. Appl. Phys, Part 1, v.41, pp.7400, 2002.
[8] T. PP. Leervad Pedersen, J. Kalb, W. K. Njoroge, D. Wamwangi, and M. Wuttig, Appl. Phys. Lett. v.79, pp.3597, 2001.
[9] E. M. Wright, P. K. Khulbe, and M. Mansuripur. Appl. Opt. v.39, pp.6695, 2000.
[10] B. Hyot, V. Gehanno, B. Rolland, A. Fargeix, C. Vannufel, F. Charlet, B. Bechevet, J. M. Bruneau, and P. J. Desre. J. Mag. Soc. Japan, v.25, pp.414, 2001.
[11] Y. Nishi, H. Kando, and M. Terao. Jpn. J. Appl. Phys, Part 1, v.40, pp.1598, 2002. [12]Z. Fan and D. E. Lauglin, Jpn. J. Appl. Phys, Part 1, v.42, pp.800, 2003.
[13] G. Ruitenberg, A. K. Petford-Long, and R. C. Doole. J. Appl. Phys, v.92, pp.3116, 2002.
[14] T. Nonaka, G. Ohbayashi, Y. Toriumi, Y. Mori, H. Hashimoto. Thin Solid Films, v.370, pp.258, 2000. [15] W. K. Njoroge, H.-W. Wöltgens, M. Wuttig. J. Vac. Sci. Technol. v.A20, pp.230, 2002.
[16] V. M. Glazov, S. N. Chizhevskaya, and N. N. Glagoleva. Liquid Semiconductors, Plenum Press, New York, 1969.
[17] D. Kashchiev. Nucleation, Butterworth-Heinemann, Oxford, 2000.