Social Policy and Programs Focused on Children in Peru
(2010-2014): An Evaluation Based on the
Multidimensional Poverty Index
Enrique Vásquez
Department of Economics, University of the Pacific, Peru
Copyright©2016 by authors, all rights reserved. Authors agree that this article remains permanently open access under the terms of the Creative Commons Attribution License 4.0 International License
Abstract During the first decade of the new Millennium,
the economic growth of Peru was impressive. According to the official statistics, the monetary index decreased dramatically. However, in 2011 a new government was elected because the gains of the economic boom was not tangible for the poorest and it was necessary a more inclusive approach of the economic and social policy. In this context, the government allocated US$3 mm dollars per year of public budget to social programs focused on children. This paper is an evaluation of the Peruvian government social expenditure focused on children. This issue is studied from two perspectives. On the one hand, the Multidimensional Poverty Index, based on Alkire Foster (2007) methodology has been applied to the LSMS (2010-14) taking into consideration the different age groups of children, ethnic groups and geographical dominium. On the other hand, the social public expenditure focused on the main 6 government programs targeted on children has been analyzed based on data from the Integrated Financial Web System hosted by the Ministry of Economics and Finance. The primary findings of the paper draw the attention that the Peruvian public policy has implemented a regressive approach of the public social expenditure focused on children. Meanwhile many of the new law and policy instruments (2010-14) followed children rights approach, the public management allocated resources not taking into consideration of multidimensional poverty, vulnerability of ethnic groups and level of rurality. Moreover, a comparison of the monetary and multidimensional poverty indexes in Peru (2010-14) focused on children showed critical gaps of size of children population group. This gap might explain the fact that important part of the under-18 year old population was non-visible for the policymakers and economic managers. Thus, the lack of proper measurement of the real level of poverty of children could be misleading the allocation and use of public resources in Peru (2010-14). As a result, social conflicts at sub-national level in Peru could be nurturing.Keywords
Children, Adolescents, Poverty, MonetaryPoverty, Multidimensional Poverty Index, Ethnic Groups, Health, Education, Social Problems, Social Public Expenditure, Inequality, Public Investment, Social Investment
1. Introduction
During the first decade of the new Millennium, Peruvian Economy has experienced a remarkable GDP growth. Official statistics on poverty showed real benefits as a result of the open economy model, over the low-income population welfare. Despite of it, on 2011, Peruvian voters elected a political party that set up social exclusion as the main agenda problem to solve. In to what extent, elected President Humala have accomplished the main goal of improving the households welfare, and overall, the living standards for their children in Peru during 2010-2014?
As a starting point, the paper conceptually explains and measure the Multidimensional Poverty Index (MPI) in Peru using the LSMS (2010-2014) database, highlighting the most significant variations of the deprivations observed during the study period. Consequently, the study focuses on the most vulnerable group of the population: children. For this approach, the MPI was measured distinguishing into different ethnic, age groups and geographical location, addressing the importance of education and health for each of them. As a result, we will be able to answer the following question: Was the public social expenditure correctly targeted on the most deprived children population across the along the study period? Using the data base from the Integrated Financial Web System (Sistema Integrado de Administración Financiera SIAF), in this section is possible to give an overview of the social, health and education public expenditure on the poorest sector of the population, specifically, on children. Finally, it was measured the cost of ineffectiveness derived from the inaccurate target of children social programs in Peru.
I am grateful of Carlos Cabrera, Renzo Muñoz-Nájar, Fiorella Patiño and Carla Srebot for their help. This paper is a new version based on the interesting suggestions and recommendations received at the 5th International Society of Child Indicators Conference which was held at CapeTown (South Africa) in 2015.
2. What is Multidimensional Poverty?
In Peru, poverty measurement answers to the monetary
approach method (INEI, 2015, pág. 3) [1]. In that sense, if any individual shows an income or consumption per capita lower than the basic basket of goods value, then this person could be considered as poor (MEF)[2]. However, as proposed by Alkire and Foster (2013) [3]. From the OPHI initiative, poverty could be measured in a way different from the monetary approach. What they propose is that poverty could be determined observing the individual deprivations from different dimensions such as lack of education opportunities, non-access to water and public drainage, health assistance or living conditions. Therefore, policymakers could enrich their analysis and decisions if they also include poverty measurement according to the Multidimensional Poverty method.
One by one, each of the multidimensional poverty dimensions supports in a proper way the analysis of the policymaker, in contrast, the monetary poverty approach doesn’t give any information about the individual’s specific deprivations, consequently, gives no guide for better social investment and government assistance (OPHI, 2013, pág. 3)[4]. Indeed, the income only identify correctly around 20-70% of multidimensional poor people, depending on the country and the range of indicators used to calculate the MPI. (OPHI, 2013, pág. 32)[5]. Multidimensional poverty is an interesting alternative method due to the fact that it gives a holistic view of the reality. Alkire, Foster and Santos designed this index. Its calculation was based on three fundamental dimensions: Education, Health and Living Standards. Each of these dimensions, include different indicators arbitrarily weighted.
Multidimensional Poverty Index shows different deprivations exhibited by the household. Household is considered as poor if the sum of the indicators is higher than 0.33 and it reflects the incidence. Indicators are defined in the following way1:
Education
Family’ school attendance: Any member of the family whose age is 11 or higher and have not completed 5 years at school.
Children enrollment: Household where at least one school-age child (6-17) is not enrolled in school (and hasn’t finished high school).
Health
Medical assistance: If any person suffer from pain, illness or have an accident could not be assisted in a public medical center due to lack of economic resources, long distance to the closest hospital or is not insured.
Caloric intake deficit: Caloric intake is lower the minimum required.
Living Standards
Electricity: House does not have access to electric supply. Water: House does not have access to potable water. Drainage: House does not have access to public water drainage.
House pavement: The pavement is dirty, with soil or animal manure.
Kitchen fuel: House uses coil or wood as fuel to cook.
3. Multidimensional Poverty faced by
Children in Peru: 2010-2014
The multidimensional approach for Peru, exhibit the poor deprivations where social investment may expand or intensify its efforts. However, the present document main objective is to highlight the multidimensional poverty deprivations observed in children from 0 to 18 years old. Therefore, the criteria to determine whether a particular individual is poor or not was readjusted, in that way, it was possible to avoid the “contagious effect” observed at household level. Once more, it’s preferable the multidimensional instead of the monetary approach, because the first explains a wider problem in terms of different dimensions and the second focus on the poverty borderline and the value of the basic basket of goods.
1 Measurement of multidimensional poverty was calculated under the OPHI proposed methodology by 2013, which is different from 2010 in the following aspects: assets holding deprivation is now included, criteria to determine deprivations on education are changed so this indicator has more weight when calculating poverty index. Therefore, the family school attendance indicator is less rigorous compared to the one included in the previous document published by the CIUP on 2013. In that sense, the results from the incidence of multidimensional poverty are different from those obtained in the Paper published on 2013.
2.1. Children Deprivations Trend in Peru: 2010-2014 The multidimensional approach covers 3 dimensions: education, health and living standards of the individual’s household. The education dimension assesses the individual educational requirements to develop a better school career. Despite of it, the education dimension considered only measurements for the students enrolled in the system, but do not say anything about the quality. The health dimension evaluates services supply through medical centers and the caloric intake required for each household. Finally, the living standard dimension evaluates the characteristics of the house where the family can develop. It’s important to mention that it will be measured the multidimensional poverty at individual level instead of household level, in contrast to the previous document.
Multidimensional Poverty Index (MPI) to see if it’s possible to identify some path that may allow and inference about the living conditions of the poorest children in Peru, by checking their level of deprivations2( 0 – 18 years).
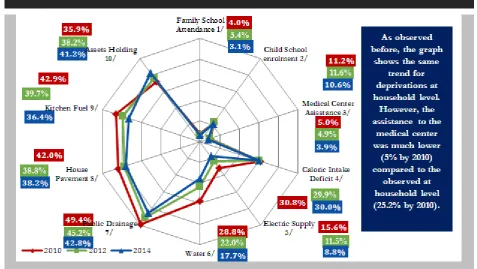
In first place, is worth to mention that the evaluated period was divided by two: 2010-2012 and 2012-2014. On the first stage, the evolution of the indicators for children population exhibited a different trend in terms of intensity and direction. However, variation of those variables meant a reduction of the multidimensional poverty for children from 23.5% to 26.4%, in other words, 380,489 children that left poverty condition. Therefore, it’s remarkable that two indicators that affect household deprivations followed an up scaling path: child school enrolment (0.4pp) and assets holding (2.3pp). Summarizing, the ten indicators under which multidimensional poverty index was built up, decreased by a mean of -2.0pp from 2010 to 2012. It is important to mention that the indicator of access to potable water (-6.8pp) and public drainage (-4.2pp) showed a major decrease for the same period.
On the one hand, during the period from 2012 to 2014, the levels of deprivations changed in a similar ways as for previous two years, with exception of two indicators: child school enrolment and caloric deficit intake. The first decreasing deprivation was -1.0pp, while for the period 2010-2012 it suffers an increase of 0.4pp. With respect to the caloric intake deficit, it increased by 0.1pp from 2012 to 2014, while in the first period the reduction was 0.9pp. It’s worth to mention that the indicator tendency of the assets holding deprivation was in an upward direction, so it was the deprivation that worsens the most across time. In concrete, the ten indicators that reflect multidimensional poverty index for children have diminished by mean of -1.3pp on 2014 with respect to 2012. In that sense, the indicators of water access (-4.3pp) and kitchen fuel (-3.4pp) exhibited a major reduction in the second round evaluated.
2 The “Children rights convention” considers a human being since its conception till 18 years old. (Asamblea General de las Naciones Unidas, 1989, pág. 10)
Table 2. Multidimensional Poverty Rate for Childen at country level. Perú: 2010 – 2014 (Absolut and percentage values)
Type of Poverty Num. of 2010 2011 2012 2013 2014
People % Num. of People % Num. of People % Num. of People % Num. of People %
Multidimensional
Poor 2,733,088 26.4% 2,652,822 26.1% 2,352,599 23.5% 2,210,081 22.1% 2,108,116 21.4%
Source: LSMS 2010, 2012 y 2014 (upgraded methodology) Elaborated by: Centro de Investigación de la Universidad del Pacífico
Source: LSMS 2010, 2012 y 2014 (upgraded methodology)
Elaborated by: Centro de Investigación de la Universidad del Pacífico
What does the reduction or increase of the indicators from the multidimensional poverty rate means? As the living conditions were at household level, then it can be explained in the same way. The house of any individual does not have access to electricity supply, potable water or connection to public drainage, etc. With respect to the water access deprivation, which was analyzed for the two period (2010-2012 y 2012-2014) have shown a sustainable decrease, which meant additional 1,225,793 children that had accessed to this basic service. This is due to the National Rural Sanitation Program from the Home Ministry. Meanwhile, The National Electrification Plan designed by the Mining and Energy Ministry, it was possible a reduction of access to electricity deprivation of about 750,224 children. From other side, according to the assets holding deprivation from 2010 and 2014 improved, almost 234,727 less children had limitations such as not having, radio, TV, telephone and
fridge.
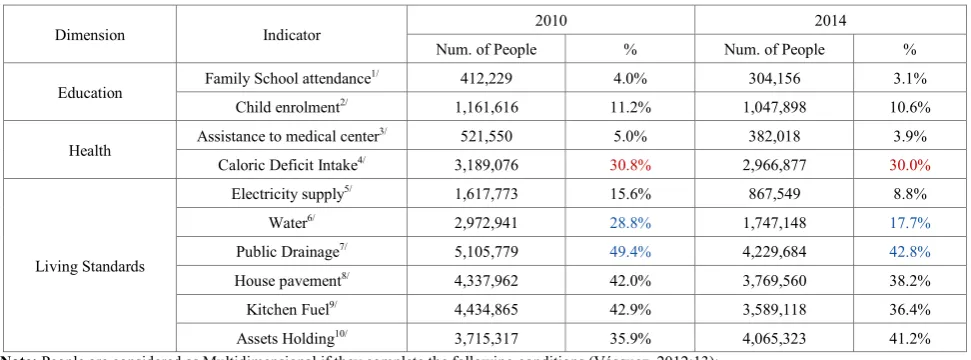
[image:4.595.65.543.207.476.2]Table 3. Level of deprivations for the total children population (0-18 years). Peru: 2010 – 2014 (absolute and percentage values)
Dimension Indicator 2010 2014
Num. of People % Num. of People %
Education Family School attendance
1/ 412,229 4.0% 304,156 3.1%
Child enrolment2/ 1,161,616 11.2% 1,047,898 10.6%
Health Assistance to medical center
3/ 521,550 5.0% 382,018 3.9%
Caloric Deficit Intake4/ 3,189,076 30.8% 2,966,877 30.0%
Living Standards
Electricity supply5/ 1,617,773 15.6% 867,549 8.8%
Water6/ 2,972,941 28.8% 1,747,148 17.7%
Public Drainage7/ 5,105,779 49.4% 4,229,684 42.8%
House pavement8/ 4,337,962 42.0% 3,769,560 38.2%
Kitchen Fuel9/ 4,434,865 42.9% 3,589,118 36.4%
Assets Holding10/ 3,715,317 35.9% 4,065,323 41.2%
Note: People are considered as Multidimensional if they complete the following conditions (Vásquez, 2012:13): 1/Any, member of the family with age equal or more than 11 years old had completed 5 years at school.
2/Household where he lives, has at least 1 child (6-17) who hasn’t been enrolled at school (and haven’t finished the secondary school)
3/If any pain, illness or accident occurs, any member of the family has no access to the medical centers due to the: lack of economic resources, long distance to the closest medical center, or was not insured by the National the Healthcare System
4/Household where he/she lives, does not consume the minimum required calories. 5/House does not have access to public electricity supply
6/House has no access to potable water 7/House has no access to public drainage 8lHouse pavement is dirty, with mug or moisture. 9/Coal or wood is generally used as cooking fuel.
10/House does not hold any of the following assets: radio, TV, telephone (landline or mobile phone), bicycle, motorcycle, fridge, truck or car. House is not legally registered.
Source: LSMS 2010, 2012 y 2014 (newest methodology)
Elaborated by: Centro de Investigación de la Universidad del Pacífico
In summery the total numbers reflecting the multidimensional poverty shows a rate for 642,972 children for Peru during 2010-2014.
2.2. Analysis of Multidimensional Poverty of Children by Different Age Group. Peru: 2010-2014
Source: LSMS 2010, 2012 y 2014 (upgraded methodology)
Levels of multidimensional poverty for children by different age group in Peru from 2010 to 2014, was relatively low for most of the years (21.21% el 2010, 19.92% el 2011, 17.10% el 2012, 15.80% el 2013 and 15.46% on 2014). Nevertheless, this is explained by the almost nonexistent education deprivation for this group, due to the structure of its criteria. Is necessary to clarify it because the level of incidence of multidimensional poverty in this group, could lead to a wrong conclusion that may affect the perception among other groups. Even so, there is a possibility to compare the poverty incidence within the age group, because they face the same possibilities. Finally, we may highlight the fact that deprivations on the age range 0-5 years, refer to the health and living conditions, while range 7-11 years include all the criteria excepting family attendance to school. This way, the comparisons made for each age group, may be specific for them.
It’s worth to say that multidimensional poverty levels reduced by age group year by year, 2011 was the only year where children from 12 to 17 years increased poverty in 0.78pp. For the group from 0 to 5, the decrease of poverty was straight till 0.34pp on 2014, and as a mean for both 16 out of 100 children was poor. The same way, it is visible the reduction of 2 pp of the multidimensional poverty for children from 6 to 11 every year, but it stayed constant for 2014. Were the incidence raised 0.35pp. From all the improvements, the most important was the age group 0-5 years because poverty lowered to 27.11% from 2010 to 2014, followed by the other age groups (-20.98% from 6 to 11 and -14,07% from 12 to 17 years) This improvement from children under 5 years, leads us to the conclusion that the youngest population had a better progress, and that the interest of the government must be centered on the other groups.
2.3. The state of Children Health by Age Group 2014 From the health dimension, we can observe the limited access to the health centers and the caloric deficit intake. The deprivation of the assistance to any medical center reflects the incapacity to treat any pain suffered, due to long distance to the health center, not insured, with any economic resources. From the other side, the caloric intake deficit let us observe the nutritional deficiency of the household where the individual lives. If the individual exhibit a deprivation in the household level, then it means he or she does not consume the basic required caloric intake3.
From all the poverty increases, the worst is the observed for the age group between 0 and 5 years on 2012. That year, the rise of multidimensional children that stop being assisted by the medical centers raised by 3.8pp. (93,920 on 2011 and 96,396 on 2012). This increase was followed not by far for the age group from 6 to 11 years, wich was +1.6pp (129,621 on 2011 and 132,919 on 2012) for the same year.
3 Caloric intake requiered for latin americanc ountries was calculated by: Los requerimientos calóricos para países latinoamericanos fueron calculados por José María Bengoa, Benjamín Torùn, Moisés Bahar y Nevin Scrimshaw (Bengoa, Torùn, Bahar, & Scrimsha, 1989).
Results observed confirm the ones from the INEI, because they show that by 2012, approximately 900,000 children under 5 years had respiratory infections and 180,000 children faced stomach problems such as diarrhea and couldn’t be assisted in any medical center (INEI, 2014) [6]. It’s important to mention the following questions: How it was affected the Healthcare System coverage by 2013? How many children below 5 years stop being assisted in the medical centers? An approximation is that, the public health administration that is leaded by the regional governments, doesn’t have the effectiveness population expect, additionally, the medical labor union strikes against the government so it generates more deprivations for the poor population.
However, the next year the percentage lowered on 2.5pp for all age groups, what was the main reason to reduce abruptly the deprivation of health assistance to medical centers for children on 2013? This drop on the indicator can be attributed to the fact that by 2012, the Ollanta Humala government assigned public resources for the execution of the National Plan for Children 2012-2021 (PNAIA 2021) [7]. to warranty the social rights of children in Peru4. In that sense, a series of public policies and budget transferences were made to the regional governments, so that contributed to the limited access of children to the medical centers. In example, Health Ministry started a campaign for the pregnant to access to optimal health conditions and assure the medical assistance during the pregnancy period, the birth and after birth period for both rural and urban areas. This way, the deprivation reduction on health was like 3.3pp. For the indicator of medical assistance for children between 0 and 5 years, what meant additional 23,200 children covered and assisted on the medical centers, that the public policy put more emphasis on children under poverty conditions.
As mentioned before, the caloric deficit intake was considered to estimate the real deprivation dimension on health from children by different age groups. According to the results, by 2012 the caloric poverty intake revealed a reduction of 3.4pp, 7.1pp and 5.5pp for age groups 0-5 years, 6-11 years and 12-17 years, respectively, compared to the observed on 2010. However, the situation may have seemed worse because for children the caloric deficit intake increased by 2.2 from 2012 to 2014. At the same time, in the case of children from 6 to 11 and 12 to 17 years, caloric poverty increased on 6pp. and 4.1pp, respectively. This way, caloric deficit for children in group 0-5 lowered but for the other groups the tendency had a positive slope. In sum, 187,578 children from 0-5 and 301,877 from 6-17, stopped being under caloric intake problems.
4 En otra palabras, garantizar el crecimiento y desarrollo integral de niñas y niños de 0-5 años de edad; avalar la continuación del crecimiento y desarrollo integral de niñas y niños de 6 a 11 años de edad; consolidar el crecimiento y desarrollo integral de las y los adolescentes de 12 a 17 años de edad, y garantizar la protección de las niñas, niños y adolescentes de 0 a 18 años de edad. (UNICEF, 2014, pág. 51) (Estos fueron los objetivos estratégicos del PNAIA).4
Source: LSMS 2010, 2012 y 2014 (upgraded methodology)
Elaborated by: Centro de Investigación de la Universidad del Pacífico
In what sense the government combated nutritional problems and pretended to reduce caloric intake deficit deprivation? By 2013, the government accepted the National Strategy for Development and Social Inclusion “Include to grow” that exhibited the social policy of Ollanta Humala, (UNICEF, 2014, pág. 19)[8]. The insights of the strategy are 3 main objectives related to child rights, development of its abilities and offer opportunities to Peruvian children. In that sense, the Strategy “Included to grow” had as its main objective to reduce the malnutrition gap.
Inside the strategy, 3 out of 5 objectives are related to children rights, abilities development and to give opportunities to Peruvian children. In that sense, the strategy “Include to Grow” had as its main objectives to reduce the chronic malnutrition levels. For that reason, 2 programs acquired political and economic relevance. From one side, CunaMas target its efforts to expand the assistance of 64,544 children beneficiaries from 0-5 years, from the other side, QaliWarma projected alimentation over 3 million children enrolled in the basic education system for all 2015. It is expected that in the mid-term the level of caloric intake deficit in children, might reduce significantly and therefore it contributes to the level of school attendance of the beneficiaries of QaliWarma.
Source: LSMS 2010, 2012 y 2014 (upgraded methodology)
Source: LSMS 2014 (upgraded methodology)
Elaborated by: Centro de Investigación de la Universidad del Pacífico
Comparing medical centers where multidimensional poor children assist while they face any health problem or temporal pain by age group, we can reach the conclusion that they do not look for help under this scenario. Despite of it, they look for any medical center from the MINSA or in the nearby drugstores. This situation could be explained because other health services are too expensive, therefore the families prefer to buy directly the medicine or not even receive any assistance.
To test the current situation with the evidence found, it will be necessary to analyses the programs stimulated by the government. In the paper related to the Children Chronicle Malnutrition, it was detailed the public policies implemented on 2012: Macroeconomic and Social Multiannual Framework, that prior “…the social policy, the fight against children chronicle malnutrition, health prevention, quality of education, appropriate job conditions, social and economic infrastructure” and the National Strategy CRECER, that established the way districts with higher incidence of malnutrition would be intervened by agents. Furthermore, there was a budget raise for social programs target on children chronicle malnutrition reduction, as well as the Strategic Program of New Mother Pregnant Health, that pretend to improve the health of recent mothers and children birth in terms of family health and education (Inversión para la Infancia, 2012, págs. 17,18)[9].
Consequently, results obtained through the government actions are expected. The results, shown demonstrate a constant improve, in example, the percentage of children below 5 years that face chronicle malnutrition. This indicator, changed from 18.3% on 2009 15.2% on 2011 (Inversión para la Infancia, 2012, pág. 22) [9]. From another view, the INEI
shows the same indicator was higher for the same year (19.5% on 2011) (INEI, 2013) [10], what means this difference between both calculations? How this is related to the caloric deficit intake? A quick conclusion would imply to discard non-official results, but it is necessary to understand the methodology behind the indicator and understand their degree of complementarity regarding their results.
2.3.1. State of Children Education by age group 2014 The education dimension is composed by the children school enrollment and family school attendance5. The family school attendance offers a view to the difficulties faced by children to accomplish their school obligations according to the Ministry of Education, so as to predict future desertion. Additionally, the children school enrolment reflects the administrative procedure of inscription (not evaluating attendance to school) to education centers for children and helps to calculate the levels of school desertion. When analyzing the family school attendance of children by age group, it is visible according to the graph, that age group from 12 to 17 years shows higher levels of deprivation compared to the ones from 6 to 11 years. Along the period 2010-2014, the school attendance deprivation of children from 12 to 17 years had shown notorious decrease of 5pp (in other words, from 214,902 on 2010 to 130,363 on 2014).
What means that children from 6 to 11 count with lower deprivation levels according to the family school attendance against the ones from 12 to 17 years old? These results
5 The criteria allows to compare people older than 11 years old, therefore, children from 0 to 5 years are not considered into the analysis of the most deprived for education dimension.
explain that children from 6 to 11 years old will have higher possibilities to escape from poverty. One of the probable reasons is that “children with relatives (father, mother, others) with lower level of education (under-primary, primary,
uncompleted secondary level), have higher chance to face poverty risks or social exclusion than those whose parents have a higher educational level (completed secondary level or superior)” (UNICEF, 2014, pág. 18) [11].
Source: LSMS 2010, 2012 y 2014 (upgraded methodology)
Elaborated by: Centro de Investigación de la Universidad del Pacífico
When analyzing the education for children in Peru along the period 2010-2014, it’s not enough to evaluate the deprivations indicators used to build up MPI. If we analyze the family attendance deprivation and children school enrolment that this deprivation is quiet uncommon for Peru, therefore, is an unimportant topic to consider. Nevertheless, as mentioned before, the deprivations of family school attendance and children school enrolment with their new criteria, gives more relevance to coverage rather than quality. So then, following question arises, what indicators could also give a complete view of what is going on with children from Peru in terms of education?
To complete the whole specter of the situation for children in Peru, it was calculated the percentage of children by age group that haven’t assisted to the school from 2010 to 2014. The percentage of child over 3 and below 5 years old that haven’t assisted to school was the lowest with respect to the other age groups and decreases year after year to 18.6% till 2014. In turn, the case for the group of children from 6 to 11 and 12 to 17 increased from 2010 to 2012, by 3.7pp and 1.95pp, respectively, while from 2012 to 2014 decreased from 37.44% to 36.22% and 33.10% to 30.91%, respectively. The better attendance to school could be explained by some favorable impact from the economic growth, the reduction of
poverty and the better infrastructure and coverage of education along the past 20 years (Organización de las Naciones Unidas Perú, 2013, pág. 59) [12].
Meanwhile, the attendance to school raised due to the implementation of the monetary conditioned transferences accomplished by the Program JUNTOS to the families under extreme poverty conditions in rural areas and when they have children from 6 to 14 years old that have been enrolled and attend to school (Organización de las Naciones Unidas Perú, 2013, pág. 59) [13].
The most urgent problem can be seen on children similar behavior who haven’t attend to school the previous year the survey was made with the ones who reported the same path during the survey for 2014, because it is still 32.59% for children from 6 to 11 and 33.43% for the ones on the range of 12-17 years old. In other words, there exists a strong trend of school desertion of children from 6 to 17 years. For the rural areas, the situation might find its reasons on the parent’s decisions while children grow, in the case of girls they must stay at home to help and boys must work in agriculture with the father. For boys, this is explained due to the low potential income return from more education and the higher profits from working the land and helping their families (Durston, 1996) [14].
Source: LSMS 2010, 2012 y 2014 (upgraded methodology)
Source: LSMS 2010, 2012 y 2014 (upgraded methodology)
Elaborated by: Centro de Investigación de la Universidad del Pacífico
It’s relevant to also revise the number of children that, due to many reasons, left the school before the school year came to its end. By 2010, percentage of children that got retired from school was 31.59% for those in the age range of 6 to 11 and 35.05% for those between 12 and 17 years old. By 2014, the percentage of children under multidimensional poverty condition raised their level of desertion to 36.74% for the group 6-11 and lowered to 33.37% for the children between 12 and 17 years old. Consequently, approximately the third part of multidimensional poor children got retired before the school year was over (a mean of 29,550 children per year).
Source: LSMS 2010, 2012 y 2014 (upgraded methodology)
Elaborated by: Centro de Investigación de la Universidad del Pacífico
When observing the percentage of students who failed the academic year, by 2010 it was 35.89% for the age group 6 to 11 and 28.23% for children from 12 to 17 years old. By 2014, the percentage of students who failed the academic year was 29.46% for the age group 6-11 and 27.75% for children from 12 to 17 years old. Let say, almost 37,544 children from 6 to 11 failed the 2013 school cycle. This group also exhibits the lowest quantity of children attending to school by 2014 (265,635 children). In this sense, it is possible to propose the hypothesis that failing a previous academic year, increases the probability of not attending the school the next year. From one side, Alcázar assures that academic performance does not explain school desertion (GRADE, pág. 5) [19]. From the other, there is empirical evidence that shows that those variables would have an explanatory relation.
Source: LSMS 2010, 2012 y 2014 (upgraded methodology)
Source: LSMS 2010, 2012 y 2014 (upgraded methodology)
Elaborated by: Centro de Investigación de la Universidad del Pacífico
Likewise, it was observed the correspondence between age and school level. By 2010, almost 19.43% of children from 6 to 11 were delayed with respect to their corresponding academic year, while in 2014 the percentage was 12.92%. For children on the age group 12-17, almost 30.30% were delayed by 2010 and 26.33% by 2014. Principal reasons for the school age delay are the lack of familiar resources, the insufficient education infrastructure and the poverty living conditions (Cortez, 2001, pág. 14) [20]. Therefore, as in the previous section, it is possible to propose the hypothesis that educational infrastructure improvements and the reduction of poverty could lead to a decrease of the children school age delay problem. Furthermore, it is worth to highlight that the school delay with respect to the normal age for the early school years is potentially higher than the observed for older students, due to the fact that delay may increase over time. Similarly, evidence shows that an early school age delay in the early years may be due to the difficulty to have a good performance at school rather than being lately enrolled (Cortez, 2001, pág. 15) [21]. The same way, school age delay, might be explained by the previous tables, because this problem may stimulate other restrictions such as low school attendance, which at the same time again generates more delay for the student. (Cortez, 2001, pág. 1) [22].
In sum, the education conditions faced by multidimensional poor children had improved in Peru for the period 2010-2014 even if they were not enough to ensure the proper quality and full coverage over children population, what is desirable. The deprivation indicators on education evolution were favorable, in the sense that for most of age groups family school attendance deprivation had been
reduced and children school enrolment stayed constant. At the same time, if we observe the indicators on education development such as school nonattendance and school age delay, we can conclude that those indicators improve from 2010 to 2014. Despite of it, the school desertion percentage raises for the same period.
The results previously showed, support the positive effects from economic growth, the reduction of poverty levels, the improvement and higher coverage of infrastructure for the past 20 years. The same can be inferred about the Program JUNTOS, which helped poor families whose children must get enrolled at school by giving them a conditioned monetary transference. In turn, the high percentage of retired students might be explained by the children work that looks for more familiar income. For that reason, age group from 12 to 17 is where the education deprivations are higher, because they must work more as they grow. In the case of rural areas, the situation is critical because the education of parents is lower than those from urban areas and due to the need of labor force in the agriculture sector. Improvements observed in the present document are the same as concluded by the UNICEF, even if they still highlight the problems in the mathematics and lecture comprehension. (UNICEF) [23].
2.4. Analysis of Multidimensional Poverty on Children by Ethnic Group. Peru 2010-2014
“the situation of the indigenous children was always less favorable compared to the Spanish speaking children” (UNICEF, 2010, pág. 126) [24]. If we observe the following chart, it is visible the child population whose mother language was native, has higher chance to fall into multidimensional poverty condition with respect to the Quechua, Aymara or Spanish. “Another aspect important aspect is the exposure to racism. Racism makes reference to the access for different goods, services and opportunities conditioned to a particular race. Examples of racism on materials include the differentiated access to a good living standards, education quality, well paid salary, medical access, pacific environment, etc.” (Valdivia, pág. 134) [25]. The same is for other variables that may have impact over the reality of live and facilities to be employed (Vásquez, Chumpitaz, & Jara, Niñez indígena y educación intercultural bilingue en el Perú, 2009, pág. 72) [26]. This situation influence on poverty condition for indigenous children, because they have impact overt the observed deprivations at household level.
2.5. State of Health by Ethnic Groups 2014
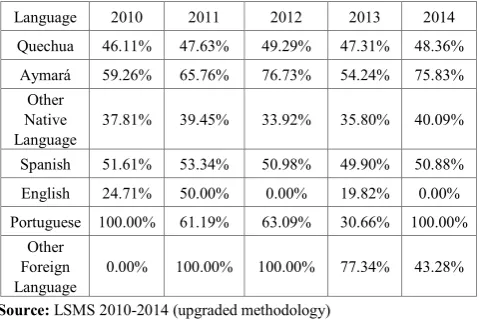
Health conditions by ethnic groups show an alarming reality, almost 75% Aymara at the time they were surveyed, appear to have some ill or pain the previous 4 weeks.
Additionally, Aymara was the ethnic group that as more incidences of health problems they face, less they look for medical assistance. However, this path was repeated when analyzing by age group. Most multidimensional poor children, does not look for medical assistance, only go to some MINSA medical center or buy some pill at the drugstores, therefore it’s a repeated path under poverty conditions. In the case of Aymara, there is a huge cultural barrier. This group has a totally different view of health, therefore, when they have some pain or illness, they prefer to be assisted by some of their wise doctors (Valdivia, pág. 132) [27]. According to Yon, Quechua and Aymara woman believe that family planning methods have negative impacts over their state of health, because they relate their effects with the population control objectives of the policymaker, in other words there is no trust in any of the government policies related to that topic (Valdivia, pág. 133) [28]. Meanwhile, “a major quality of life and advantages from health assistance could be sum up to favour several groups that had problems to adapt in the urban areas for a long period.” (Valdivia, pág. 134) [29]. In other words, even if there is an ethnic component to explain the gaps in health assistance among indigenous and not indigenous groups, this difference may also be associated to the geographical area where the ethnic groups live, generally in rural areas where access to health is almost impossible.
Source: LSMS 2010, 2012 y 2014 (upgraded methodology)
Source: LSMS 2014 (upgraded methodology)
[image:15.595.58.298.369.532.2]Elaborated by: Centro de Investigación de la Universidad del Pacífico
Table 4. Multidimensional poor children who faced some pain or illness the previous 4 weeks by ethnic groups. Peru: 2010 - 2014(percentages)
Language 2010 2011 2012 2013 2014
Quechua 46.11% 47.63% 49.29% 47.31% 48.36%
Aymará 59.26% 65.76% 76.73% 54.24% 75.83%
Other Native
Language 37.81% 39.45% 33.92% 35.80% 40.09%
Spanish 51.61% 53.34% 50.98% 49.90% 50.88%
English 24.71% 50.00% 0.00% 19.82% 0.00%
Portuguese 100.00% 61.19% 63.09% 30.66% 100.00%
Other Foreign
Language 0.00% 100.00% 100.00% 77.34% 43.28%
Source: LSMS 2010-2014 (upgraded methodology)
Elaborated by: Centro de Investigación de la Universidad del Pacífico In sum, levels of poverty in children by different ethnic groups is higher for indigenous rather than for non-indigenous, due to the fact that racism block the access to public goods and services. Meanwhile, the low employment of the household leaders from ethnic groups, generate deprivations at household level that influenced on the children poverty condition. The same way, it was found the cultural barrier generate suspicious on indigenous people that prefer not to receive help. As a consequence, it is quite difficult to reduce deprivations among indigenous groups.
3. Public Expenditure on
Multidimensional Poor Children.
Peru: 2010-2014
Social public expenditure on children is the related to the basic service provision for poor children below 18 years old.
In that sense, “the expression of the social function understood as the target policy for the most deprived children due to the existent market conditions that influence negatively over their welfare” (Alfageme & Guabloche, pág. 5) [30].
“A major and better investment can expand the opportunities and development of capacities of children and contributes to the holistic development of society (social, economic, politic and cultural) (UNICEF, 2014, pág. 11) [31]. In that context, as Peru exhibits high levels of multidimensional poverty on children and critical caloric intake deficit (30%), it is necessary to promote an effective and efficient public administration of the social programs that are implemented to impact in a positive way the levels of deprivation included in the MPI. Particularly, it is appropriate to base those actions on a social policy that may target the expenditure on children, consequently, “every Sol from budget will have higher impact in terms of poverty diminishing “. (Monge, Vásquez, & Winkelried, pág. 53) [32].
3.1. Percentage of Multidimensional Poor and Social Expenditure by Region
Was the social expenditure regressive or progressive in Peru? To answer this question, it’s worth to say the social expenditure is part of the public budget targeted on poor individuals to solve their main deprivations such as education, social security and living conditions. (Ministerio de Economía y Finanzas) [33].
need urgent assistance. This way, when calculating the social expenditure per capita by region, we can observe a distribution of the public resources different from the one it would be done if multidimensional approach would have been applied. The difference is because multidimensional poverty approach is a fundamental instrument to evaluate policies and programs to reduce poverty, therefore… as it focuses on social services such as education, health, labor and some psychosocial deprivations, then the indicators based on monetary poverty may seem to offer insufficient information to catch all the impact those initiations may have to diminish poverty” (CEPAL, 2013, pág. 4) [34].
In that sense, Lima and Ica, evidenced the lowest levels of multidimensional poverty for Peru by 2010 and registered a social expenditure per capita of US$468.87 and US$198.5, respectively, in other words, there is an exceeded social expenditure if we compare it with the poorest regions such as Loreto and Amazonas that only received US$93.9 and US$93.67 per capita, respectively. In contrast, we may conclude that there was a regressive social expenditure in Peru by 2010. Social public expenditure distribution was similar for 2014; regions with the lowest multidimensional poverty rates receive more attention (expenditure per capita) from the government.
From one side, Huancavelica was one of the most
multidimensional poor regions, ranked in the top 5 from the poorest from Peru for the period 2010-2014, as the social expenditure per capita was US$120.33 on 2010 (8th ranked) and US$197.73 on 2014 (7th ranked). Even if the on-going budget was improved for the whole period, by 2014 Huancavelica became the most multidimensional poor region from Peru. Therefore, the collected date reflects a clear regressive behavior of social expenditure for Peru during the period 2010-2014. It the measurement would have been made following the monetary approach, we may suggest that the priority of the poor needs were inversely attacked as desired. Indeed, “the incorporation of non-monetary aspects the index, would allow a better integration of the poverty and public policies” (CEPAL, 2013, pág. 4) [35].
[image:16.595.65.547.403.732.2]What is the main problem for social expenditure to target on the poorest regions? One reason is that there is a bias that consists in following monetary approach. However, if we take into account the number of multidimensional poor by region, we can deduce that social expenditure is focused on areas where the return of expenditure is higher due to the concentration of beneficiaries, as consequence, where there is more impact on the reduction of any deprivation in absolute terms.
Table 5. Percentage of Multidimensional Poor vs. Social Expenditure per capita, Peru: 2010, 2014 (in percentages and Nuevos Soles)
2010 2014
Region RK Multidimensional Poor (%) RK Social Expenditure per capita RK Multidimensional Poor (%) RK Social Expenditure per capita
Lima 23 12.59% 1 S/. 1,521.98 24 6.86% 1 S/. 2,276.85
Ica 24 11.86% 2 S/. 644.35 25 4.59% 8 S/. 619.20
Pasco 7 49.12% 3 S/. 443.37 7 43.03% 3 S/. 853.13
Ayacucho 9 46.00% 4 S/. 412.47 6 43.88% 9 S/. 605.83
Apurímac 8 49.06% 5 S/. 404.25 9 42.37% 4 S/. 728.81
Lambayeque 17 26.54% 6 S/. 402.87 17 22.08% 2 S/. 1,065.01
Arequipa 21 16.30% 7 S/. 391.56 22 12.25% 11 S/. 511.24
Huancavelica 3 55.34% 8 S/. 390.59 1 52.63% 7 S/. 641.86
Moquegua 19 17.77% 9 S/. 378.25 20 14.51% 15 S/. 456.74
Tacna 22 13.24% 10 S/. 358.13 19 14.59% 21 S/. 435.25
Ancash 13 37.35% 11 S/. 342.96 10 34.81% 13 S/. 490.01
La Libertad 16 30.82% 12 S/. 338.64 14 28.52% 17 S/. 450.87
Huánuco 6 49.46% 13 S/. 337.40 5 43.99% 6 S/. 648.48
Junín 14 33.57% 14 S/. 315.29 15 26.09% 18 S/. 438.97
Loreto 1 56.47% 15 S/. 304.82 8 42.69% 22 S/. 426.85
Amazonas 2 56.12% 16 S/. 304.07 3 46.79% 10 S/. 584.25
Cusco 10 41.42% 17 S/. 285.36 16 25.52% 12 S/. 508.50
Piura 11 41.30% 18 S/. 279.75 11 32.20% 23 S/. 400.57
Tumbes 20 16.64% 19 S/. 246.99 21 13.66% 20 S/. 436.73
Cajamarca 4 50.95% 20 S/. 242.87 2 49.89% 19 S/. 437.32
Ucayali 15 32.64% 21 S/. 237.90 12 31.05% 25 S/. 295.03
Puno 5 50.13% 22 S/. 232.02 4 45.27% 16 S/. 455.64
Madre de Dios 18 22.93% 23 S/. 223.94 18 19.59% 5 S/. 688.13
San Martín 12 40.33% 24 S/. 177.11 13 29.55% 24 S/. 336.64
Callao 25 9.55% 25 S/. 176.50 23 7.38% 14 S/. 481.89
Source: LSMS 2014 (upgraded methodology)
3.2. Multidimensional Poor Children and Public Social Expenditure by Region
When analyzing the year social expenditure for Peru, since 2010 to 2014, for poor children, it is visible it follows the same path as for the whole population. In that sense, the evidence says that there was a regressive social expenditure across regions, because we observe that there is a high public social expenditure in regions where multidimensional poverty for children is low and others get fewer budgets even if their children are currently facing many deprivations.
The data shows that Lima registers the major social expenditure focused on children, both for 2010 and for 2014, US$204-15 and US$251.68, respectively, even if it is not the most multidimensional poor region. Indeed, Lima was ranked for 2010 in the 23th and 22th for 2014 as one of the least multidimensional poor regions. Conversely, the regional social expenditure per capita for children in Loreto was US$62.44 (2010) and US$122.06 (2014), therefore, it was considered as in the 1st on 2010 and 5th on 2014 position, of the poorest multidimensional regions for children in Peru. Thus, the results found revealed some regressive path for social public expenditure, because it is not oriented to fight against children deprivations and they stay invisible for the
policymakers.
Given that “poverty is not only the lack of monetary resources to buy goods or services, but it is also linked to the social and individual deprivations (education, health, job) that is more sensible to the vulnerability to risks for the poorest population” (Bueno Sánchez, pág. 40) [36], it is far-reaching to consider multidimensional poverty approach because it is the most adequate and effective way to compensate deprivations of vulnerable poor children. This way, if we measure poverty from a more convenient perspective (multidimensional), then public expenditure would have higher effectiveness in society and they won’t show a regressive path as it was for the studied period. Precisely, due to the fact that poverty is measurement is based on monetary approach for Peru, policymakers are not able to focus social programs and policies in a way poverty may be reduced. For that reason, it is worth to highlight that Peru might be affected by a concept called “intergenerational transmission of poverty”, which means that there are identified poor household that might be assisted in order break the path and reduce the risks of undertaking poverty for generations” (Caballero Carrizosa, pág. 1) [38].
Table 6. Percentage of Multidimensional Poor children vs. Social Expenditure per capita by region Peru: 2010, 2014 (in percentages and Nuevos Soles)
2010 2014
Region RK Multidimensional Poor (%) RK Expenditure per Social
capita RK Multidimensional Poor (%) RK
Social Expenditure per
capita
Amazonas 2 50.42% 7 S/.219.21 3 45.80% 5 S/.618.34
Ancash 16 27.91% 12 S/.167.16 10 26.79% 14 S/.368.51
Apurímac 6 44.26% 3 S/.322.70 8 35.86% 2 S/.774.67
Arequipa 20 11.75% 21 S/.117.38 20 9.59% 20 S/.195.64
Ayacucho 7 42.54% 5 S/.253.65 7 36.80% 6 S/.597.16
Cajamarca 5 46.01% 19 S/.134.95 1 48.91% 7 S/.587.38
Callao 25 6.51% 22 S/.115.45 23 4.95% 13 S/.374.14
Cusco 8 41.38% 16 S/.149.61 15 23.68% 8 S/.454.56
Huancavelica 3 49.51% 11 S/.178.59 2 46.32% 3 S/.674.10
Huánuco 4 47.02% 17 S/.142.12 4 39.07% 4 S/.644.97
Ica 24 7.12% 4 S/.255.06 25 4.06% 23 S/.172.34
Junín 14 28.91% 18 S/.138.87 16 18.87% 18 S/.245.21
La Libertad 15 28.47% 23 S/.107.73 13 24.99% 15 S/.343.92
Lambayeque 17 18.85% 13 S/.166.86 17 15.43% 24 S/.172.20
Lima 23 7.44% 1 S/.668.32 24 4.72% 1 S/.823.93
Loreto 1 51.21% 10 S/.204.41 5 38.47% 10 S/.399.59
Madre de Dios 18 16.70% 24 S/.98.43 18 14.48% 22 S/.173.78
Moquegua 19 12.70% 2 S/.386.82 21 8.99% 21 S/.181.81
Pasco 10 39.20% 20 S/.126.51 6 38.19% 11 S/.398.76
Piura 11 36.82% 25 S/.89.69 14 24.70% 17 S/.282.39
Puno 12 35.50% 15 S/.163.24 9 34.50% 9 S/.424.69
San Martín 9 39.28% 14 S/.165.49 11 26.22% 16 S/.285.06
Tacna 22 9.68% 8 S/.215.00 22 7.87% 12 S/.382.80
Tumbes 21 10.98% 9 S/.206.70 19 11.78% 19 S/.209.88
Ucayali 13 29.39% 6 S/.223.81 12 25.81% 25 S/.161.88
Source: LSMS 2014 (upgraded methodology)
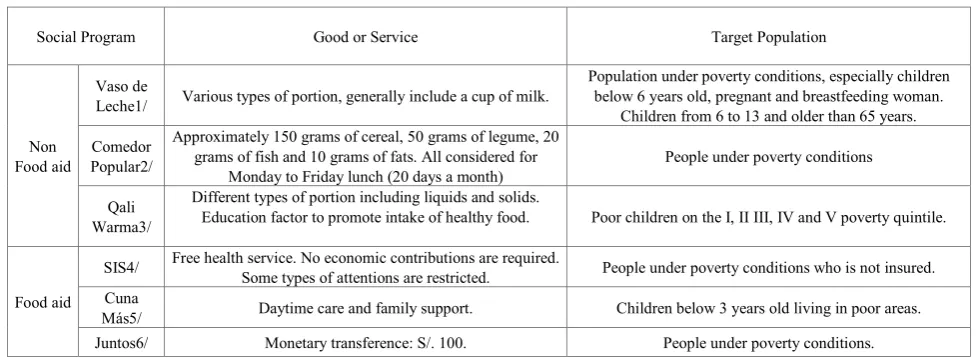
[image:17.595.68.548.386.724.2]Table 8. Description of social programs selected: target population and indicator
Social Program Good or Service Target Population
Non Food aid
Vaso de
Leche1/ Various types of portion, generally include a cup of milk.
Population under poverty conditions, especially children below 6 years old, pregnant and breastfeeding woman.
Children from 6 to 13 and older than 65 years. Comedor
Popular2/
Approximately 150 grams of cereal, 50 grams of legume, 20 grams of fish and 10 grams of fats. All considered for
Monday to Friday lunch (20 days a month) People under poverty conditions
Qali Warma3/
Different types of portion including liquids and solids.
Education factor to promote intake of healthy food. Poor children on the I, II III, IV and V poverty quintile.
Food aid
SIS4/ Free health service. No economic contributions are required. Some types of attentions are restricted. People under poverty conditions who is not insured. Cuna
Más5/ Daytime care and family support. Children below 3 years old living in poor areas.
Juntos6/ Monetary transference: S/. 100. People under poverty conditions.
Source:
1/ Contraloría General. (s.f.). Preguntas Frecuentes del PVL. Recuperado el 23 de 08 de 2015, de FAQ: https://apps.contraloria.gob.pe/pvl/files/Preguntas%20Frecuentes%20sobre%20el%20PVL.pdf 2/ Comunidad Andina. (s.f.). Comedor Popular. Recuperado el 23 de 08 de 2015, de
http://estadisticas.comunidadandina.org/estadisticasandinas/CANPS/archivos/0415.pdf
3/ Qali Warma. (s.f.). ¿Quiénes son los usuarios? Recuperado el 23 de 08 de 2015, de Programa Nacional de Alimentación Escolar: http://www.qw.gob.pe/?page_id=74
4/ Ministerio de Salud. (2012). Sistema Integrado de Salud: 2002 - 2012. Recuperado el 23 de 08 de 2015, de http://www.sis.gob.pe/Portal/mercadeo/Material_consulta/BrochureSIS_CoopInternacional.pdf
5/ Cuna Más. (s.f.). ¿Qué es Cuna más? Recuperado el 23 de 08 de 2015, de http://www.cunamas.gob.pe/
6/ Programa Nacional de Apoyo Directo a los Más pobres. (2015). Juntos. Recuperado el 23 de 08 de 2015, de Usuarios: http://www.juntos.gob.pe/index.php/usuarios
Elaborated by: Centro de Investigación de la Universidad del Pacífico
3.3. Analysis on the Effectiveness of the Social Programs Targeted on Multidimensional Poor Children in Peru: 2010-2014
The public administrations during the government of President Humala were focused on the objective to reduce and alleviate poverty (Presidencia de la República, 2011) [37]. In this section, it will be analyzed the principal social programs targeted on children during the present government. To approach that, it will be used the LSMS 2014, so as to estimate the population treatment, in other words, the beneficiaries of the social programs. Starting from the information and target population, it will be calculated the under coverage, leakage and costs of inefficiency for the social programs under both poverty measurement methods. It is possible to compare both poverty approaches because for both frameworks, it is considered the extreme poverty
condition as the main requisite. Social programs considered will be explained down below
3.1.1. Under Coverage
Source: LSMS 2014 (upgraded methodology)
Elaborated by: Centro de Investigación de la Universidad del Pacífico 3.2.1. Leakage
Source: LSMS 2014 (upgraded methodology)
Elaborated by: Centro de Investigación de la Universidad del Pacífico Social programs cost of inefficiency by 2014
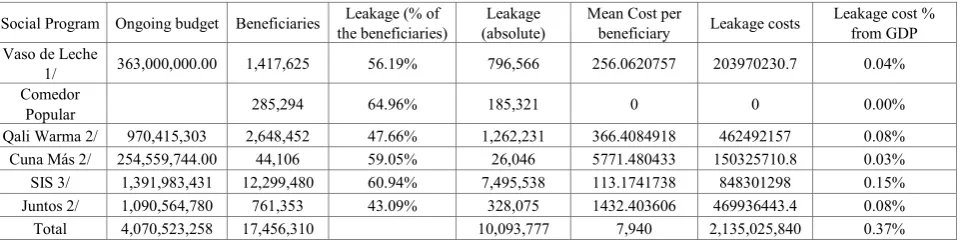
The under coverage and leakage generate costs for the government. The under coverage generated costs in two ways. The first is the future cost that generates the deficit of coverage on the target population. The second way is referred to the wasted benefits due to the fact that there were people that were wrongly chosen as beneficiaries. Despite of it, the cost hasn’t been considered due to the complexity of its calculation. The leakage generates unnecessary costs for the government on the population that is not the target for the social program. By 2014, the cost of inefficiency was 0.37% of the GDP and in absolute terms, it was 166,055,280 million dollars.
The methodology used to get the total cost of inefficiency for the mentioned social programs, imply the calculation of the mean cost per beneficiary and for that, it was necessary to divide the budget of the social program by the quantity of beneficiaries according to the website data center. Finally, the mean cost per beneficiary was multiplied for the quantity of leakage population inside social programs.
Under the leakage definition, it can be said that the administrator of the social programs due to the mistakes when targeting and allocating resources directly influences the cost. In other words, the government has made an inadequate expenditure given the fraction of resources that in other case would have been allocated in a better way if there were better targeting, maybe more costs in the short term but more expected benefits in the long run (Vásquez, 2013) [39].
Table 9. Effectiveness of nonfood aid and food aid programs. Peru: 2014 (absolute and percentage values)
Social Program Ongoing budget Beneficiaries the beneficiaries) Leakage (% of (absolute) Leakage Mean Cost per beneficiary Leakage costs Leakage cost % from GDP Vaso de Leche
1/ 363,000,000.00 1,417,625 56.19% 796,566 256.0620757 203970230.7 0.04%
Comedor
Popular 285,294 64.96% 185,321 0 0 0.00%
Qali Warma 2/ 970,415,303 2,648,452 47.66% 1,262,231 366.4084918 462492157 0.08%
Cuna Más 2/ 254,559,744.00 44,106 59.05% 26,046 5771.480433 150325710.8 0.03%
SIS 3/ 1,391,983,431 12,299,480 60.94% 7,495,538 113.1741738 848301298 0.15%
Juntos 2/ 1,090,564,780 761,353 43.09% 328,075 1432.403606 469936443.4 0.08%
Total 4,070,523,258 17,456,310 10,093,777 7,940 2,135,025,840 0.37%
Fuente: ENAHO 2014 (metodología actualizada) y SIAF 2014
1/ Ministerio de Economía y Finanzas. (2015). Transparencia Económica. Recuperado el 08 de 24 de 2015, de http://apps5.mineco.gob.pe/transferencias/cuadros/Hoja1_1.aspx
2/ Ministerio de Economía y Finanzas. (2015). Qali Warma. Recuperado el 23 de 08 de 2015, de Portal de Transparencia: http://www.peru.gob.pe/transparencia/pep_transparencia_info_finan_frame.asp?id_entidad=14219&id_tema=19 3/ Ministerio de Economía y Finanzas. (2015). Transparencia. Recuperado el 25 de 08 de 25, de Sistema Integral de Salud: http://www.sis.gob.pe/Portal/transparencia/transparencia.html
[image:20.595.67.549.573.695.2]The social program exhibit the major problems of the administration of the SIS, due to the quantity of leakage is almost 7,495,538 people, in other words, 6 out of 10 beneficiaries receive benefits without completing the desired characteristics. As a result, the inefficiency of this program had generated an unnecessary cost equal to 0.15% from GDP. As well, Qali Warma and Juntos social programs had generated a cost of inefficiency of 0.08% of the GDP each. Even if Juntos represent the lower level of leakage (328,075 people), its mean cost per beneficiary is high (1432.40 soles or 506 dollars) what means a cost of similar to Qali Warma, where the quantity of leakage is high (1262231 people) but its mean cost per beneficiary was relatively low (366.50 soles or 129 dollars) As mentioned before, the government must invest on better targeting tools that may be more expensive, but in the long run will prevent from more unnecessary interventions generated by the inefficiency of the administration and targeting.
4. Conclusions
In general, even if the monetary poverty gives us a percentage slightly below the multidimensional poverty, this small gap does not mean that monetary poverty is a good indicator or is as useful as the multidimensional poverty indicator. The monetary approach measures poverty is also referential and do not give any information about the deprivations of the population studied. Consequently, it is insufficient to take decisions that may intend to reduce deprivations of poor people in Peru. In that way, it is possible to have a holistic vision of the conditions over the poor rural areas, where the monetary approach underestimated the poverty level and where it is necessary to take better decisions to prevent other regions that haven’t showed any improve for the deprivations they face, as it happened for the previous 4 years.
In Peru, the monetary approach is widely used therefore as it doesn’t identify deprivations and needs that people maintain in, the multidimensional poverty rate on children, even if it was decreased by 5pp. on 2014 with respect to 2010, it reveals some indicators that still maintain an elevated percentage through years, such as the caloric intake deficit (30%) and public drainage (42.8%) by 2014. In this context, the social policymakers must focus their efforts on an effective administration, so as to have a positive impact over the reduction of the 10 indicators from the MPI. Despite of it, from the per capita expenditure for Peru, we can conclude that there exist some regressive path for the social public expenditure, in other words, it is not oriented to poor children because they receive a lower social expenditure per capita compared to the children from the least multidimensional poor areas.
By 2014, it was found that one out of five children hasn’t been protected by the healthcare insurance. In other words, almost 418,383 multidimensional poor children that faced any symptom, illness or pain, were not able to be assisted in a
medical center because the government do not give this service for free if they are not insured. This critical situation might be attributed Health Insurance (SIS in Spanish), because its coverage was estimated on 597,248 children not protected by the government.
When examining the deprivation on caloric intake deficit, we found that the incidence was real critical for all multidimensional poor age groups (by 2014, children from 0 to 5, 79.2%; children from 6 to 11, 70.8% and age group from 12 to 17, 68.4%). Additionally, the percentage reduction was minimum for all age groups: -1.79% for the age group from 0 to 5 years, in absolute terms 187,578 children already consumes the required caloric intake by 2014. The same way, ages group from 6 to 11 exhibit a reduction of 1.52% (146,543 people that consume an optimal level), age group from 12 to 17reduced their caloric deprivation by 1.68% (155,334 people left deprivation condition). Nevertheless, these calculations are opposite to the official calculations, so then they reveal different levels of deprivations. It is necessary in this sense to make a review of the structure and calculations made to discover up to what point both methods can be complementary to project a better view of poverty in Peru.
Criteria used to calculate the deprivations on education in the way multidimensional poverty measures, is not enough to capture the whole sense in Peru. By 2014, 767,500 children under multidimensional poverty condition didn’t attend to school, 23,830 were got retired from school and 70,450 fail the academic year on 2013. In other words, even if the indicators reflect a good situation in terms of school enrolment and family school attendance, during the time children do not attend to school they do other labors, such as children work; therefore, they finally fall into school desertion. This has generated by 2014, 170,640 children under multidimensional poverty condition that declared to be delayed with respect to the year they must be studying according to their age. This problem, as time goes, can generate more pressure and make stimulate many other children to leave the school.
A comparison between both rural and urban areas reveals that there existed a great improved of multidimensional poverty for children. In the rural areas, the reduction for the coast was about -17.49% (99,183 poor people by 2014), -11.40% in the highlands (944,806 poor people by 2014) and -19.35% in the amazon jungle (389,025 poor people by 2014). Specifically, in the urban area there was also some improves: -10.92% in the coast (207,459 poor people by 2014), -7.33% in the highland (215,579 poor people by 2014), and 24.31% in the amazon jungle (144,678 poor people by 2014) and 29.31% in the city of Lima (107,389 poor people by 2014). This meant that the government fight against multidimensional deprivations is not excluding both urban and rural areas.
that sense, there exist people that are not considered or targeted by those programs even if they are under poverty conditions. Furthermore, none of the social programs can reach to the 100% of efficiency by 2014. The same way, leakage inside social programs was very high, with the exception of Cuna Mas, due to the fact that they have increased their levels of leakage since 2013, which means that inside the beneficiary group there are people that are moving faster to become beneficiaries compared to the ones who are correctly targeted. This difference between both monetary and multidimensional approach is about 797,162 people that haven’t been targeted by the social program, even if they belong to the target population.
The consequence of the leakage was almost 5,971,310,206 dollars from 2010 to 2014. The program Qali Warma inefficiency costs were almost 50% from the total invested by 2014. This numbers may call the attention of policymakers so they may do the corrective actions so as to make and efficient expenditure and accomplish the so much desired social inclusion.
REFERENCES
[1] INEI. (Abril de 2015). Evolución de la pobreza monetaria: 2010 - 2014. Obtenido de INEI: http://www.inei.gob.pe/med ia/cifras_de_pobreza/informetecnico_pobreza2014.pdf [2] MEF. (s.f.). ¿Qué se entiende por pobreza Monetaria?
Recuperado el 9 de Agosto de 2015, de Política y economía social: http://www.mef.gob.pe/index.php?view=items&cid= 1%3Apolitica-economica-y-social&id=399%3A88-ique-se-e ntiende-por-pobreza-monetaria&option=com_quickfaq&lan g=es
[3] Alkire, S., & Foster, J. (Marzo de 2013). How Multidimensional Poverty Went Down. Recuperado el 13 de Agosto de 2015, de OPHI: http://www.ophi.org.uk/wp-conte nt/uploads/HowMultidimensional-Poverty-went-down.pdf [4] OPHI. (Septiembre de 2013). ¿Por qué mediciones
multidimensionales de la pobreza? Recuperado el 10 de Agosto de 2015, de http://www.ophi.org.uk/wp-content/uplo ads/SS13-Why-MD-Poverty-Measures_ES.pdf?7ff332&90c 0eb
[5] OPHI. (Septiembre de 2013). ¿Por qué mediciones multidimensionales de la pobreza? Recuperado el 10 de Agosto de 2015, de http://www.ophi.org.uk/wp-content/uplo ads/SS13-Why-MD-Poverty-Measures_ES.pdf?7ff332&90c 0eb
[6] INEI. (2014). Pobrea y gasto social. Obtenido de sitio web de INEI: http://www.inei.gob.pe/estadisticas/indice-tematico /sociales
[7] (PNAIA 2021) Inversión para la Infancia (15 de Febrero de 2012). Documento de investigación sobre la desnutrición infantil crónica. Recuperado el 25 de Agosto de 2015, de sitio web del MIDIS:http://www.midis.gob.pe/dgsye/data1/files/e nic/eje1/documento
[8] UNICEF. (2014). Obtenido de http://www.unicef.org/peru/sp
anish/gasto-publico-ninos-ninas-adolescentes-2014.pdf [9] Inversión para la Infancia. (15 de Febrero de 2012).
Documento de investigación sobre la desnutrición infantil crónica. Recuperado el 25 de Agosto de 2015, de sitio web del MIDIS:http://www.midis.gob.pe/dgsye/data1/files/enic/e je1/documento-
[10]INEI. (30 de Abril de 2013). Se reduce desnutrición crónica infantil en 1,4 puntos porcentuales. Recuperado el 25 de Agosto de 2015, de sitio web del INEI: http://www.inei.gob.pe/prensa/noticias/se-reduce-desnutricio n-cronica-infantil-en-1-4-puntos-porcentuales/imprimir/ [11]UNICEF. (2014). Recuperado el 25 de Agosto de 2015, de
http://www.savethechildren.es/docs/Ficheros/670/Informe_P obreza_infantil_y_exclusion_social_en_Europa.pdf
[12]Organización de las Naciones Unidas Perú. (2013). Perú: Tercer informe nacional de cumplimiento de los objetivos de desarrollo del milenio. Obtenido de Organización de las Naciones Unidas Perú: http://onu.org.pe/wp-content/uploads /2013/09/PNUD-LIBRO-PERU-web.pdf
[13]Organización de las Naciones Unidas Perú. (2013). Perú: Tercer informe nacional de cumplimiento de los objetivos de desarrollo del milenio. Obtenido de Organización de las Naciones Unidas Perú: http://onu.org.pe/wp-content/uploads /2013/09/PNUD-LIBRO-PERU-web.pdf
[14]Durston, J. (Octubre de 1996). La situación de la juventud rural en América Latina - Invisibilidad y estereotipos. Obtenido de FAO: http://www.fao.org/docrep/X5633S/x563 3s01.htm#TopOfPage
[15]Lavado, P. & Gallegos, J. (1 de Setiembre de 2005). La dinámica de la deserción escolar en el Perú: La dinámica de la deserción escolar en el Perú:. Obtenido de Juntos: http://www.juntos.gob.pe/modulos/mod_infojuntos/docs/115 .pdf
[16]Lavado, P. & Gallegos, J. (1 de Setiembre de 2005). La dinámica de la deserción escolar en el Perú: La dinámica de la deserción escolar en el Perú:. Obtenido de Juntos: http://www.juntos.gob.pe/modulos/mod_infojuntos/docs/115 .pd
[17]Sandoval, A. (2007). Trabajo infantil e inasistencia escolar. Obtenido de Scientific Electronic Library Online: http://www.scielo.br/pdf/rbedu/v12n34/a06v1234.pdf
[18]GRADE. (Septiembre de 2011). Trabajo adolescente y deserción escolar en el Perú. Obtenido de Consorcio de Investigacion Económica y Social: http://old.cies.org.pe/files /documents/investigaciones/educacion/Trabajo-adolescente-y-desercion-escolar-en-el-peru.pdf
[19]GRADE. (Septiembre de 2011). Trabajo adolescente y deserción escolar en el Perú. Obtenido de Consorcio de Investigacion Económica y Social: http://old.cies.org.pe/files /documents/investigaciones/educacion/Trabajo-adolescente-y-desercion-escolar-en-el-peru.pdf
GRADE. (s.f.). Asistencia y deserción en escuelas
secundarias rurales del Perú. Obtenido de GRADE:
http://grade.org.pe/download/pubs/analisis-1.pdf
GRADE. (s.f.). La salud materno-infantil en el Perú: mirando dentro y fuera del sector salud. Obtenido de GRADE: http://www.grade.org.pe/download/pubs/InvPolitD esarr-13.pdf